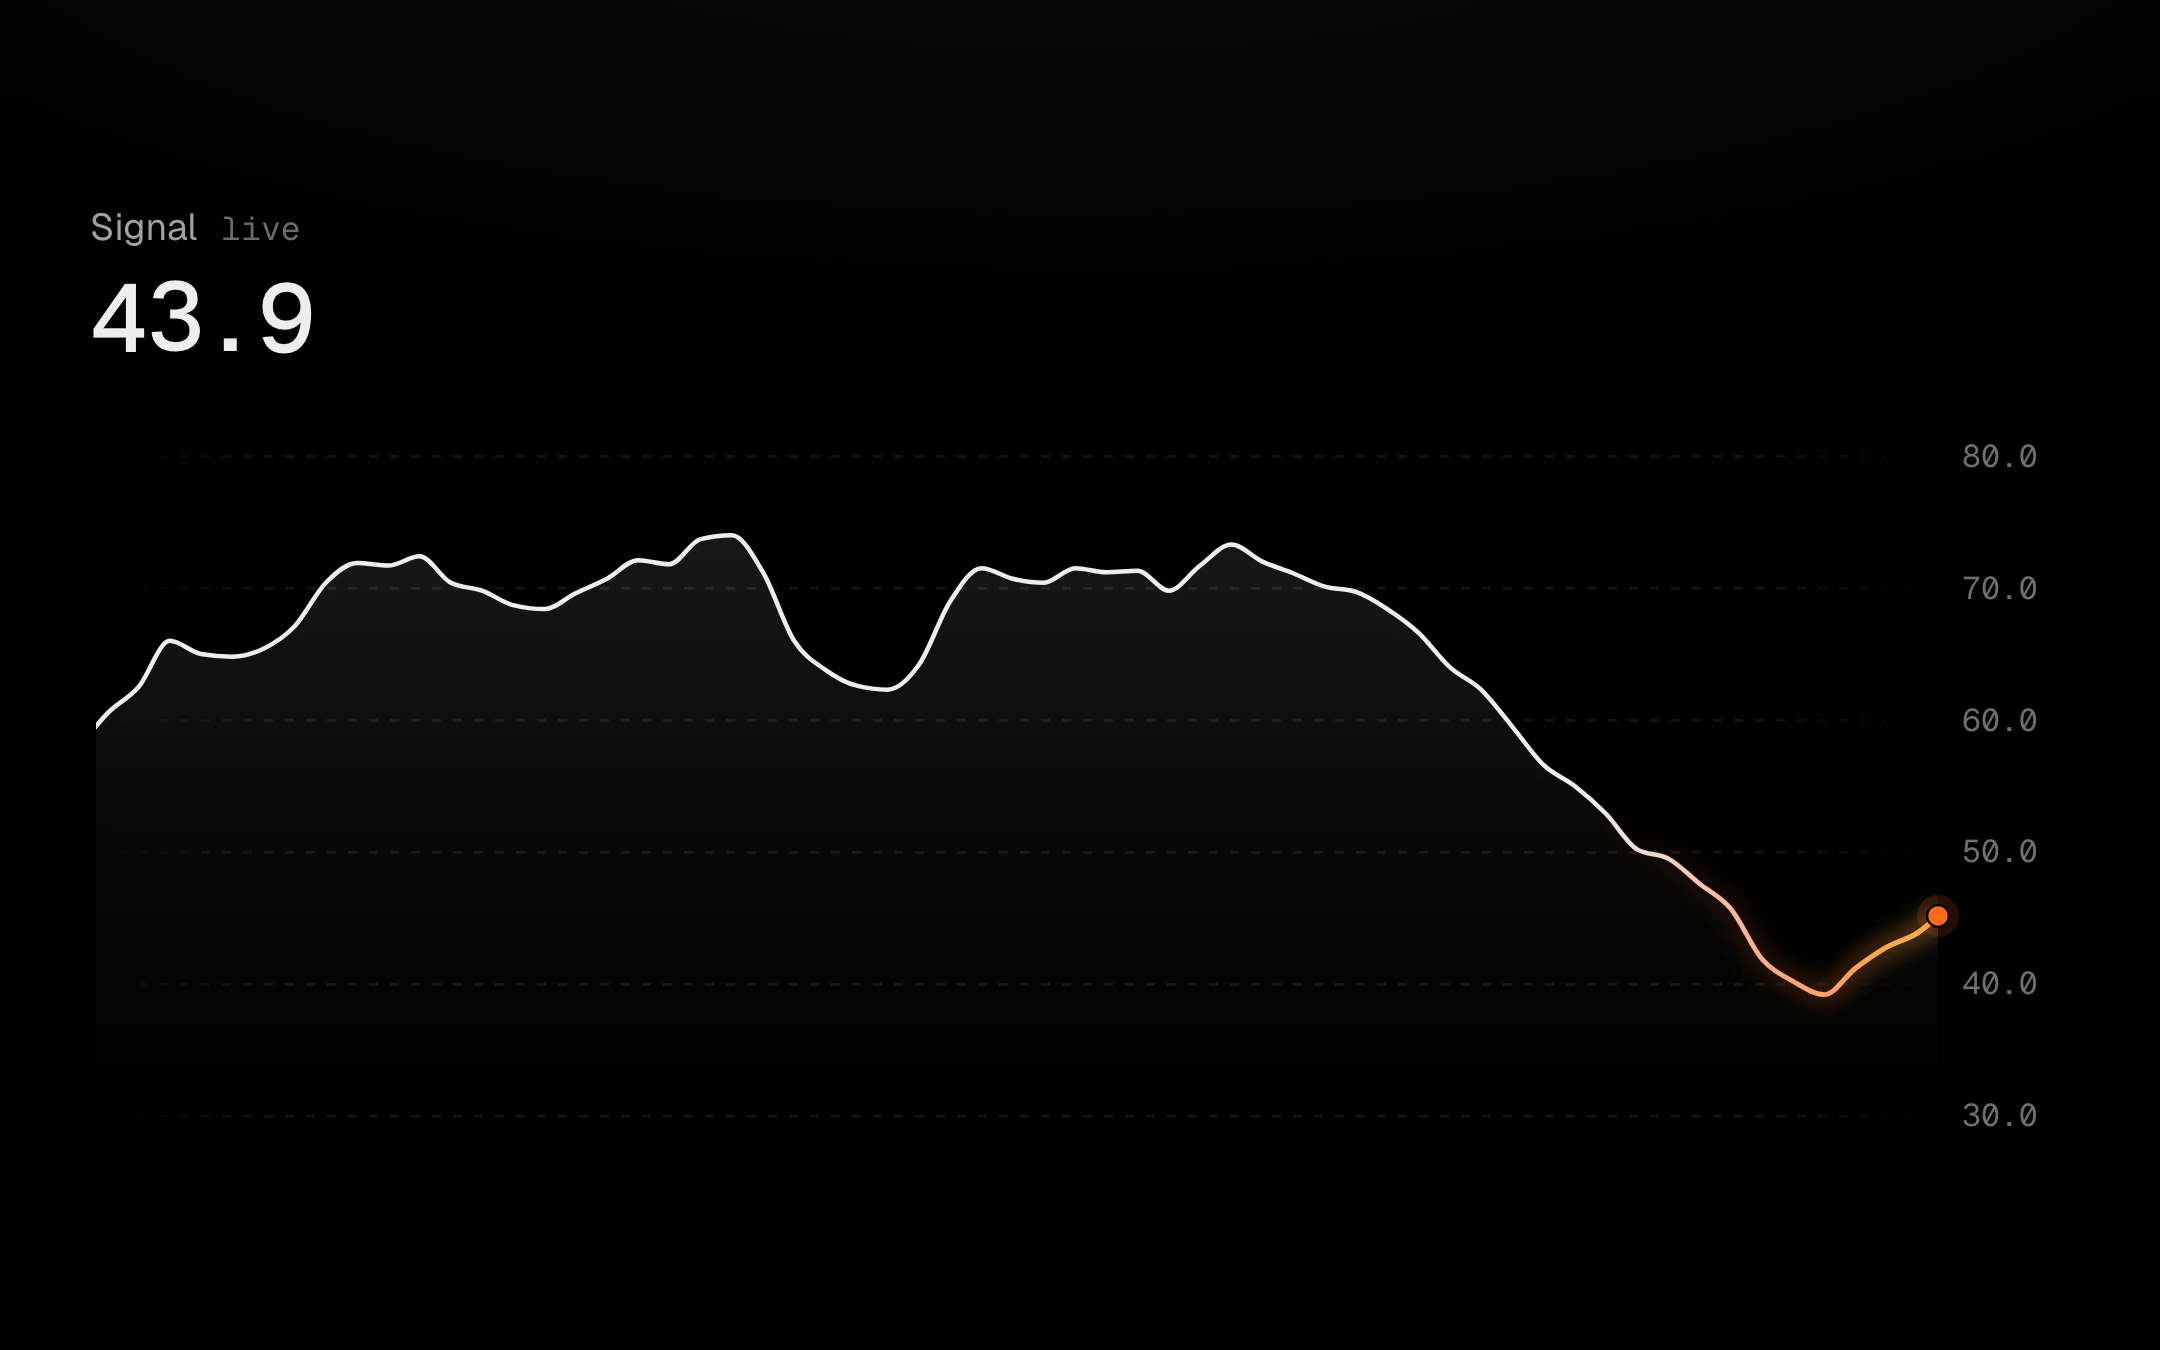
Pulse Line, Pro
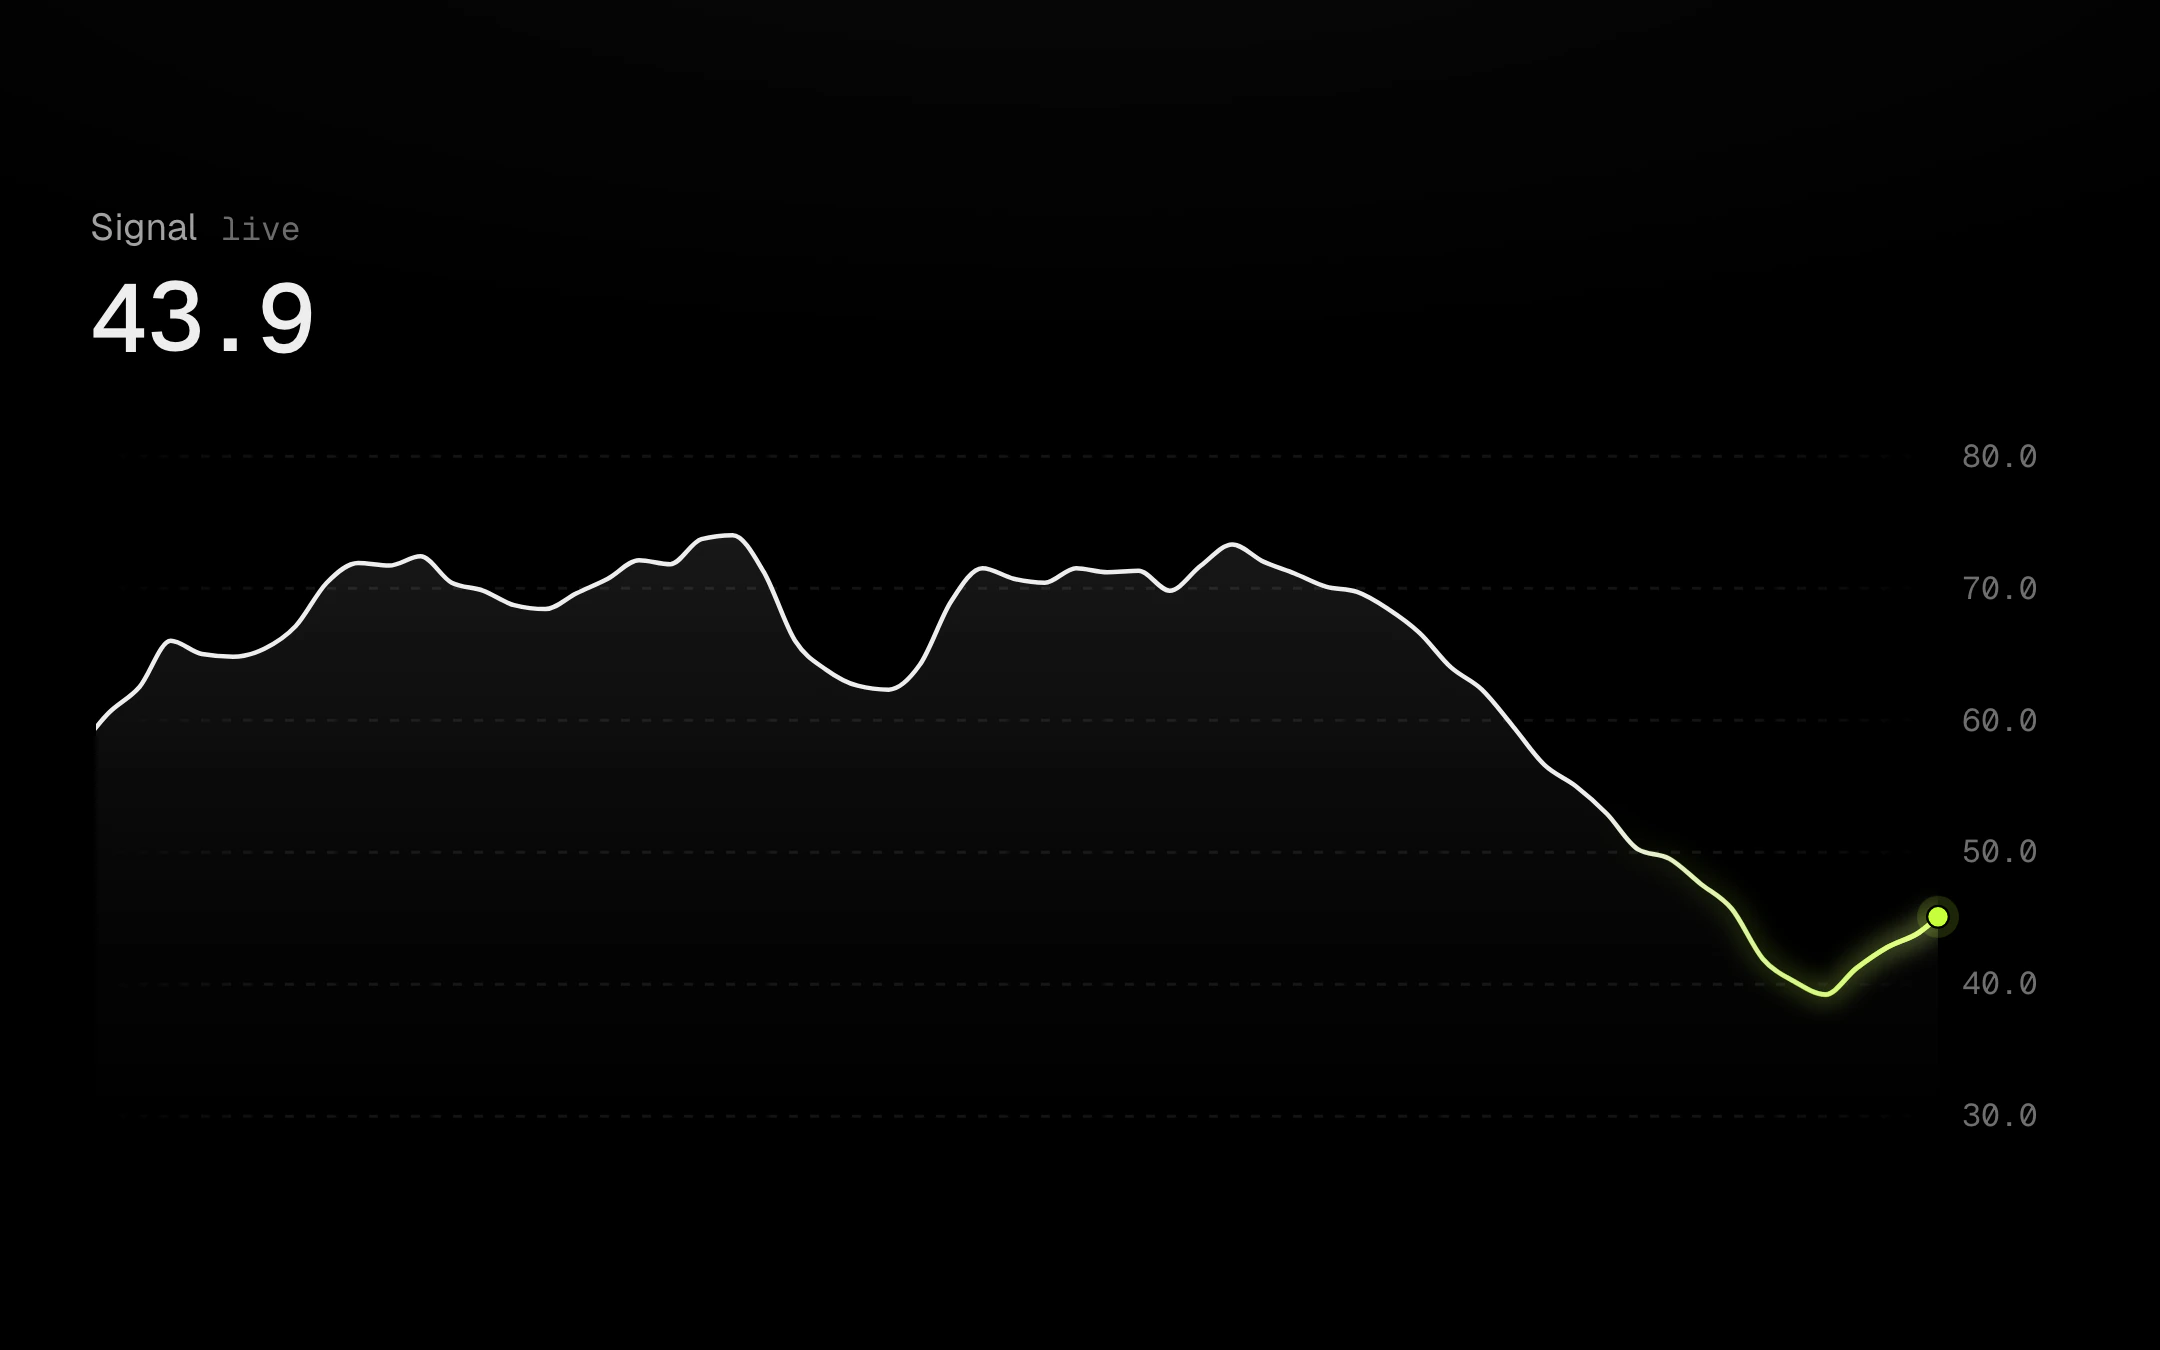
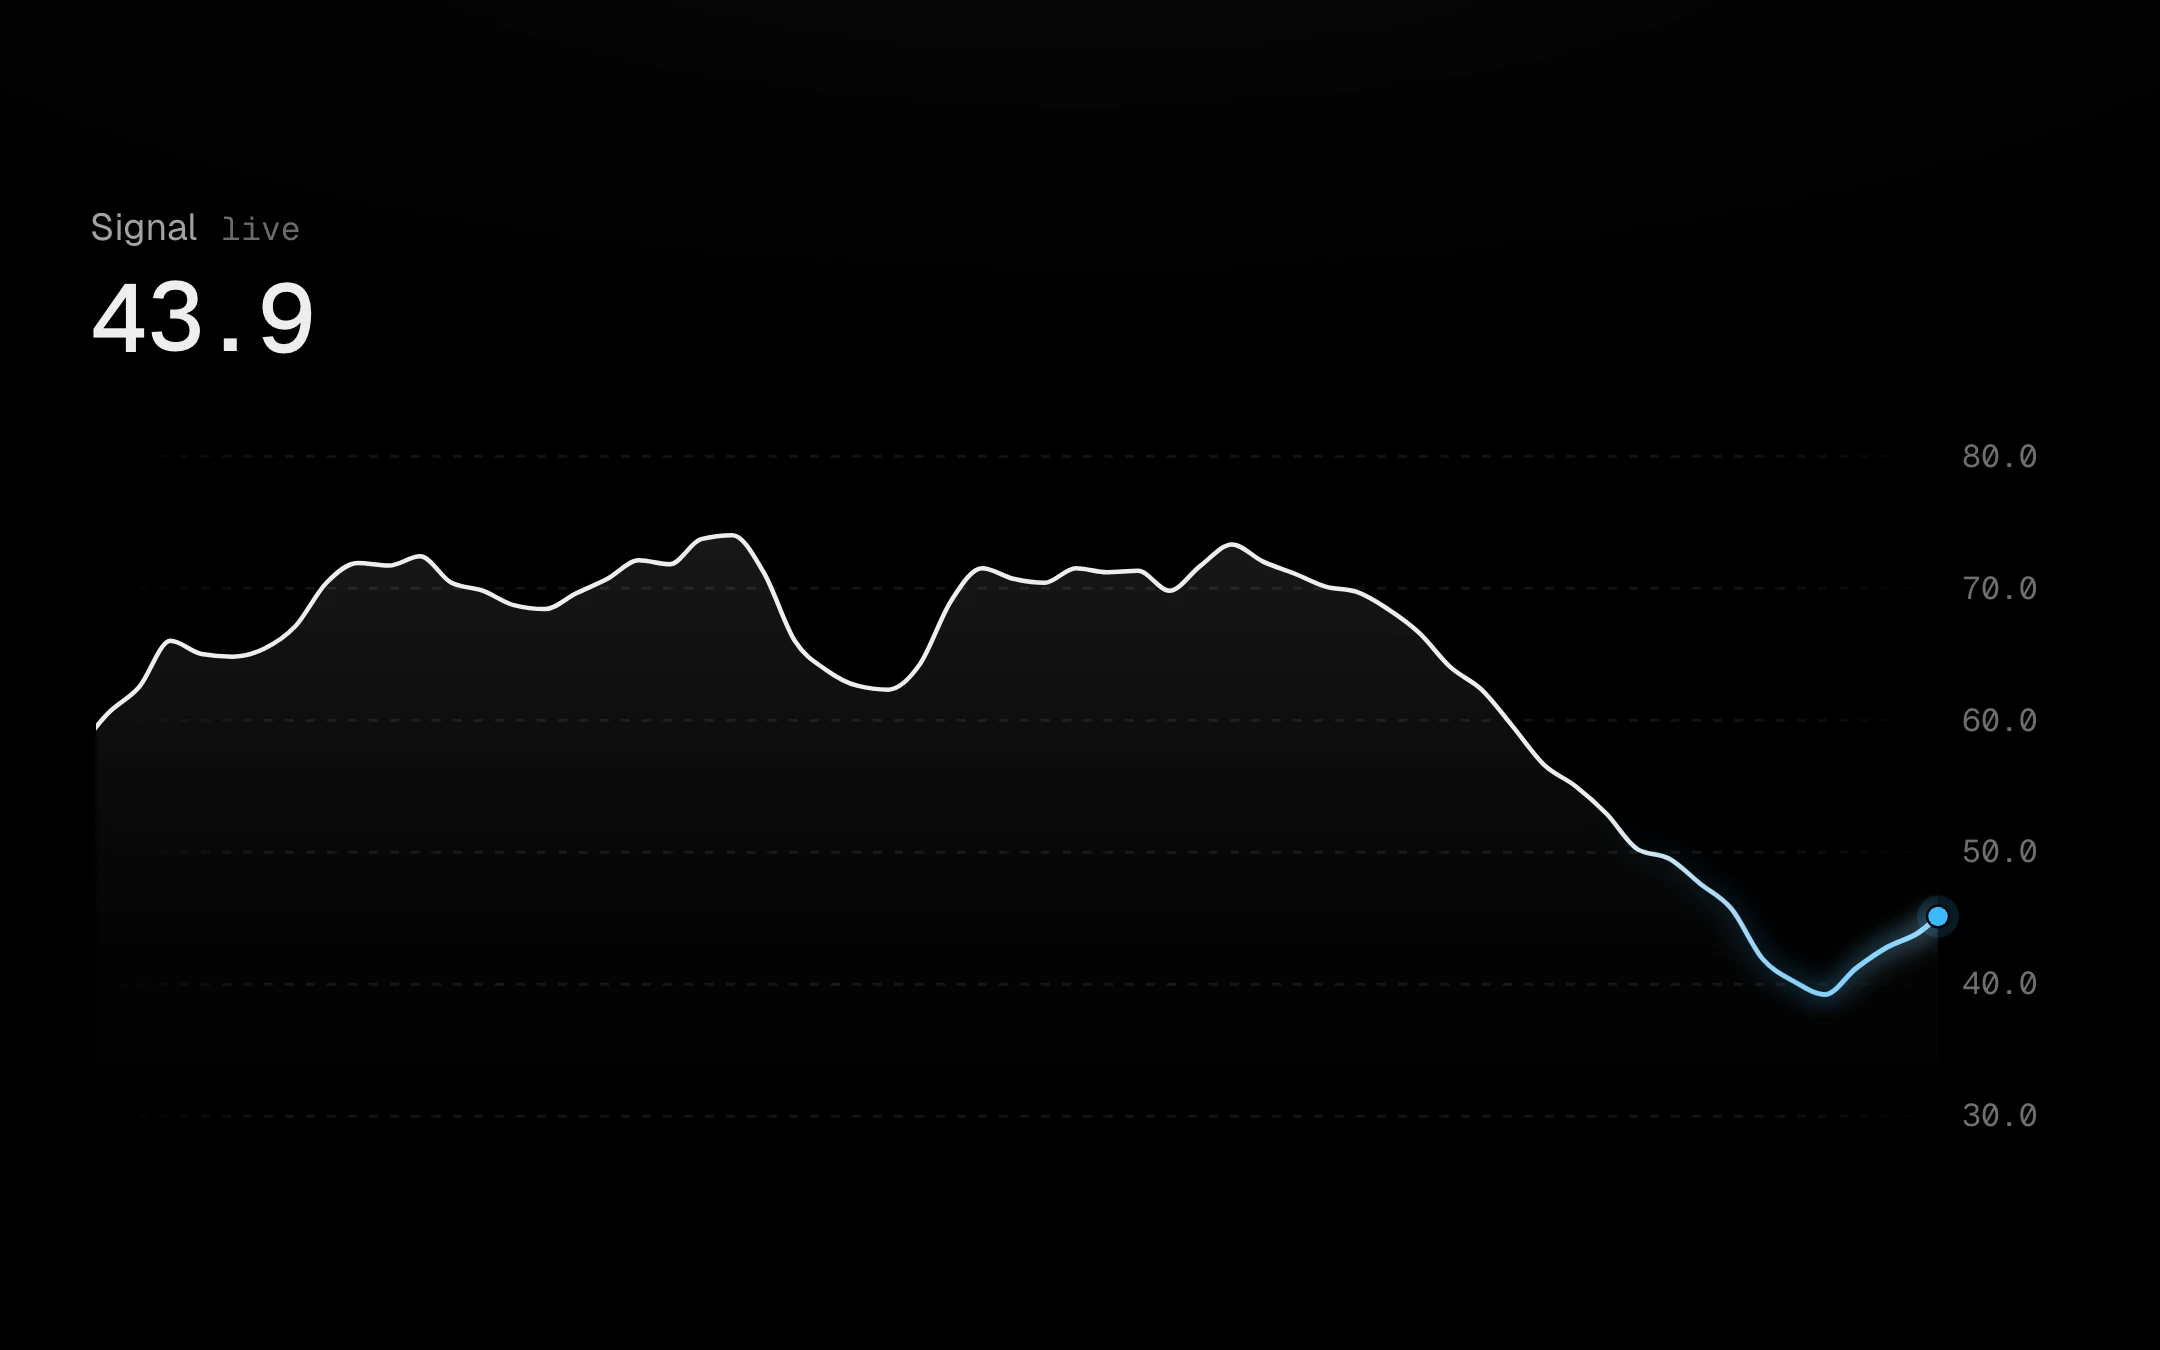
A live line whose newest point is the only hot thing on screen.
Charts
Monochrome at rest. Heat only where the numbers move.
A live line whose newest point is the only hot thing on screen.
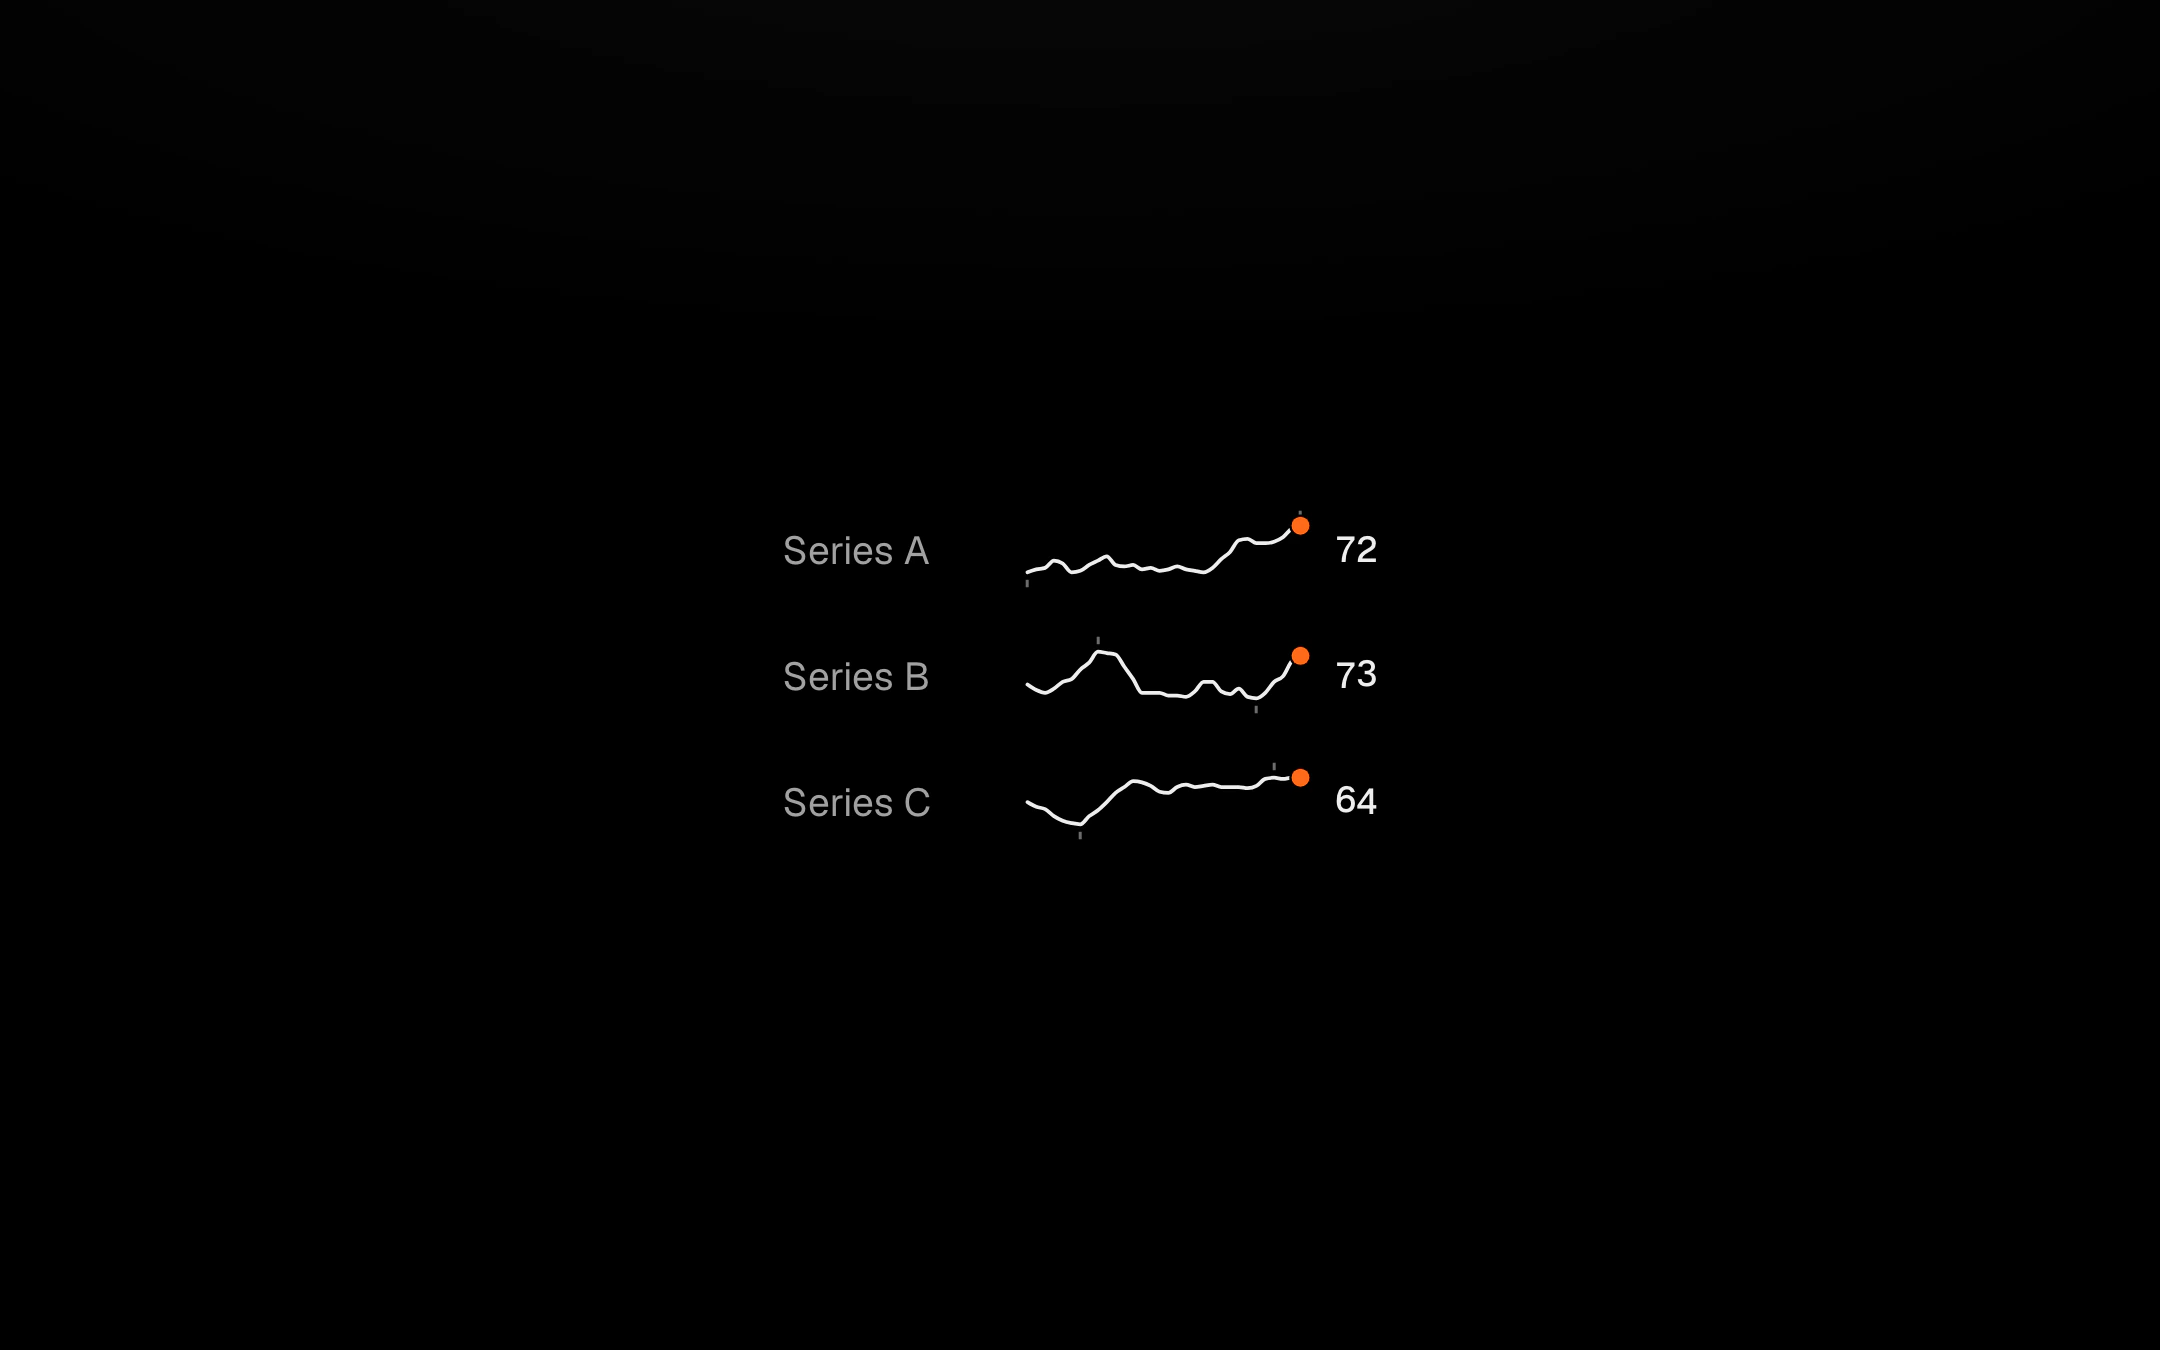
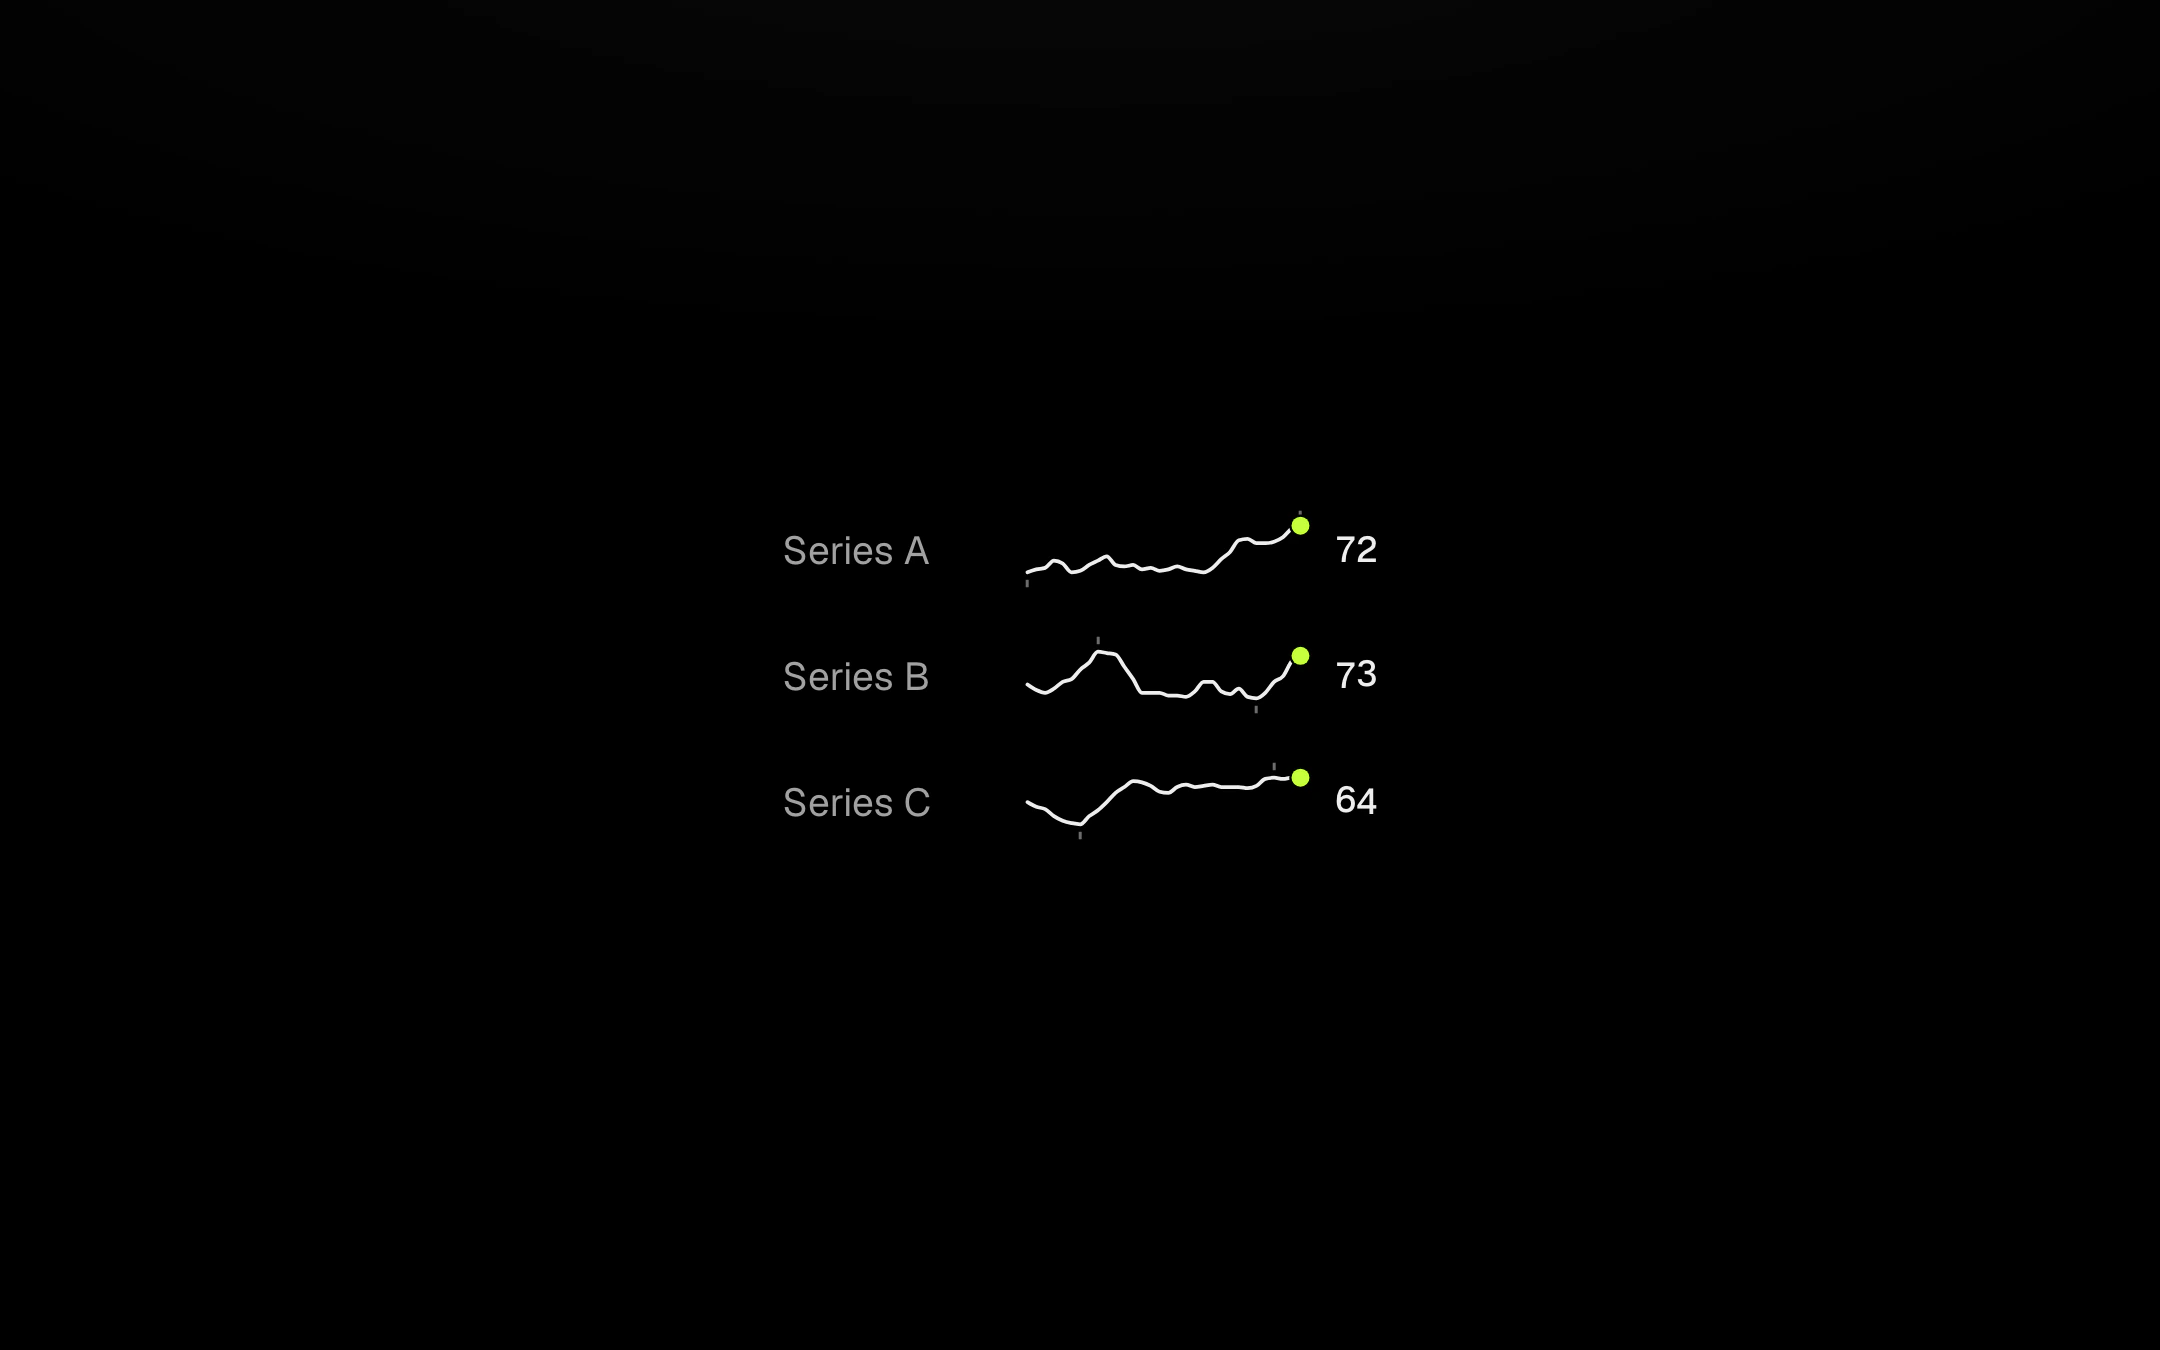
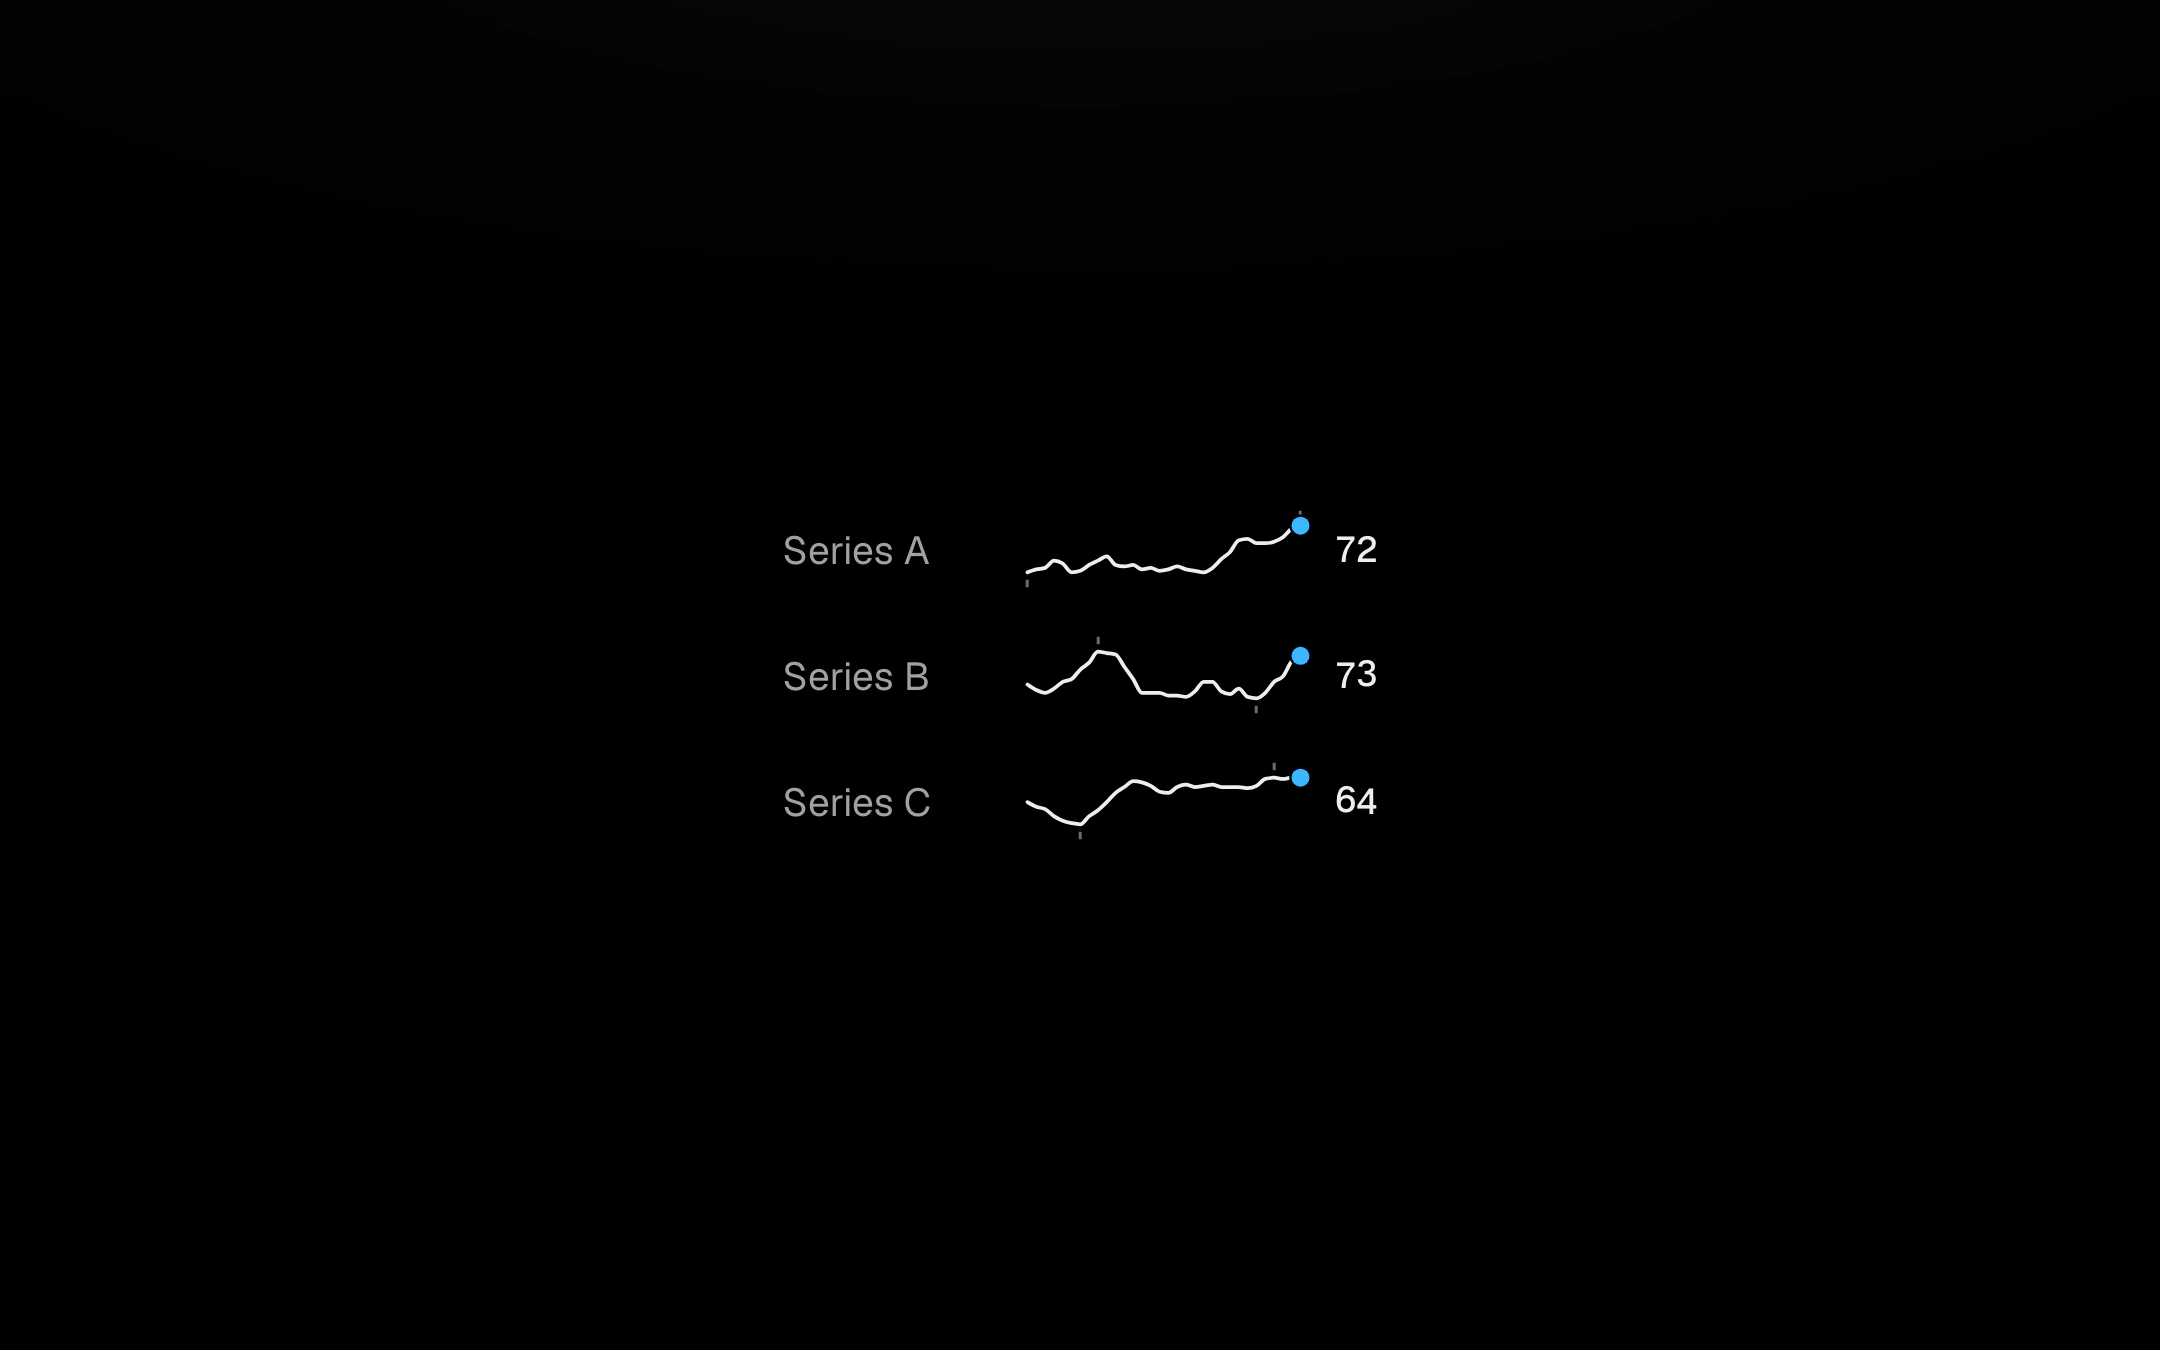
A word-sized line, area or bar run that sits on the text baseline with its latest value beside it, the newest point a hot dot and the low and high marked by 3px ticks.
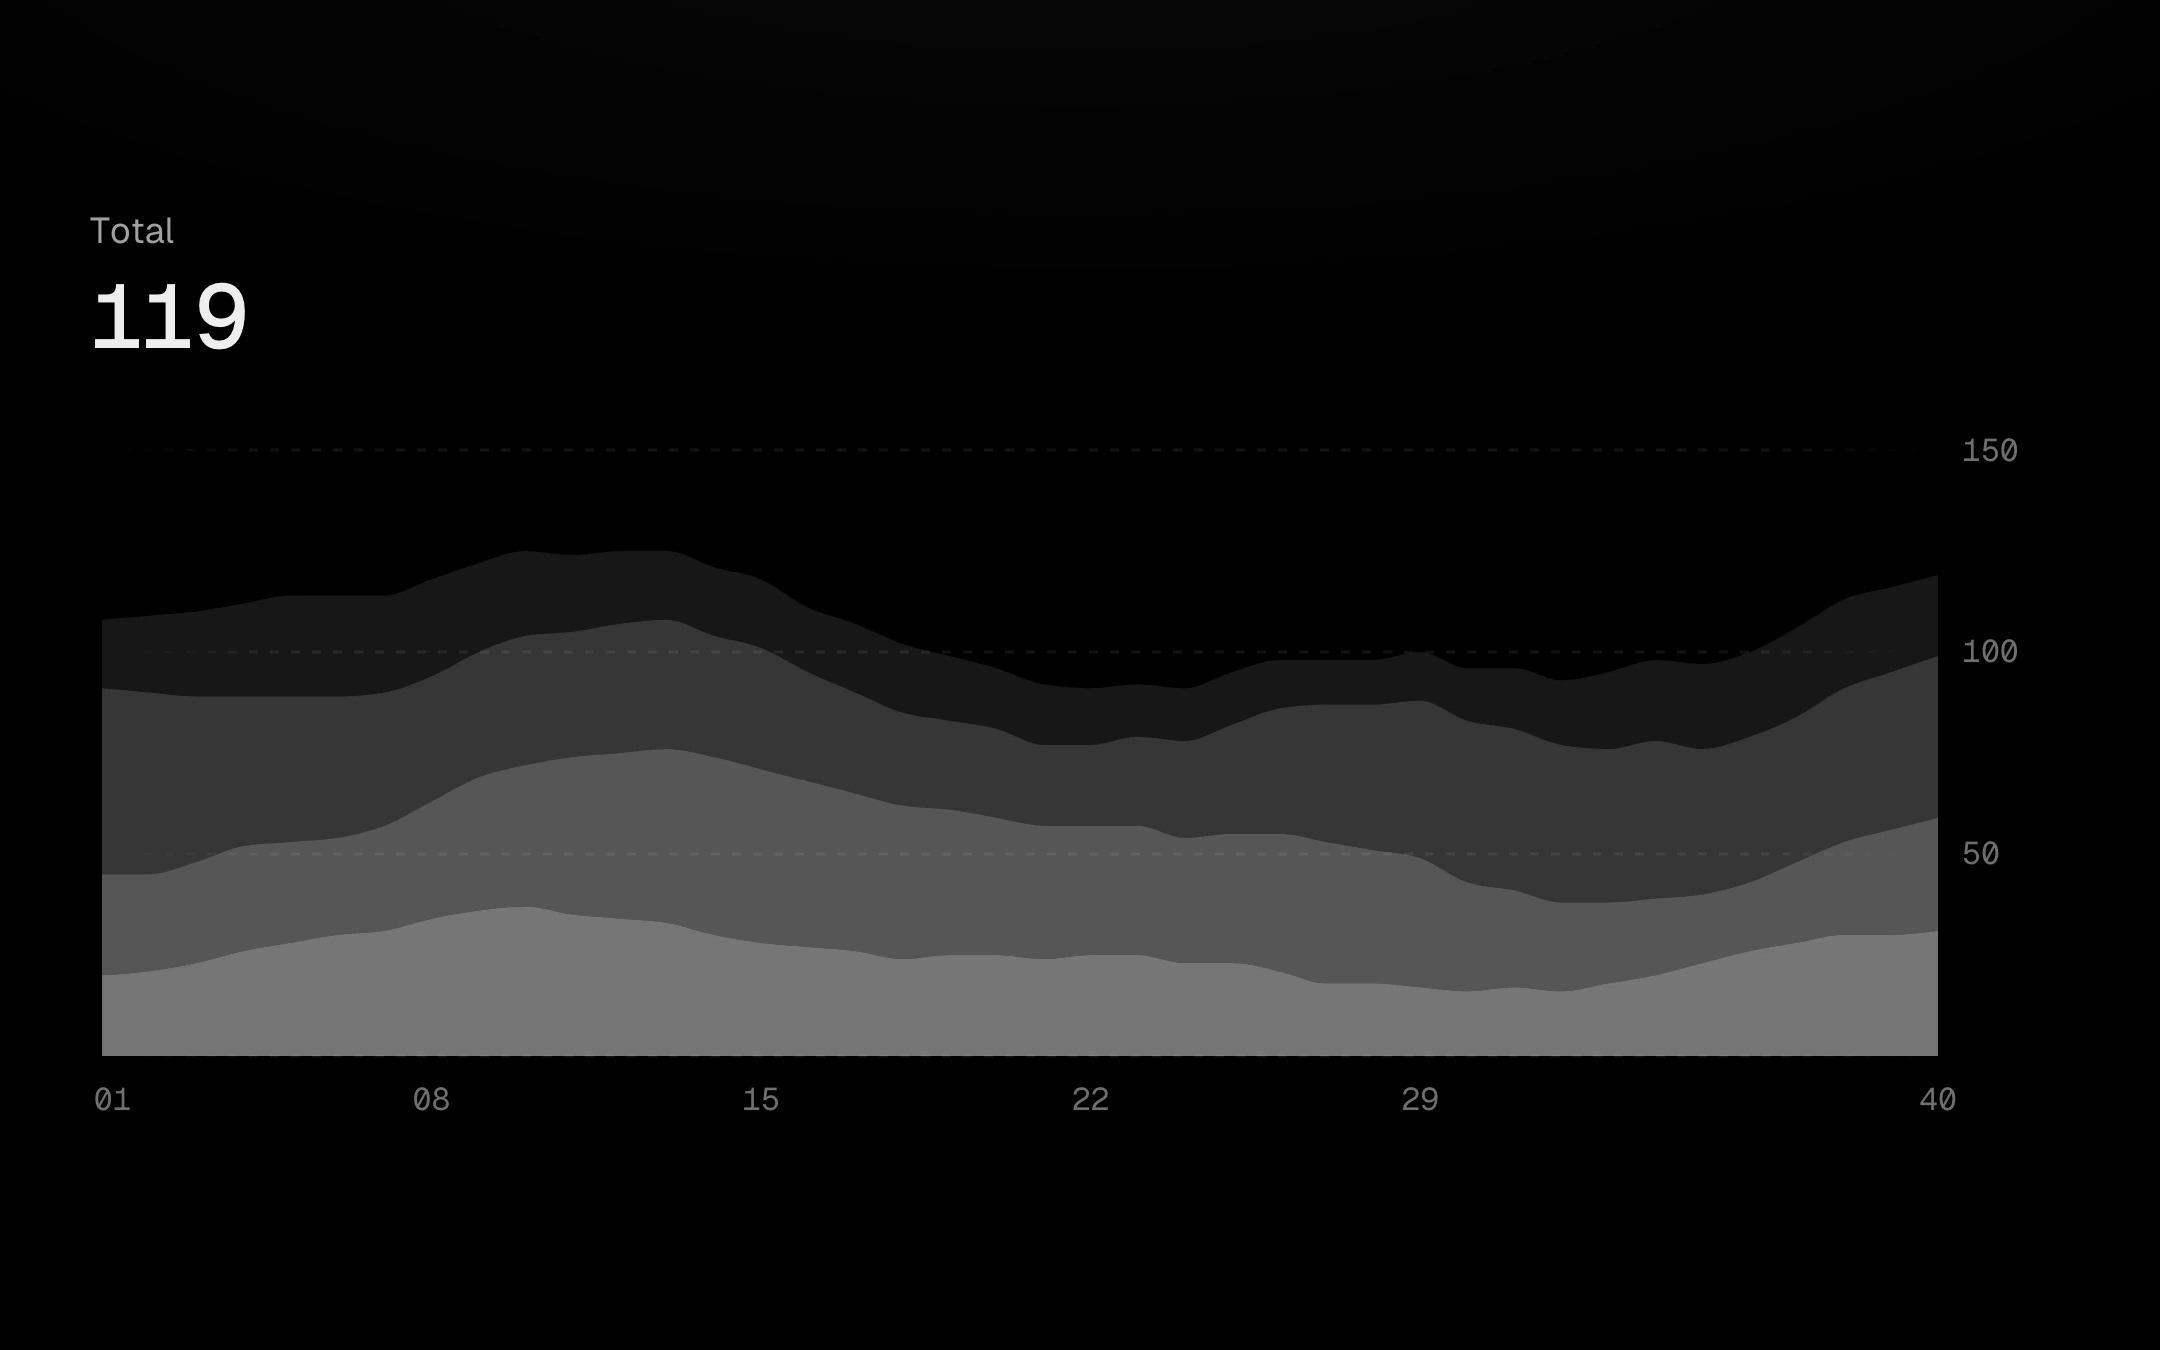
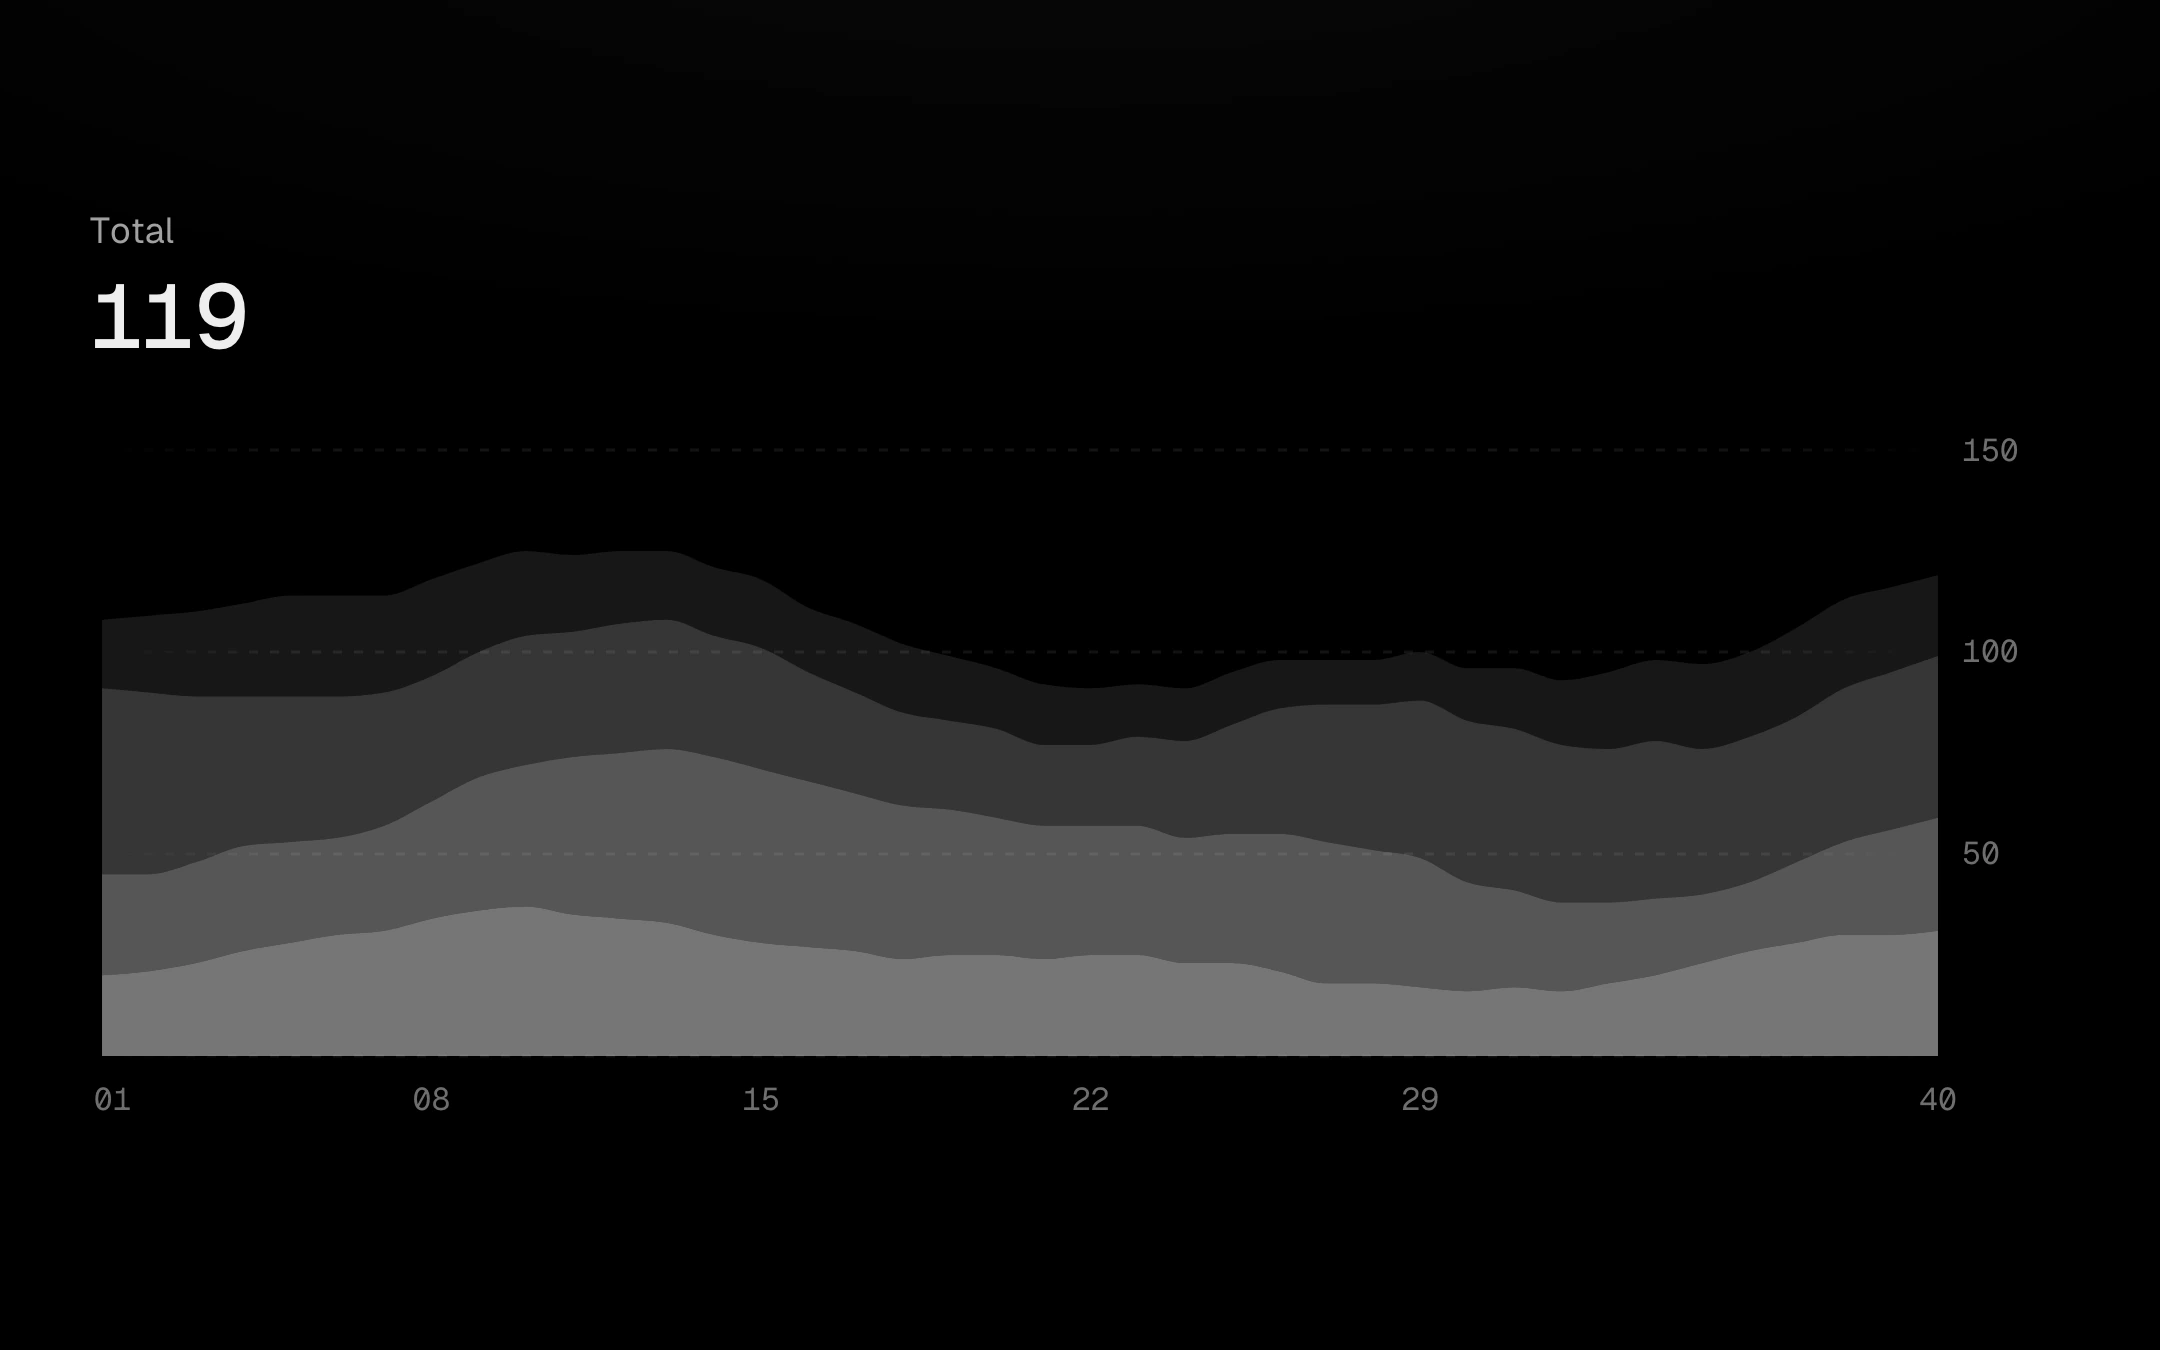
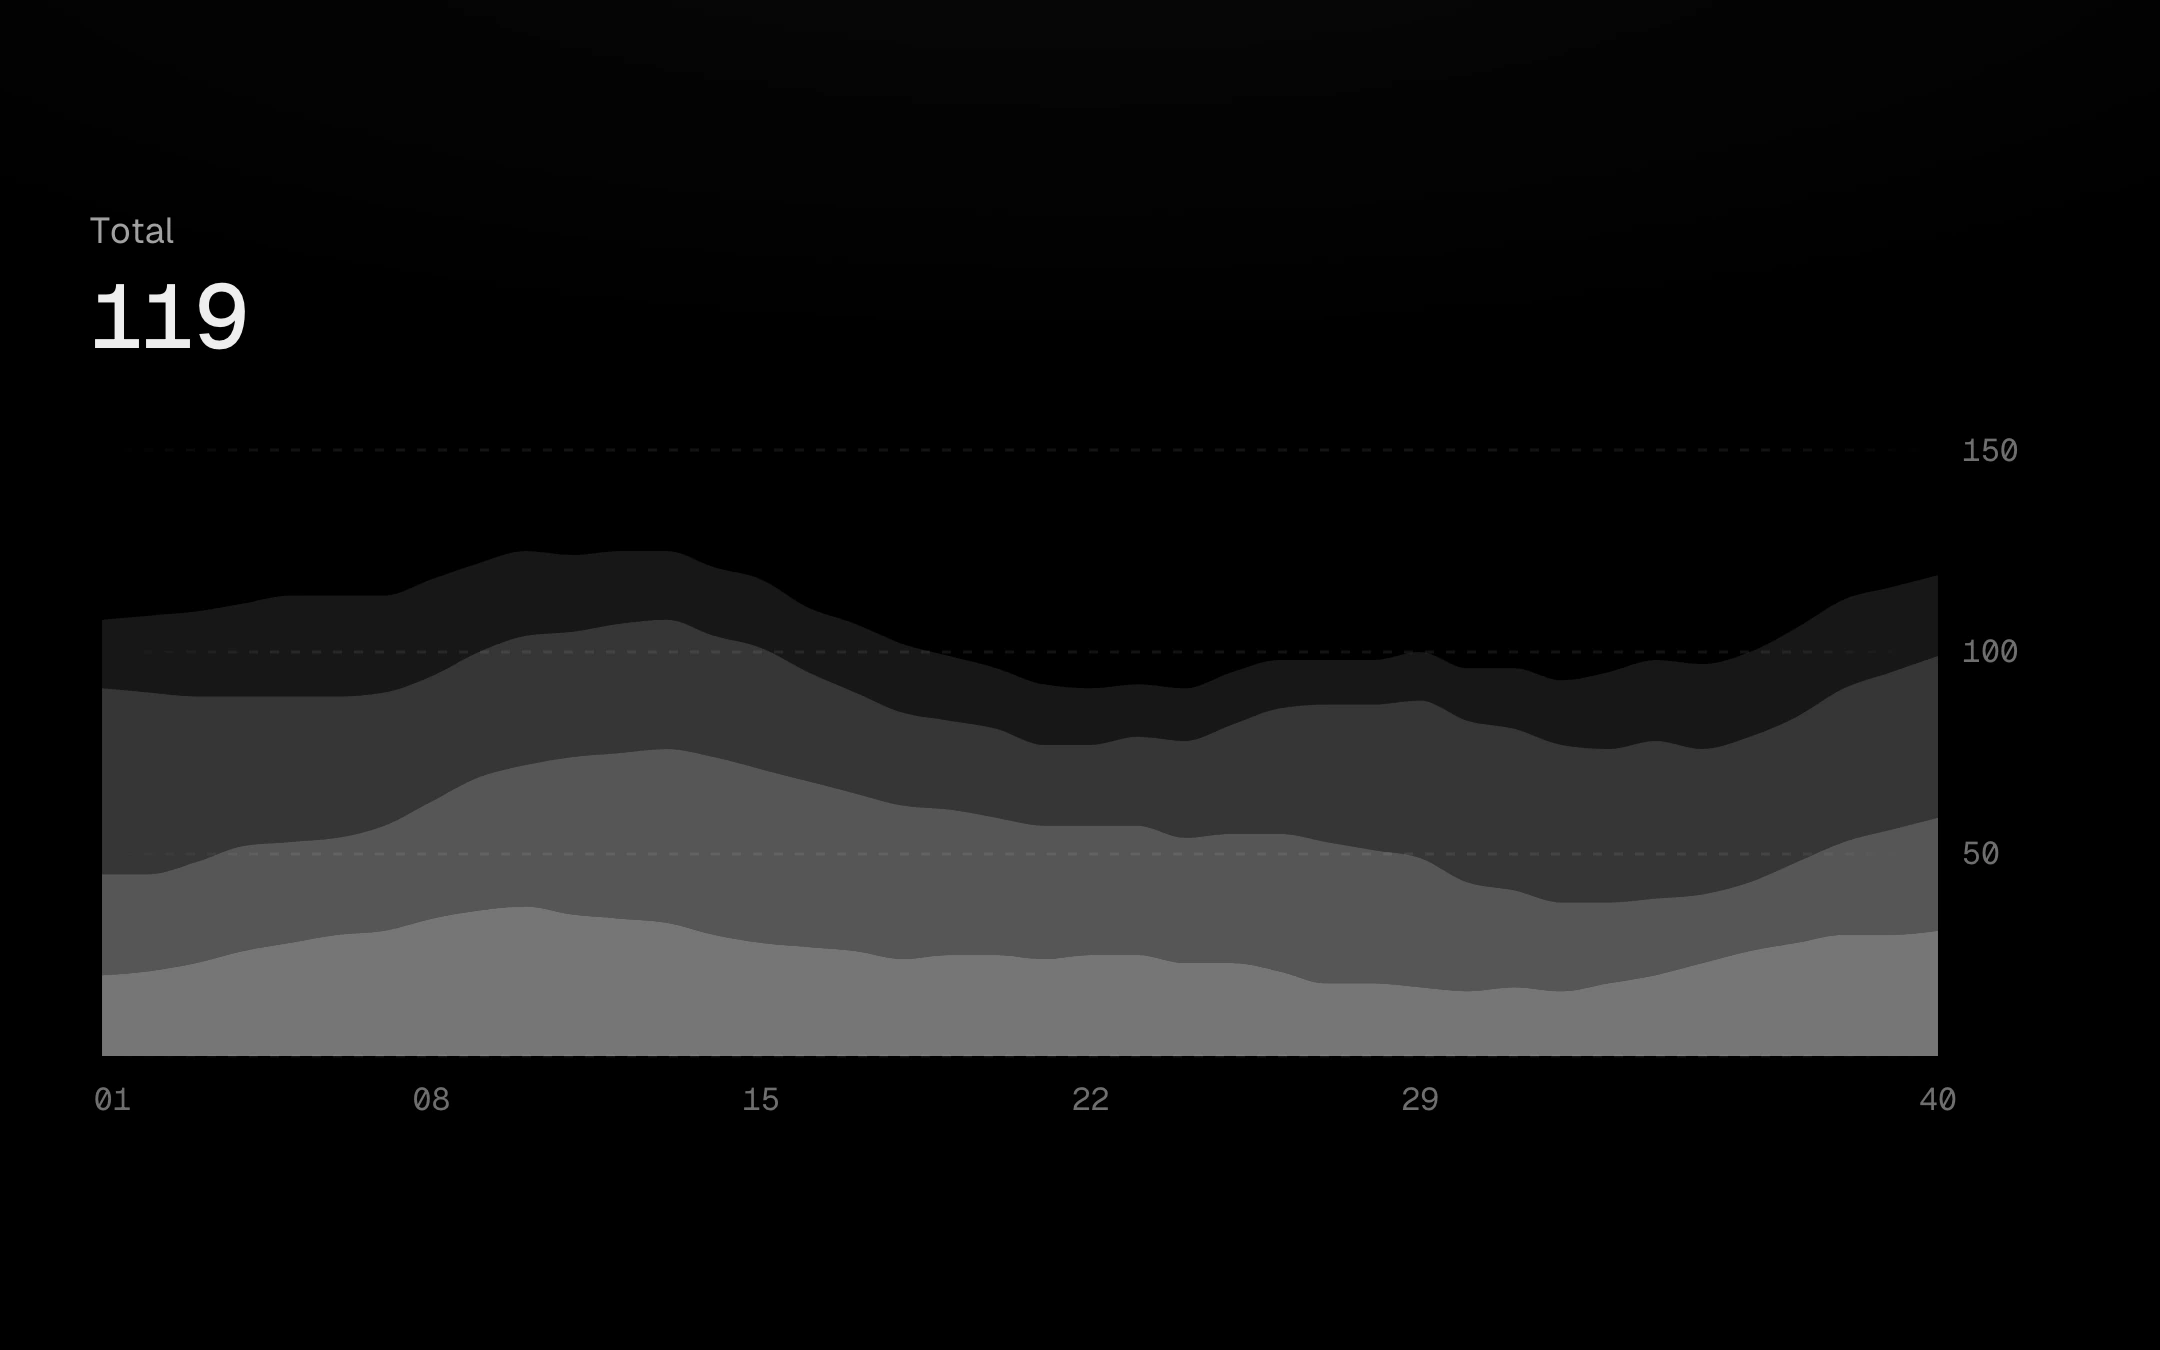
A stacked area chart you can take apart.
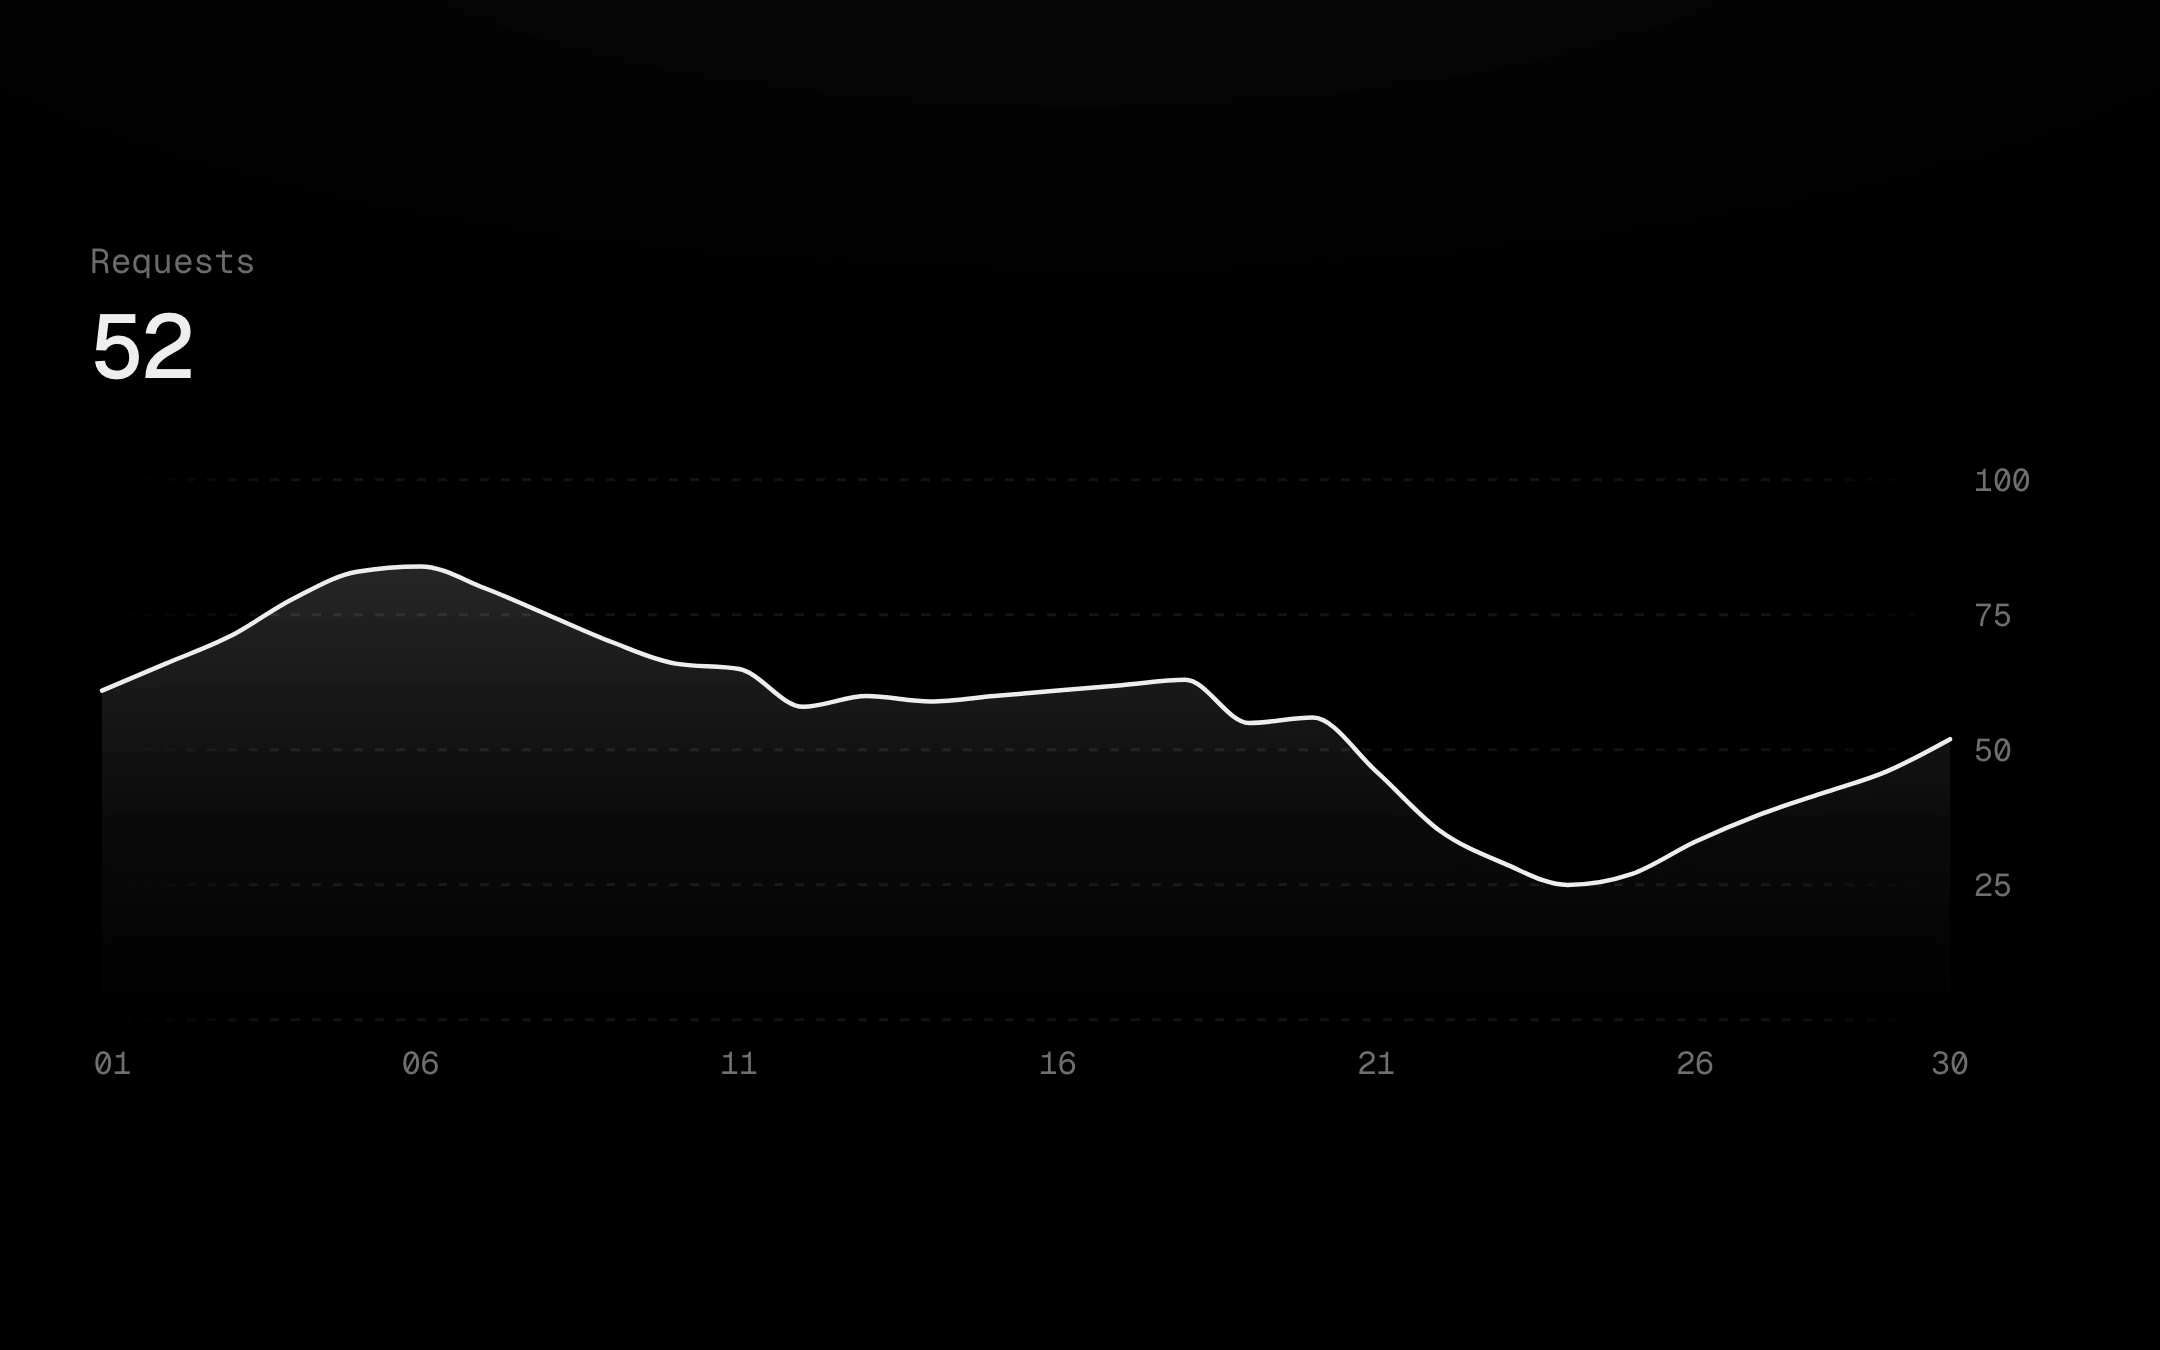
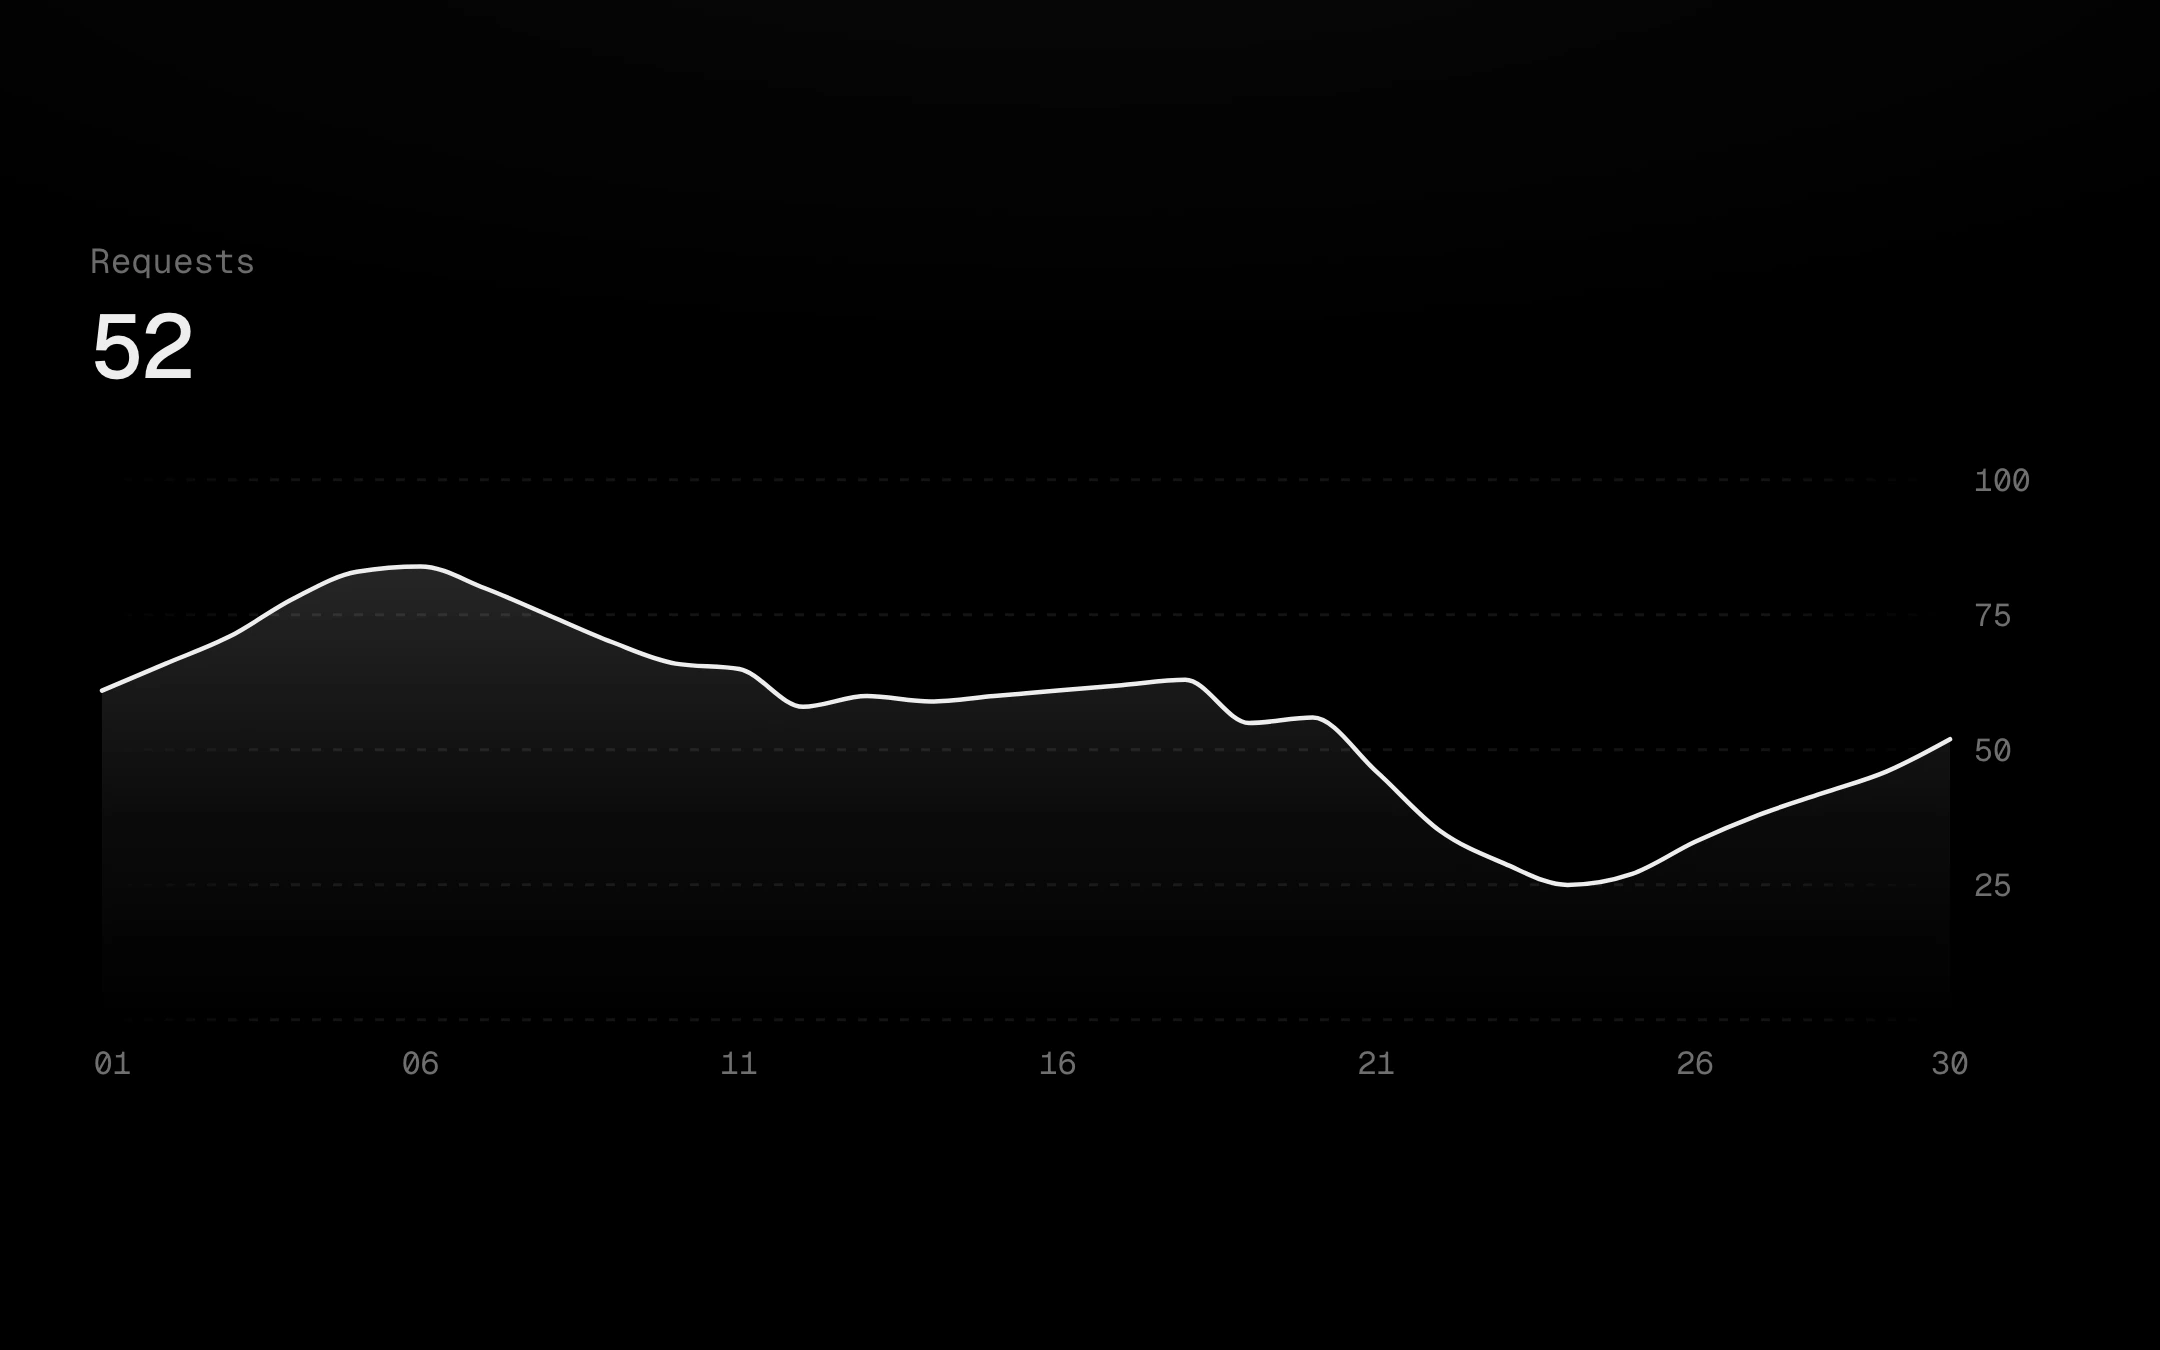
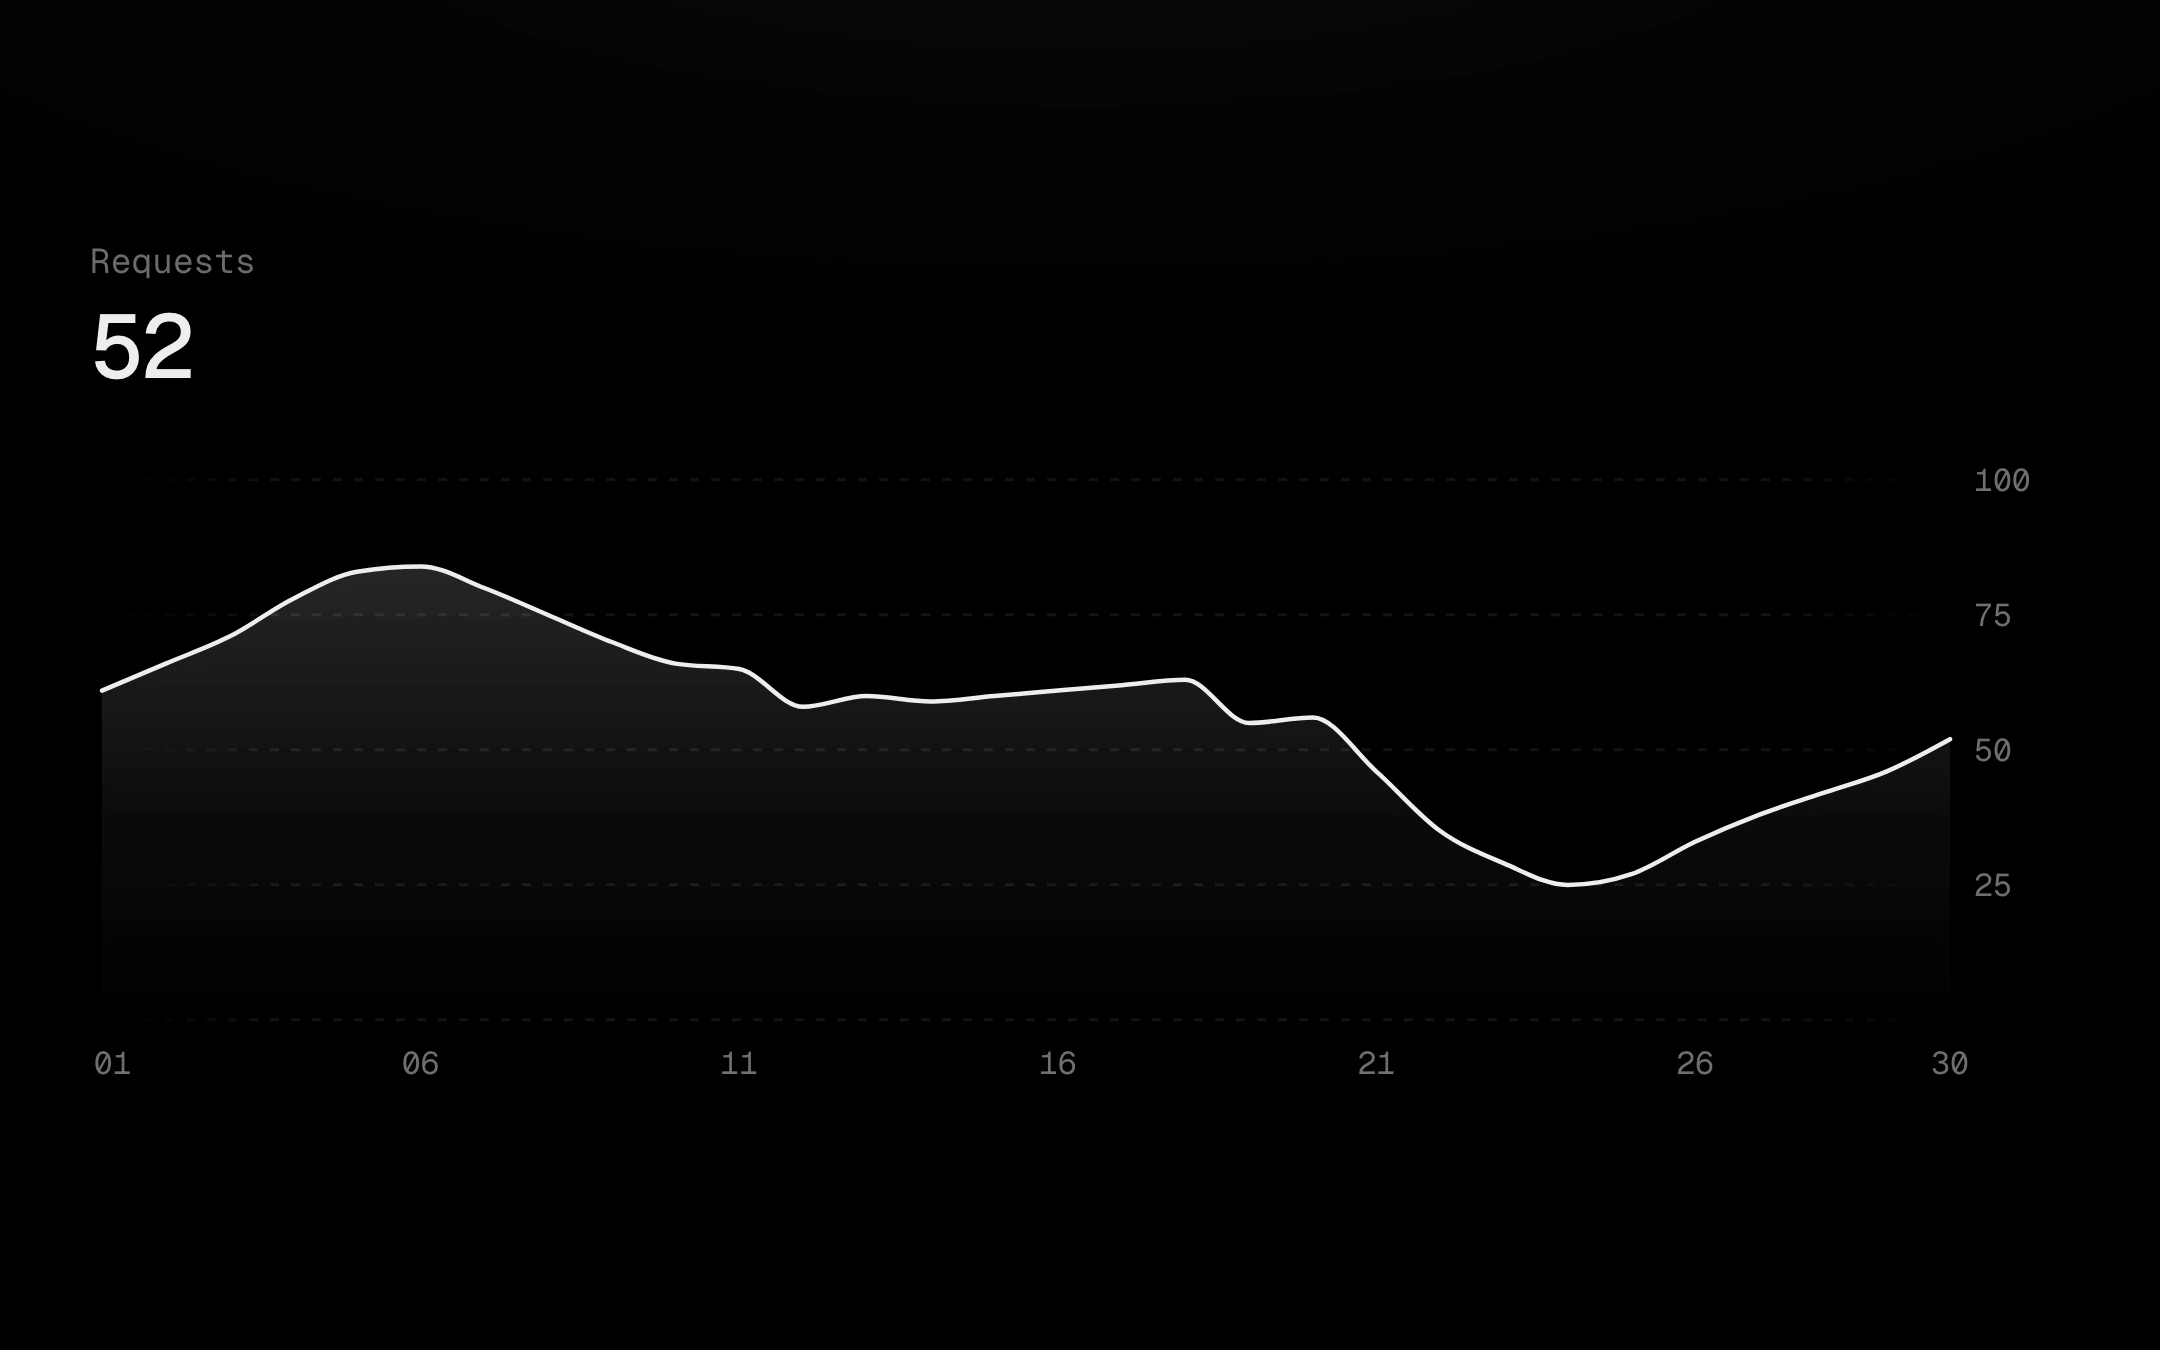
A smooth line over a surface that fades to nothing beneath it.
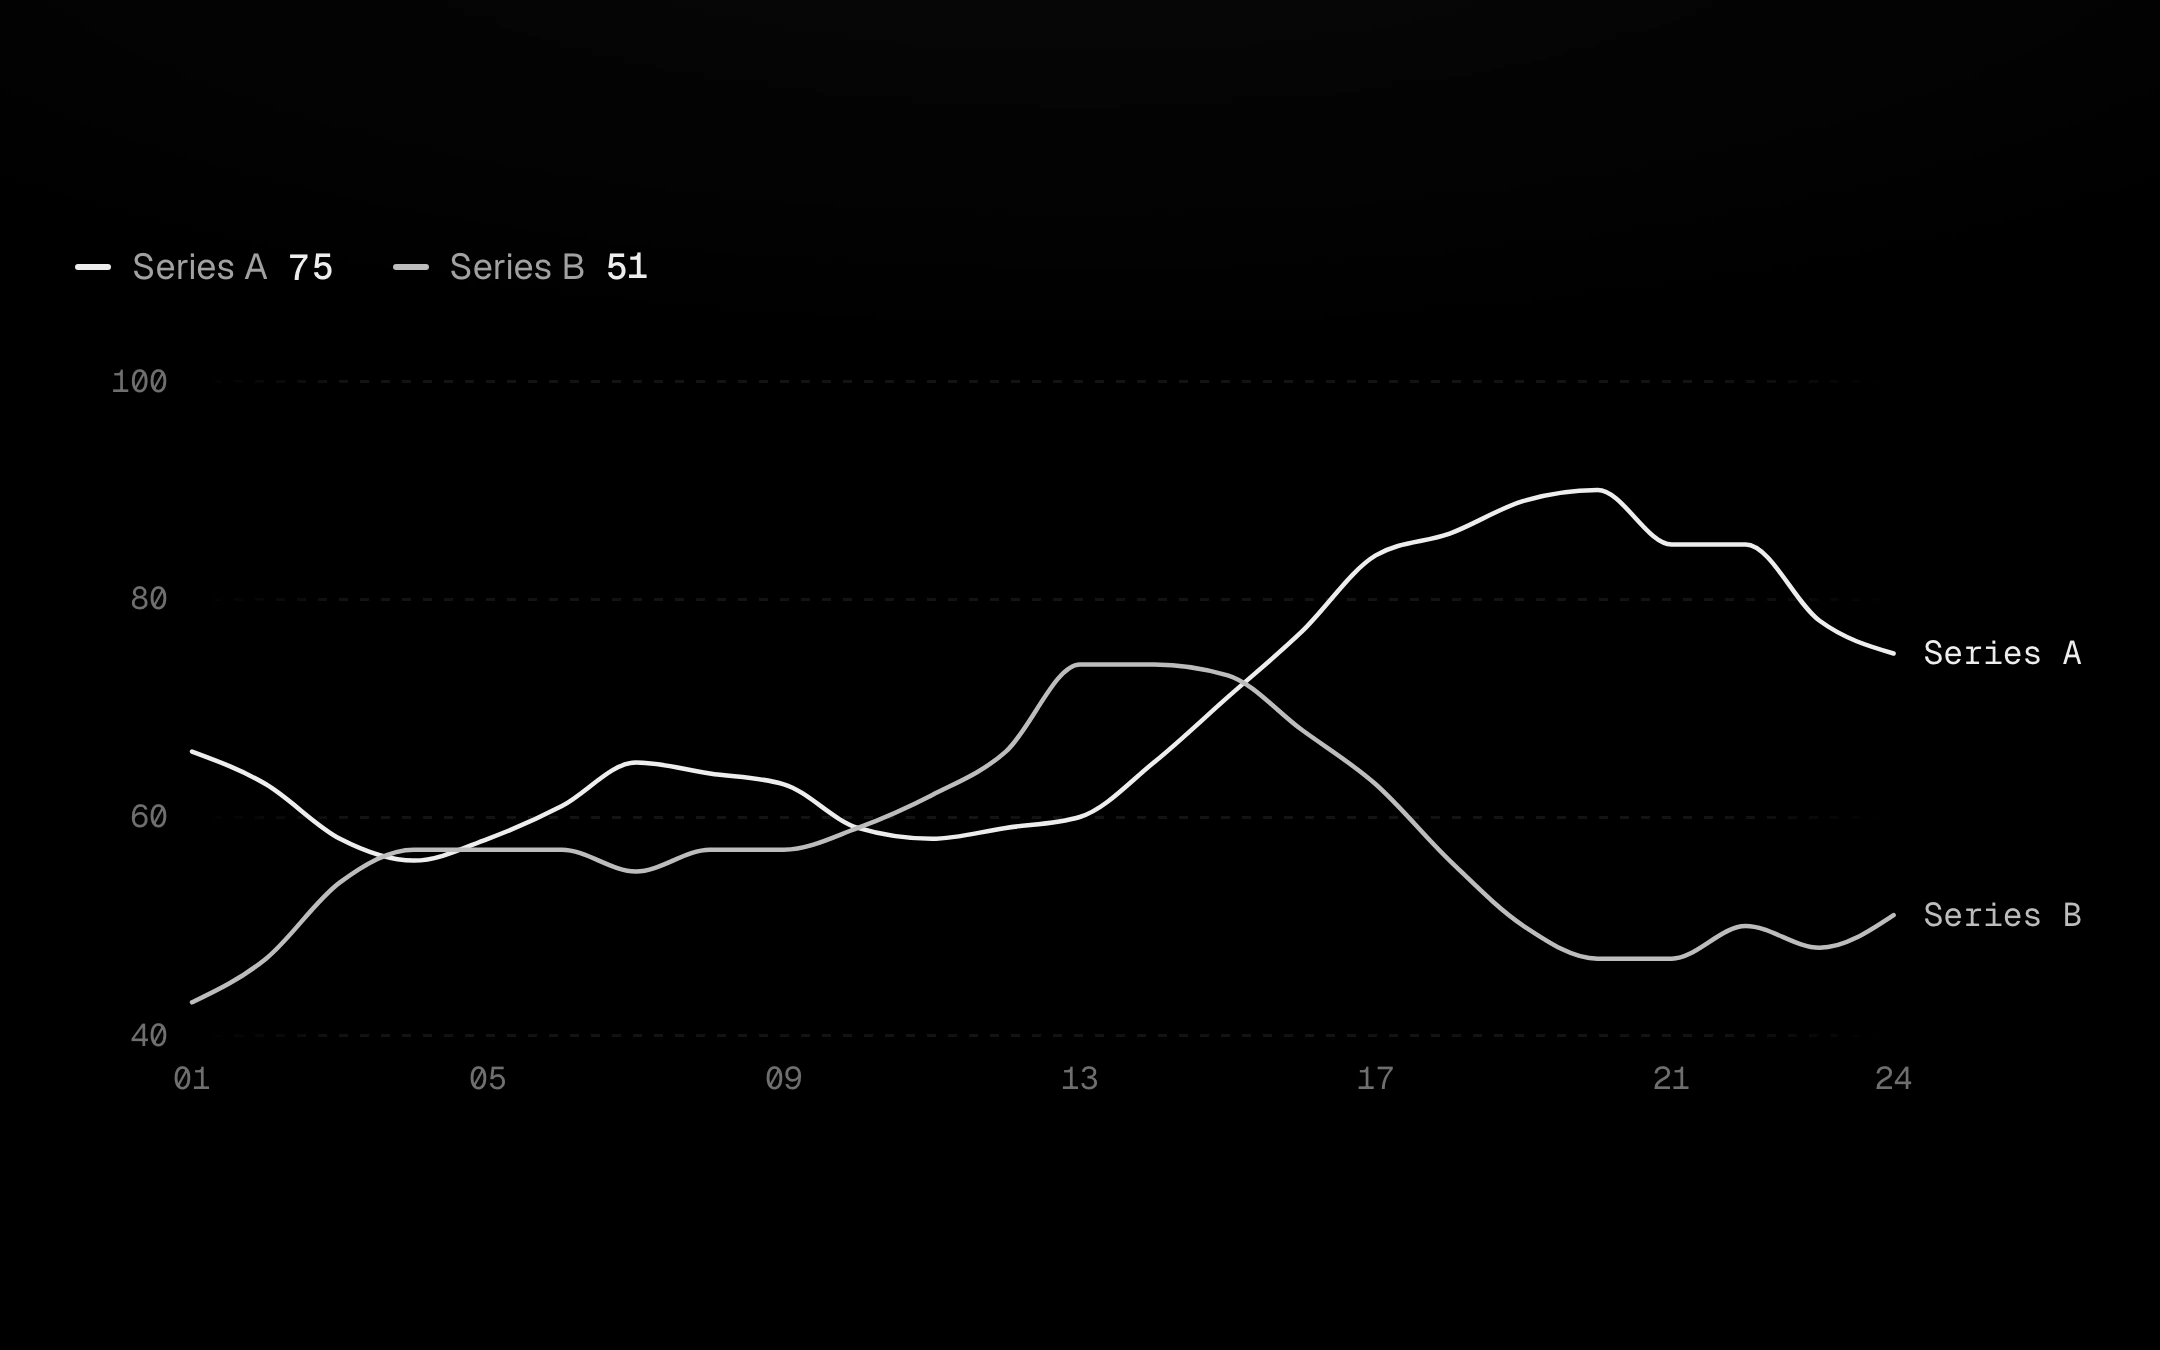
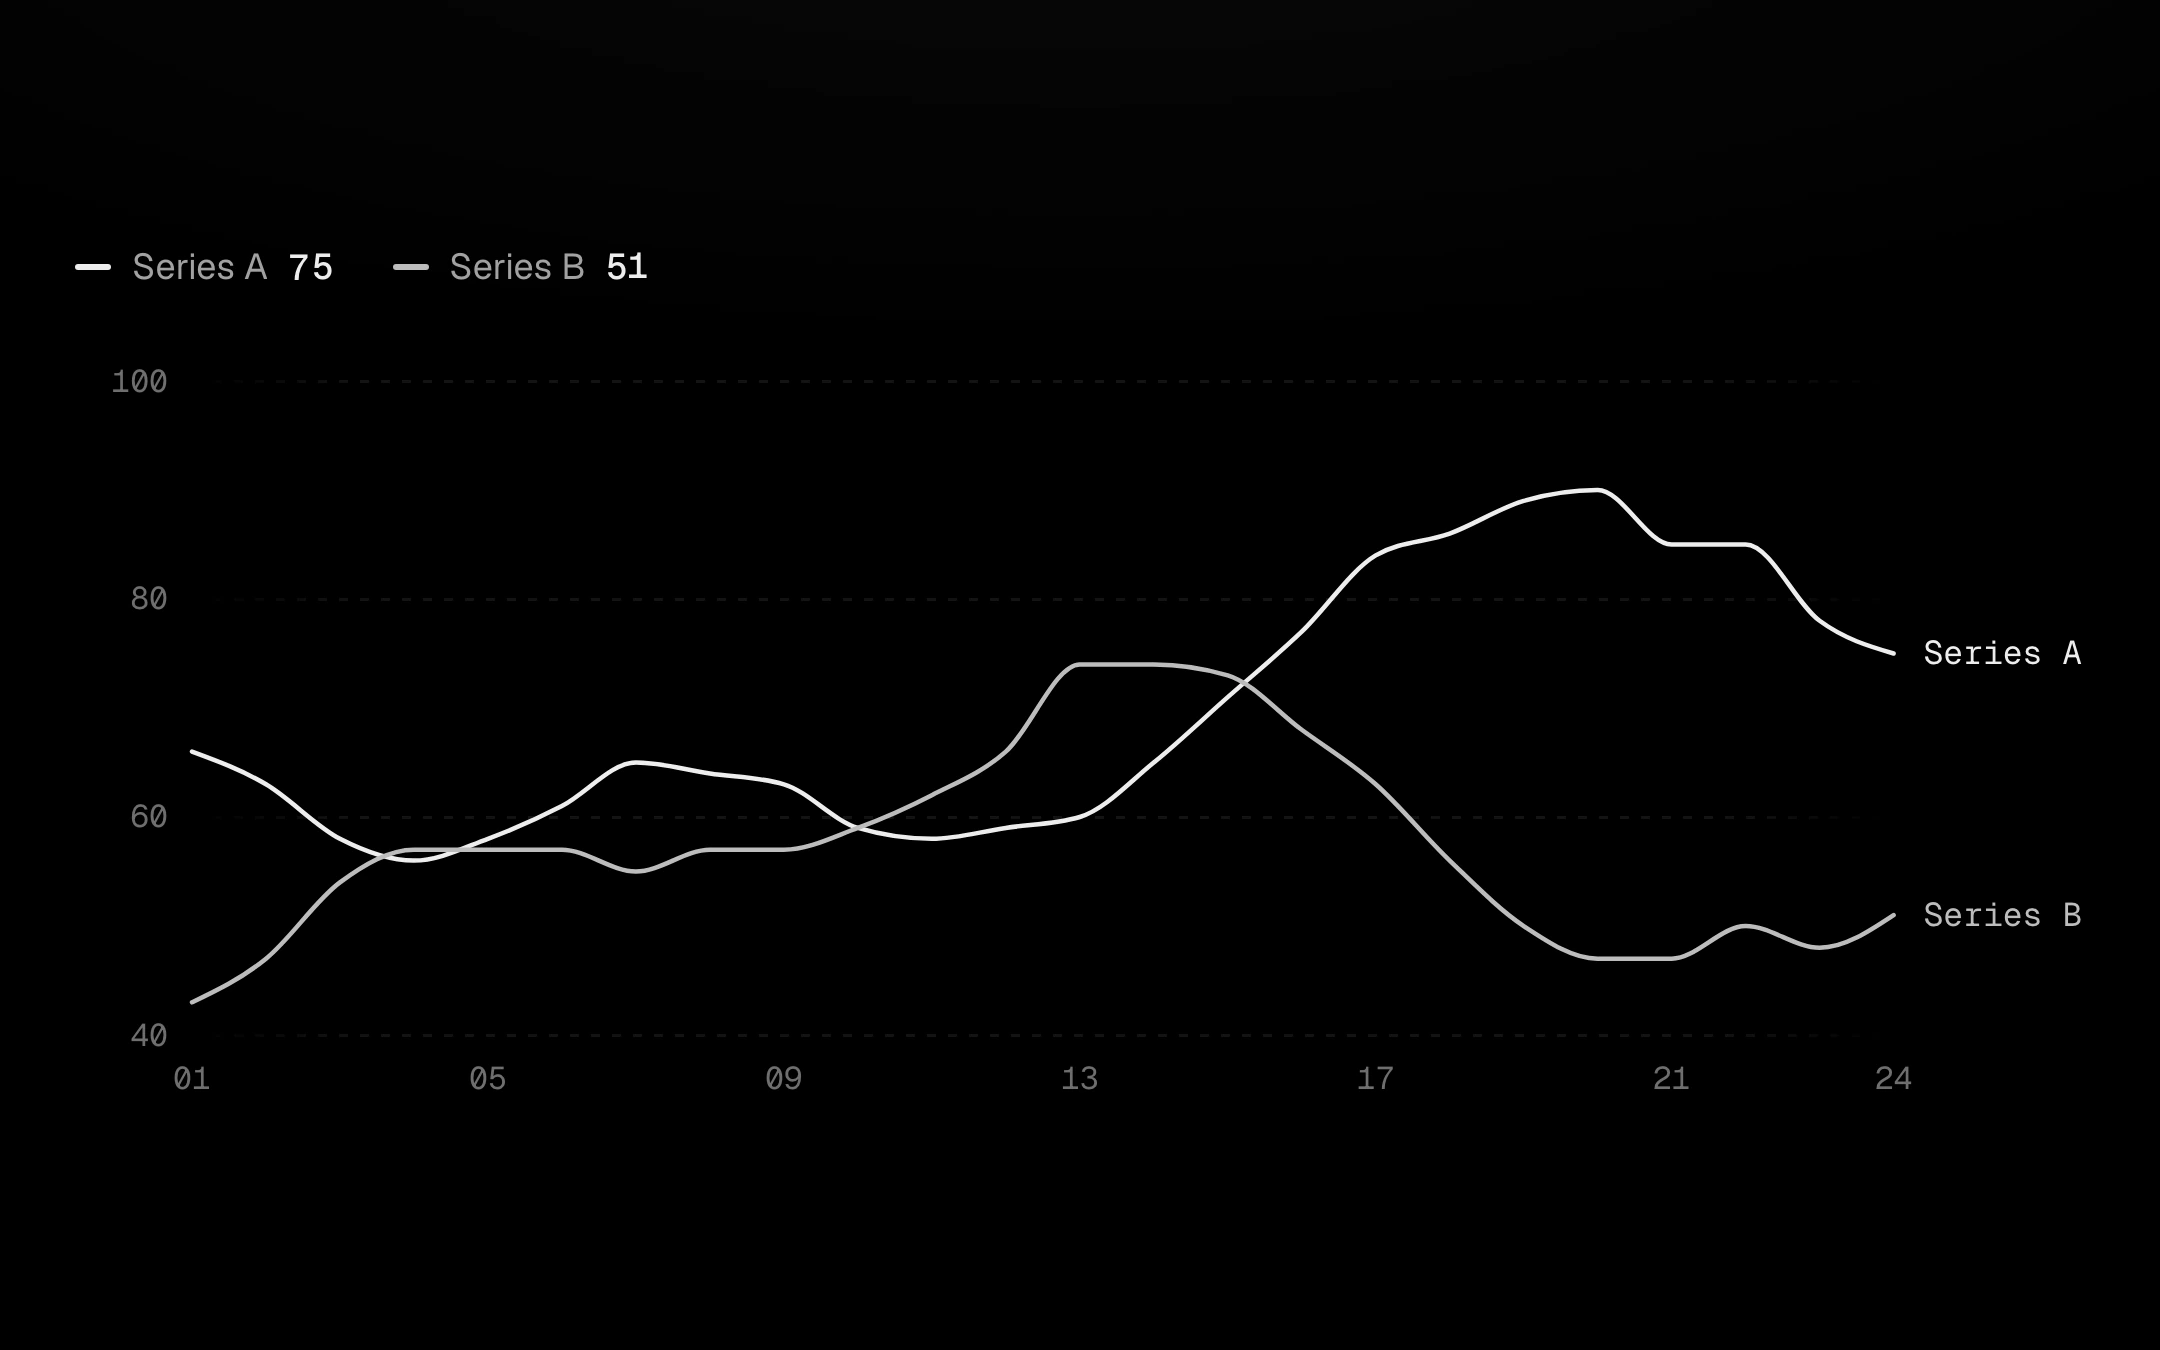
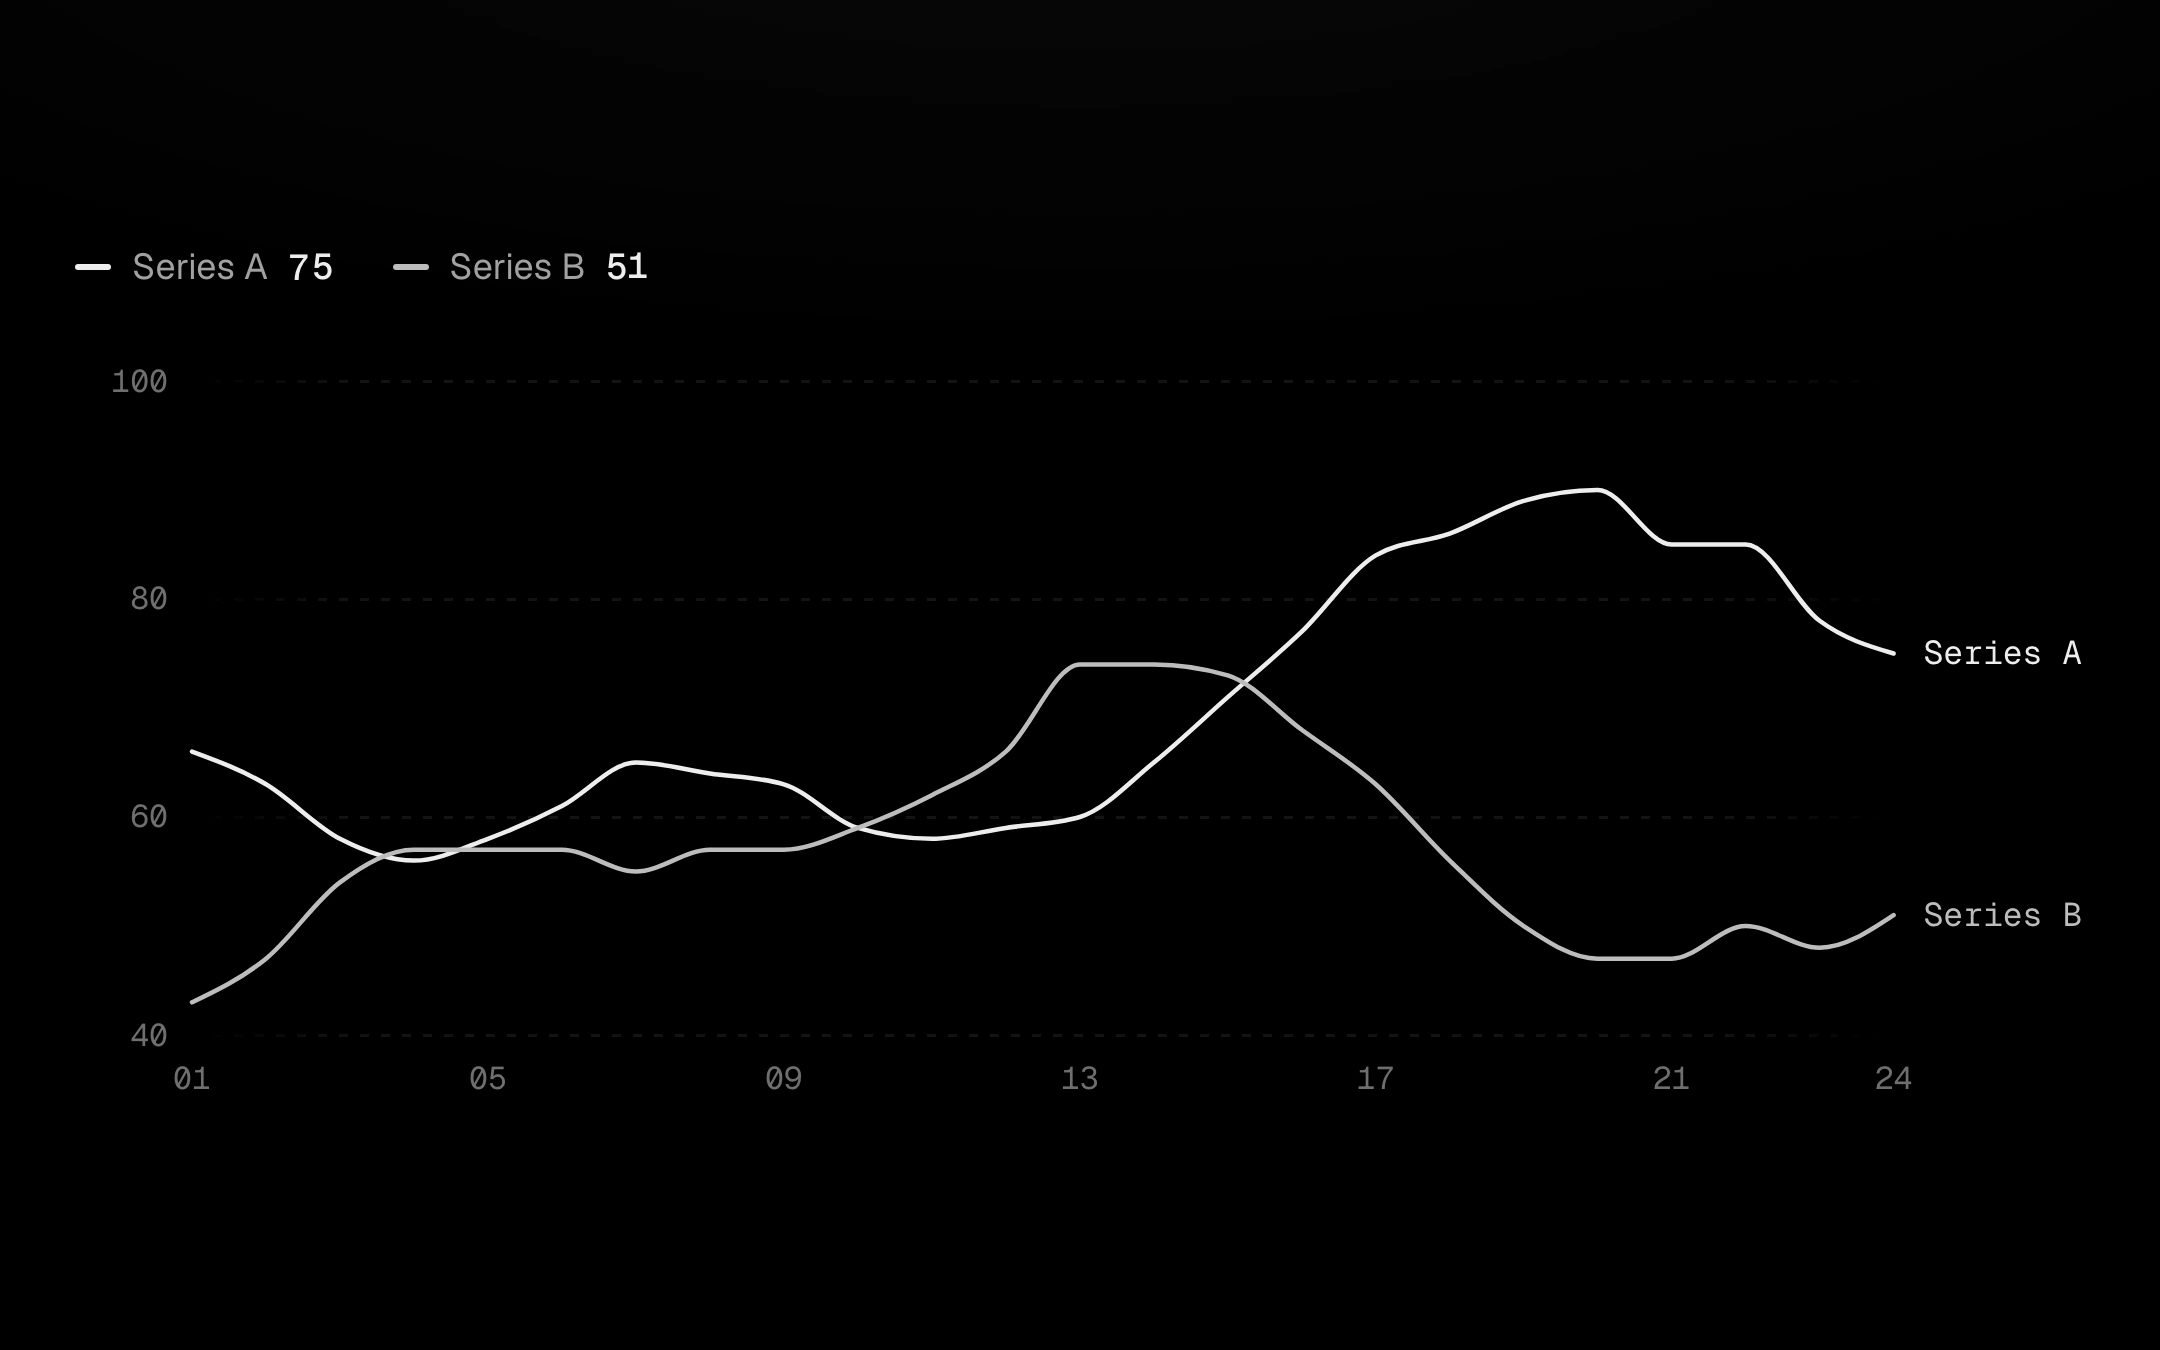
Up to six series drawn in greys of different strength, never a rainbow.
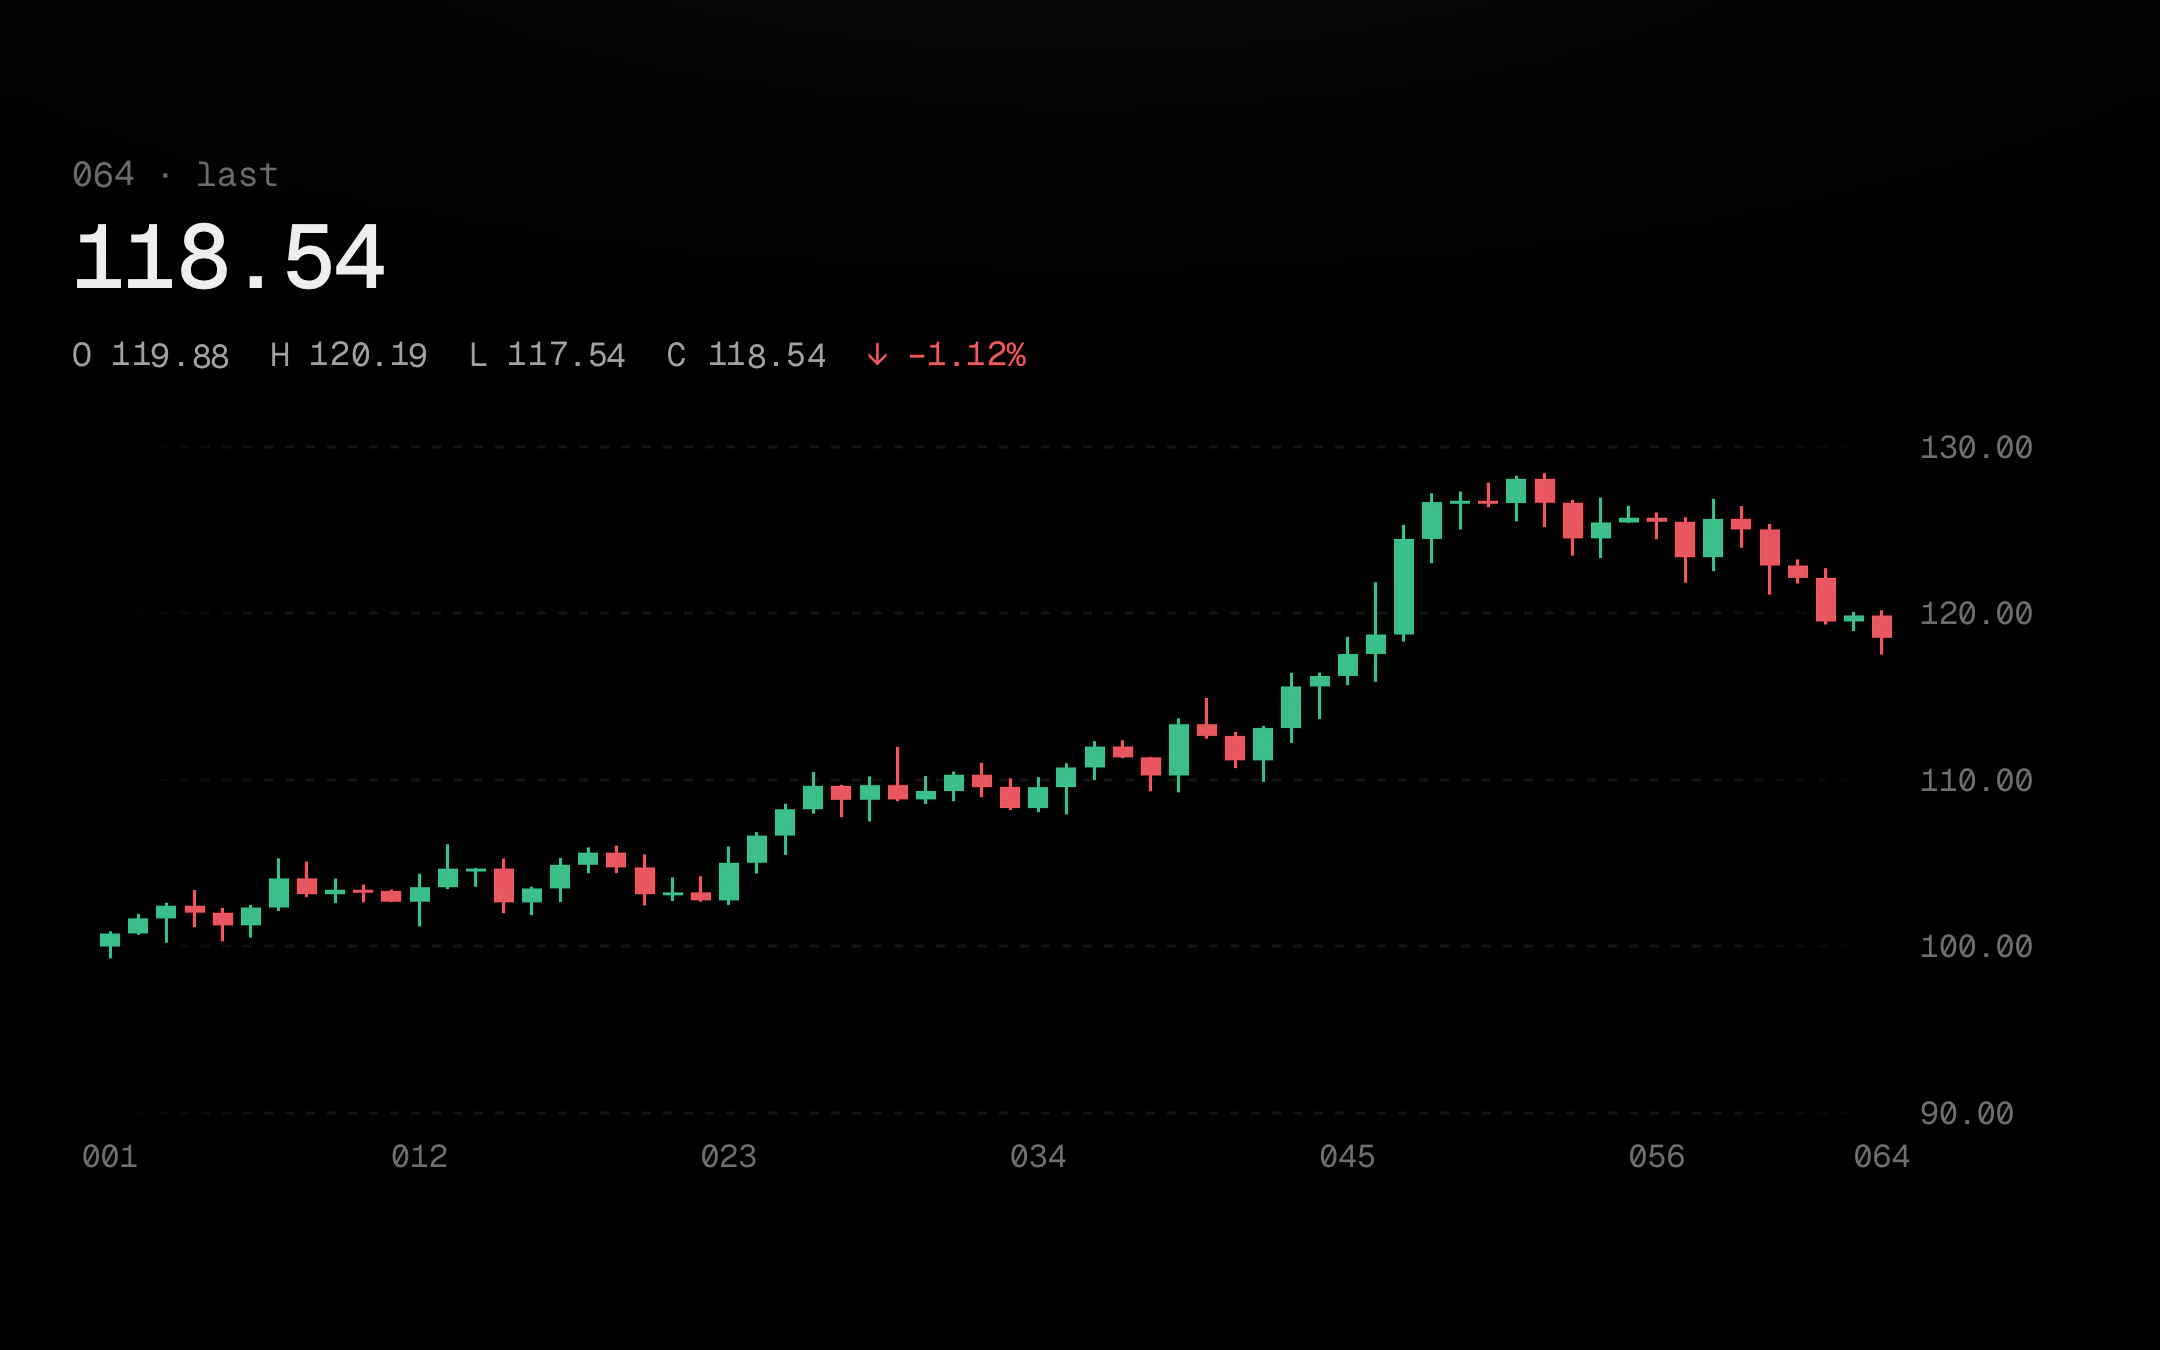
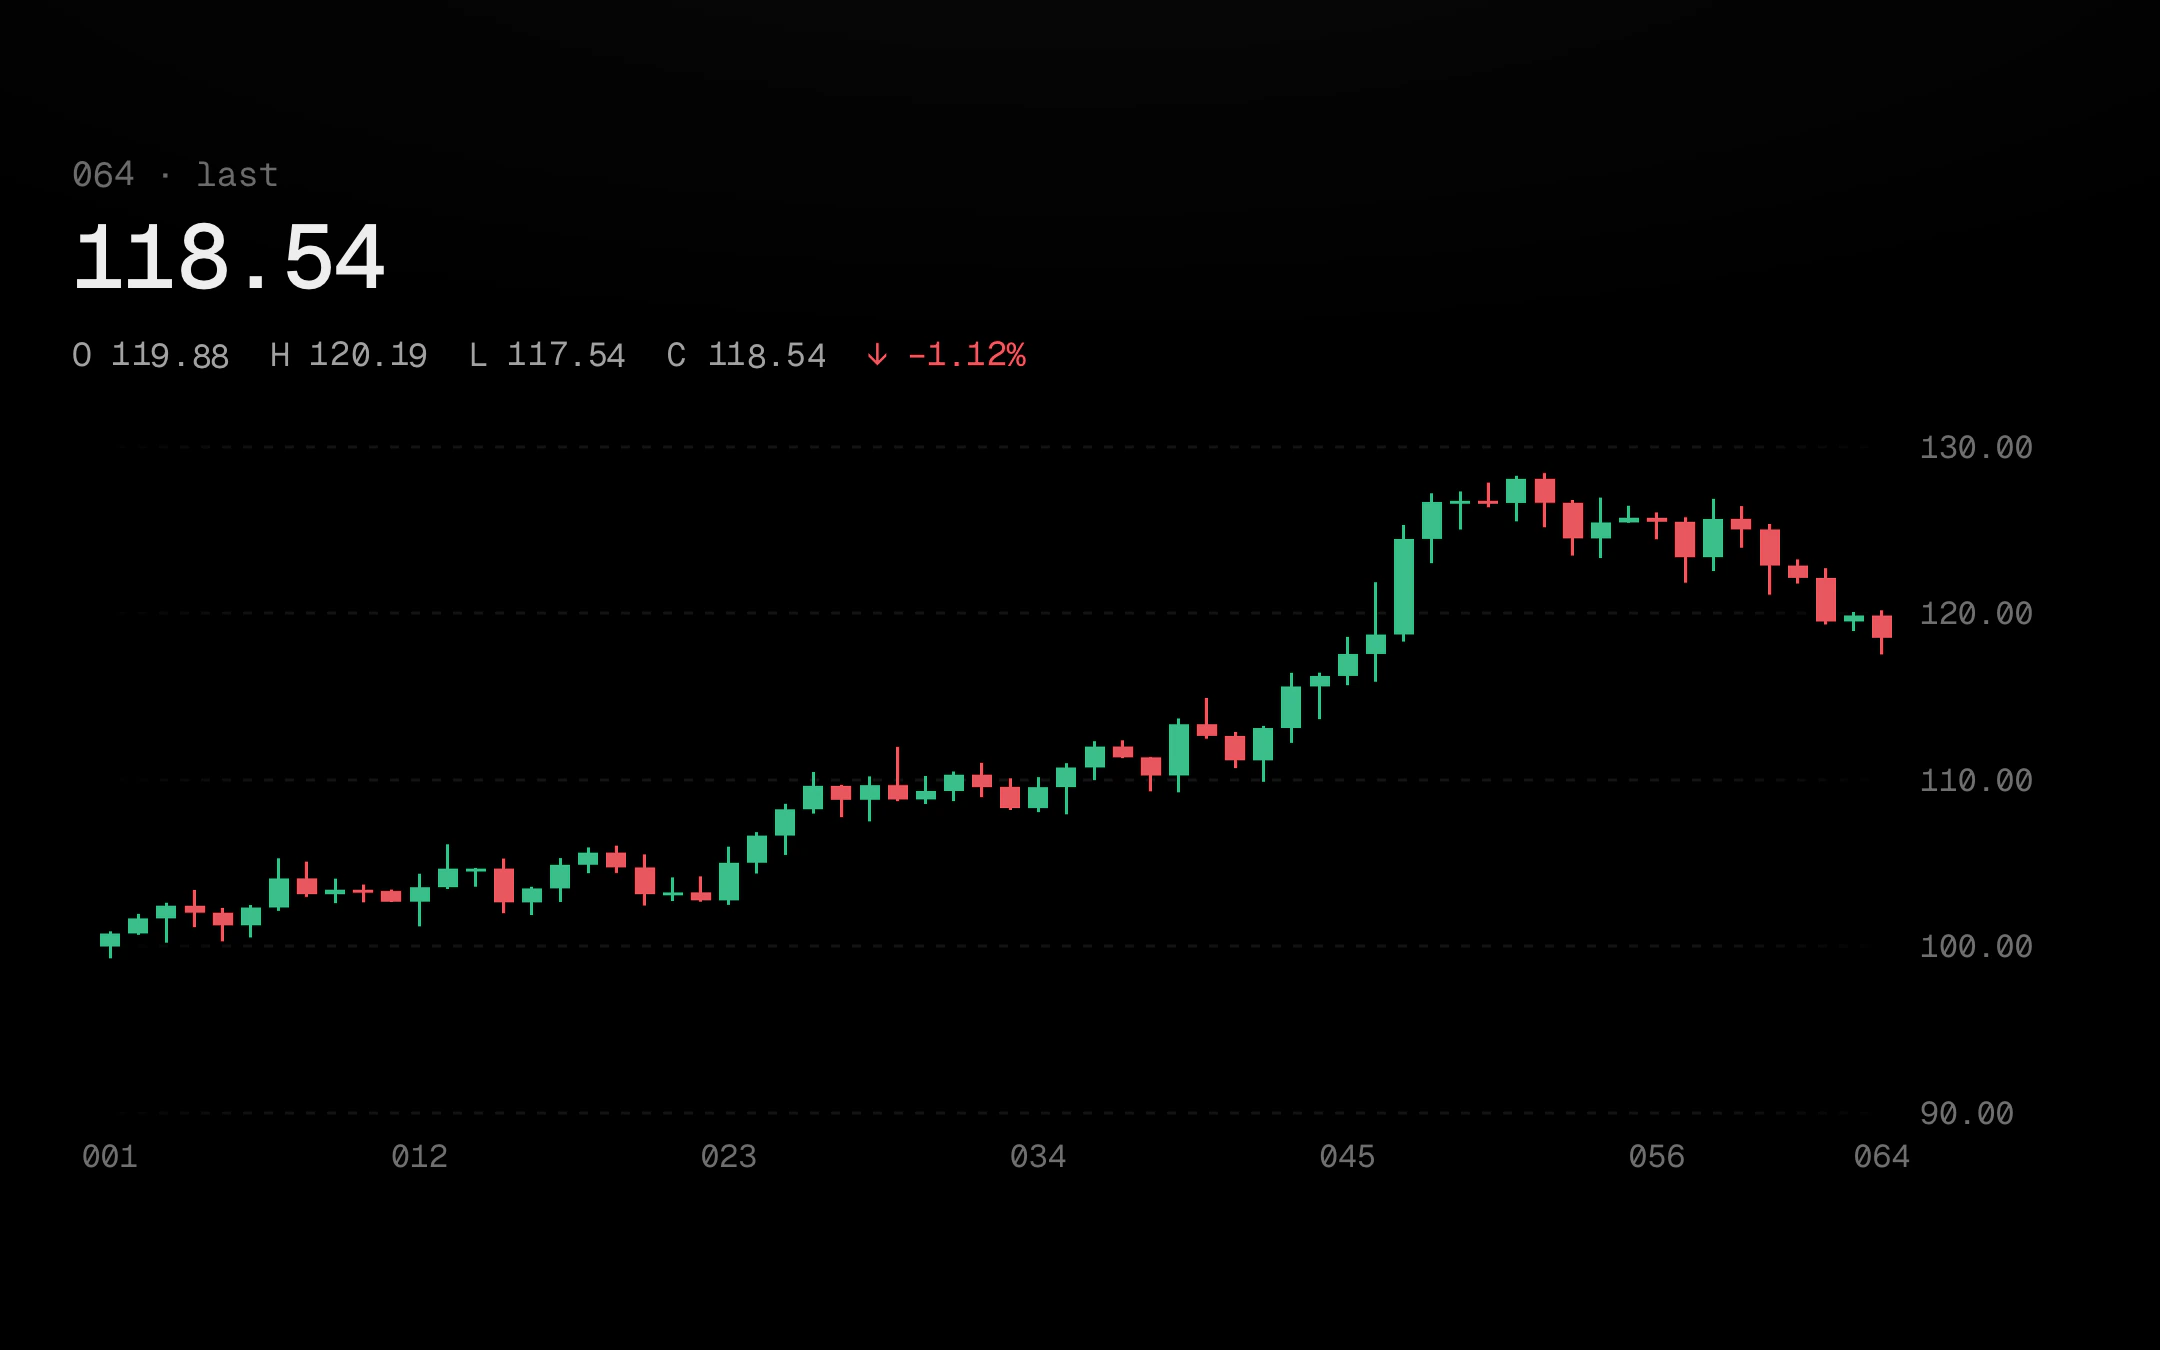
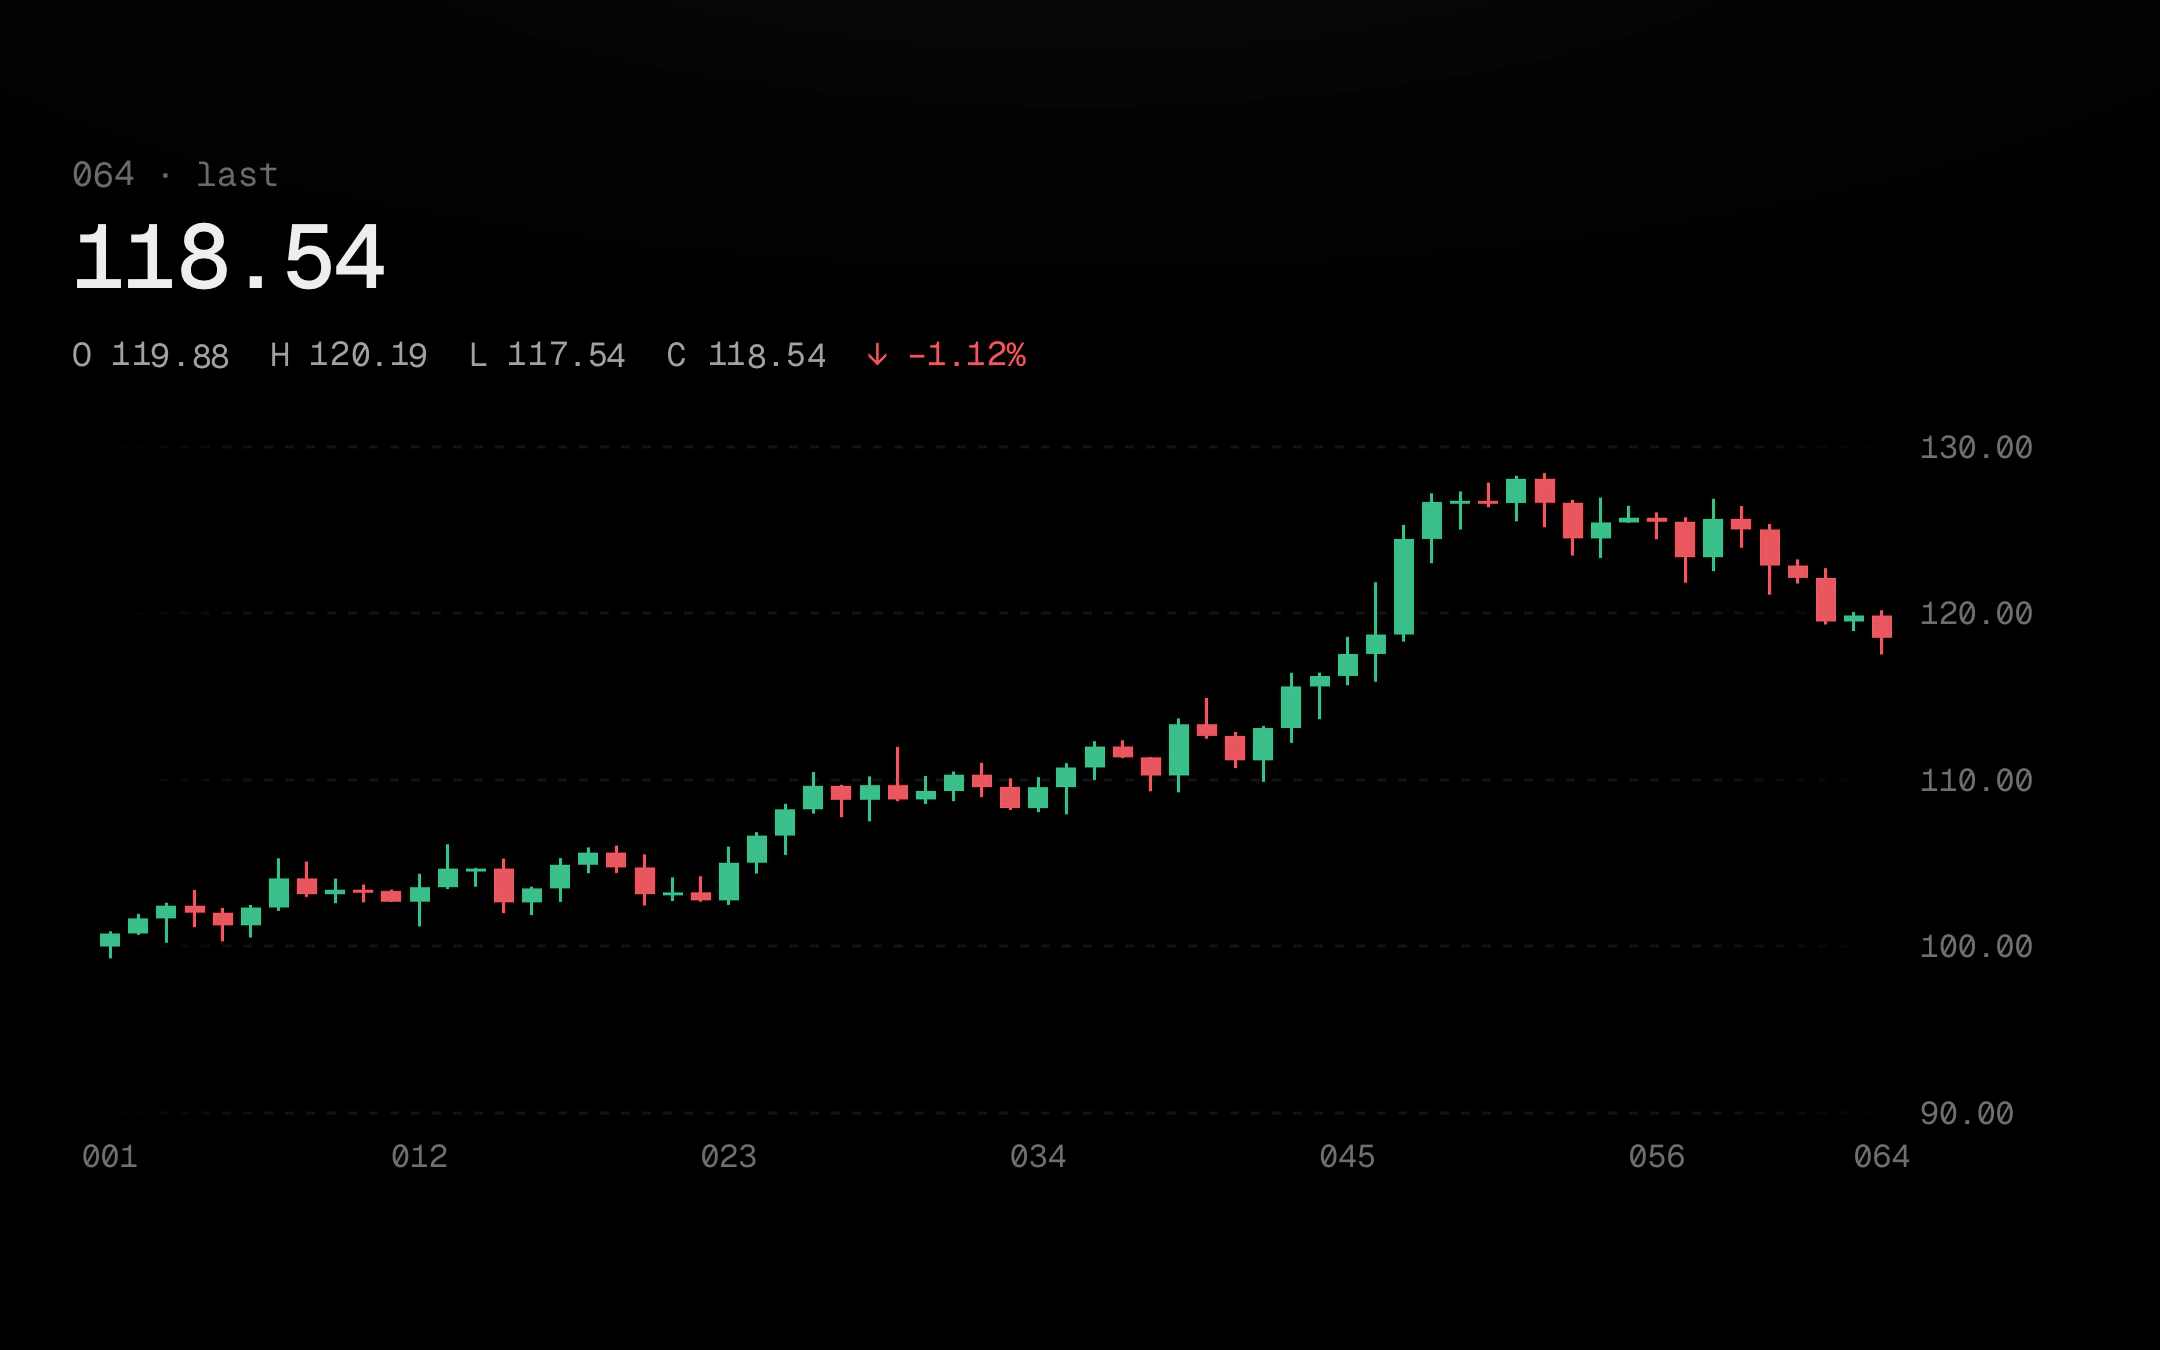
Open, high, low and close per period: rising candles green, falling ones red, or a monochrome tape (hollow bone rising, solid grey falling) where the candle under your pointer heats in the accent.
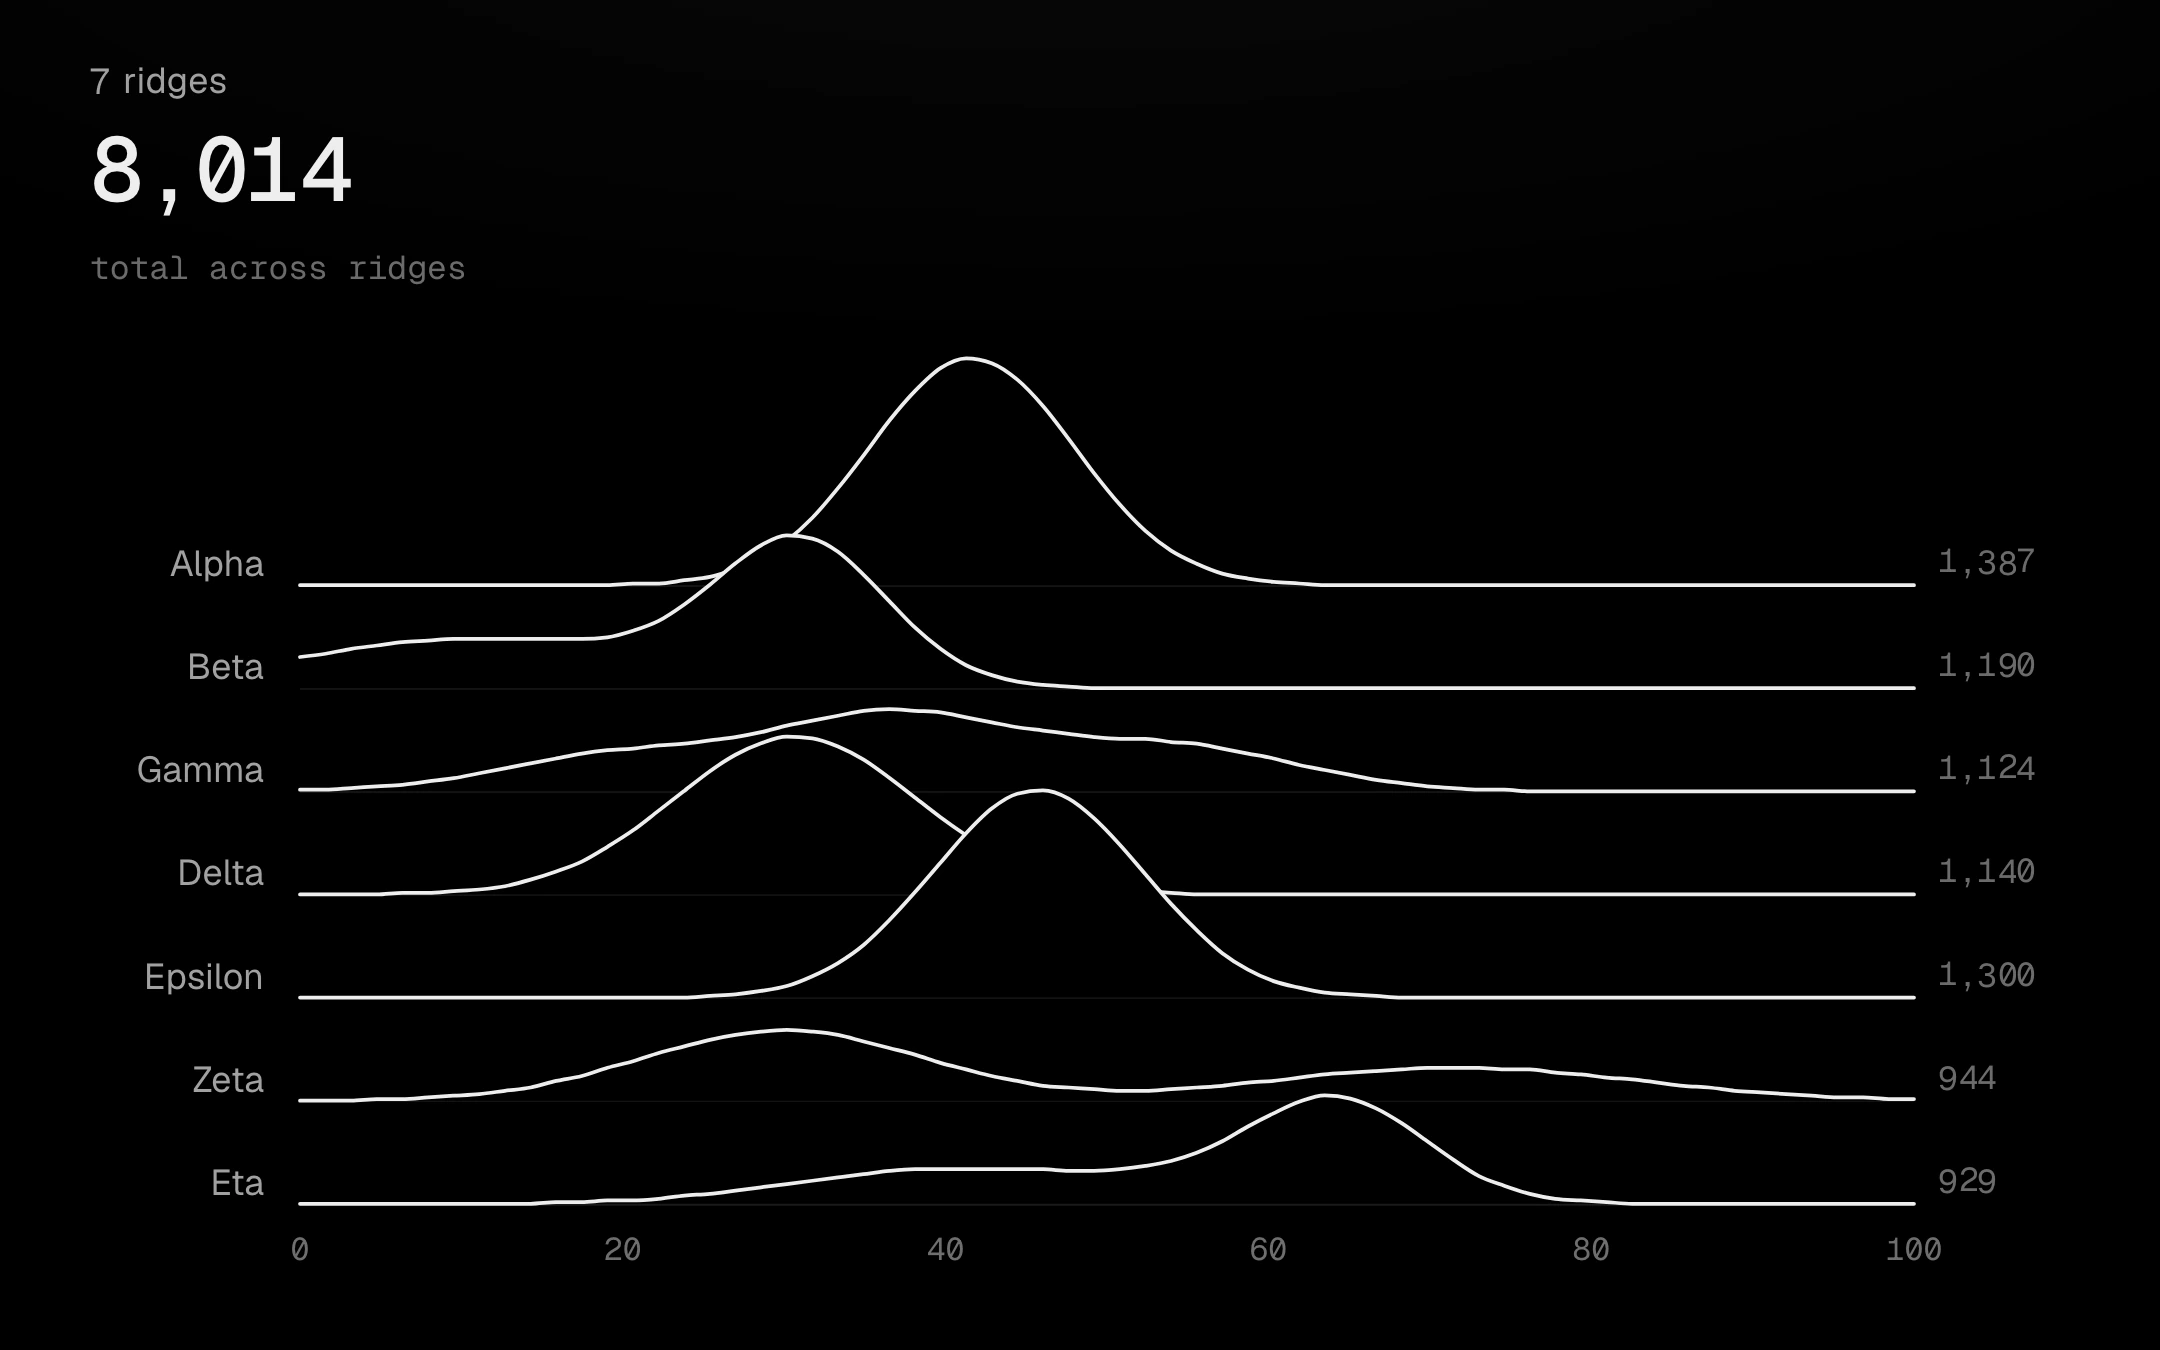
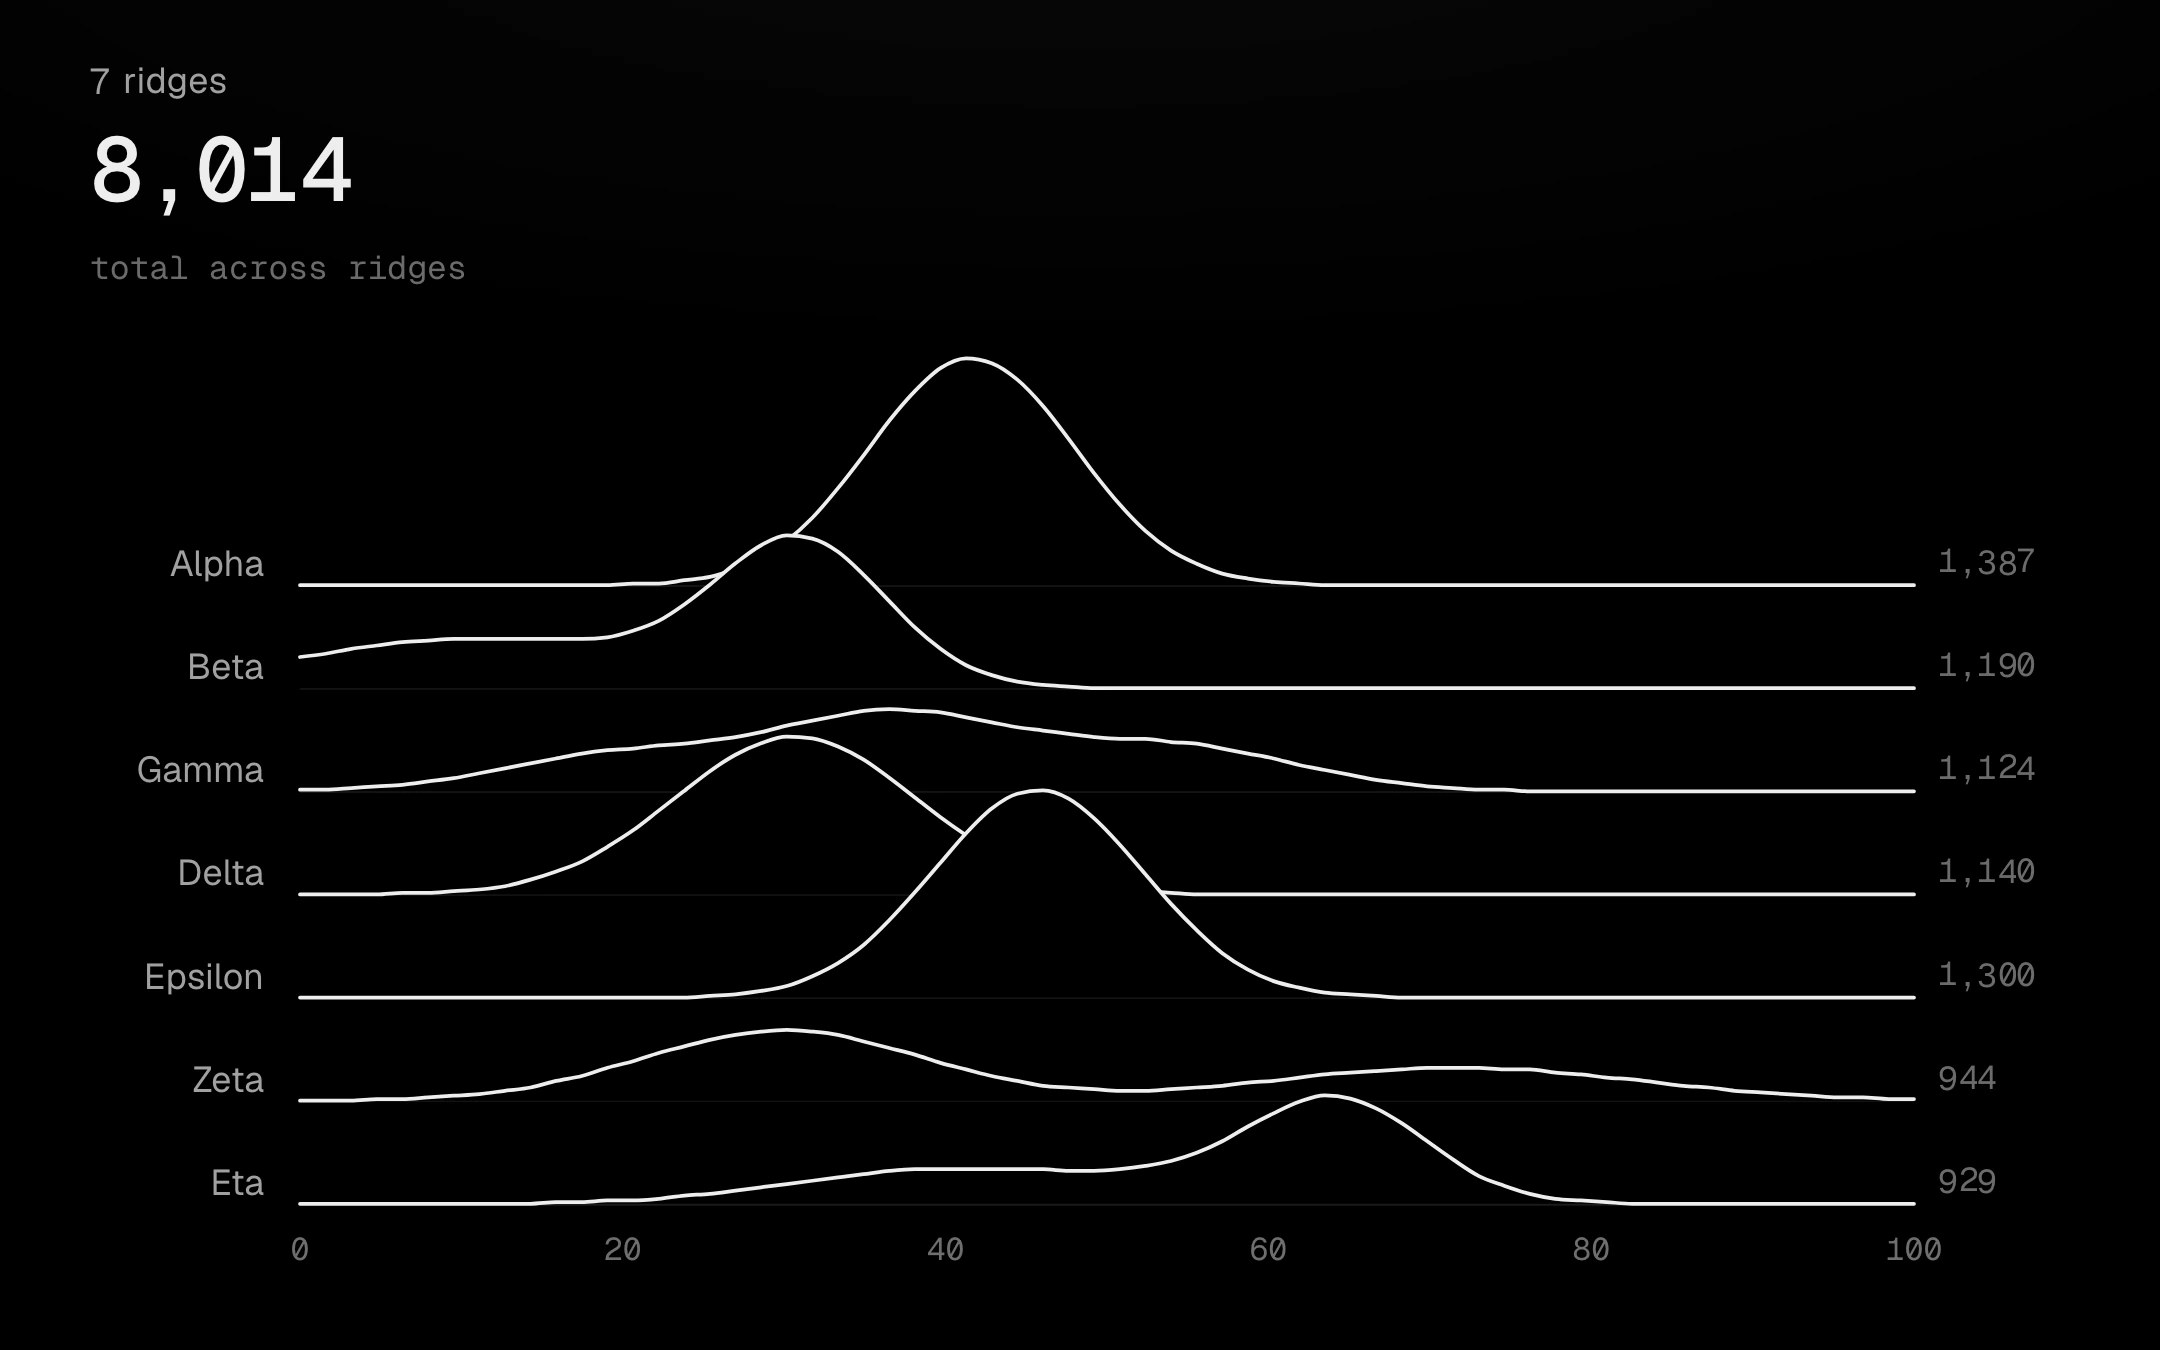
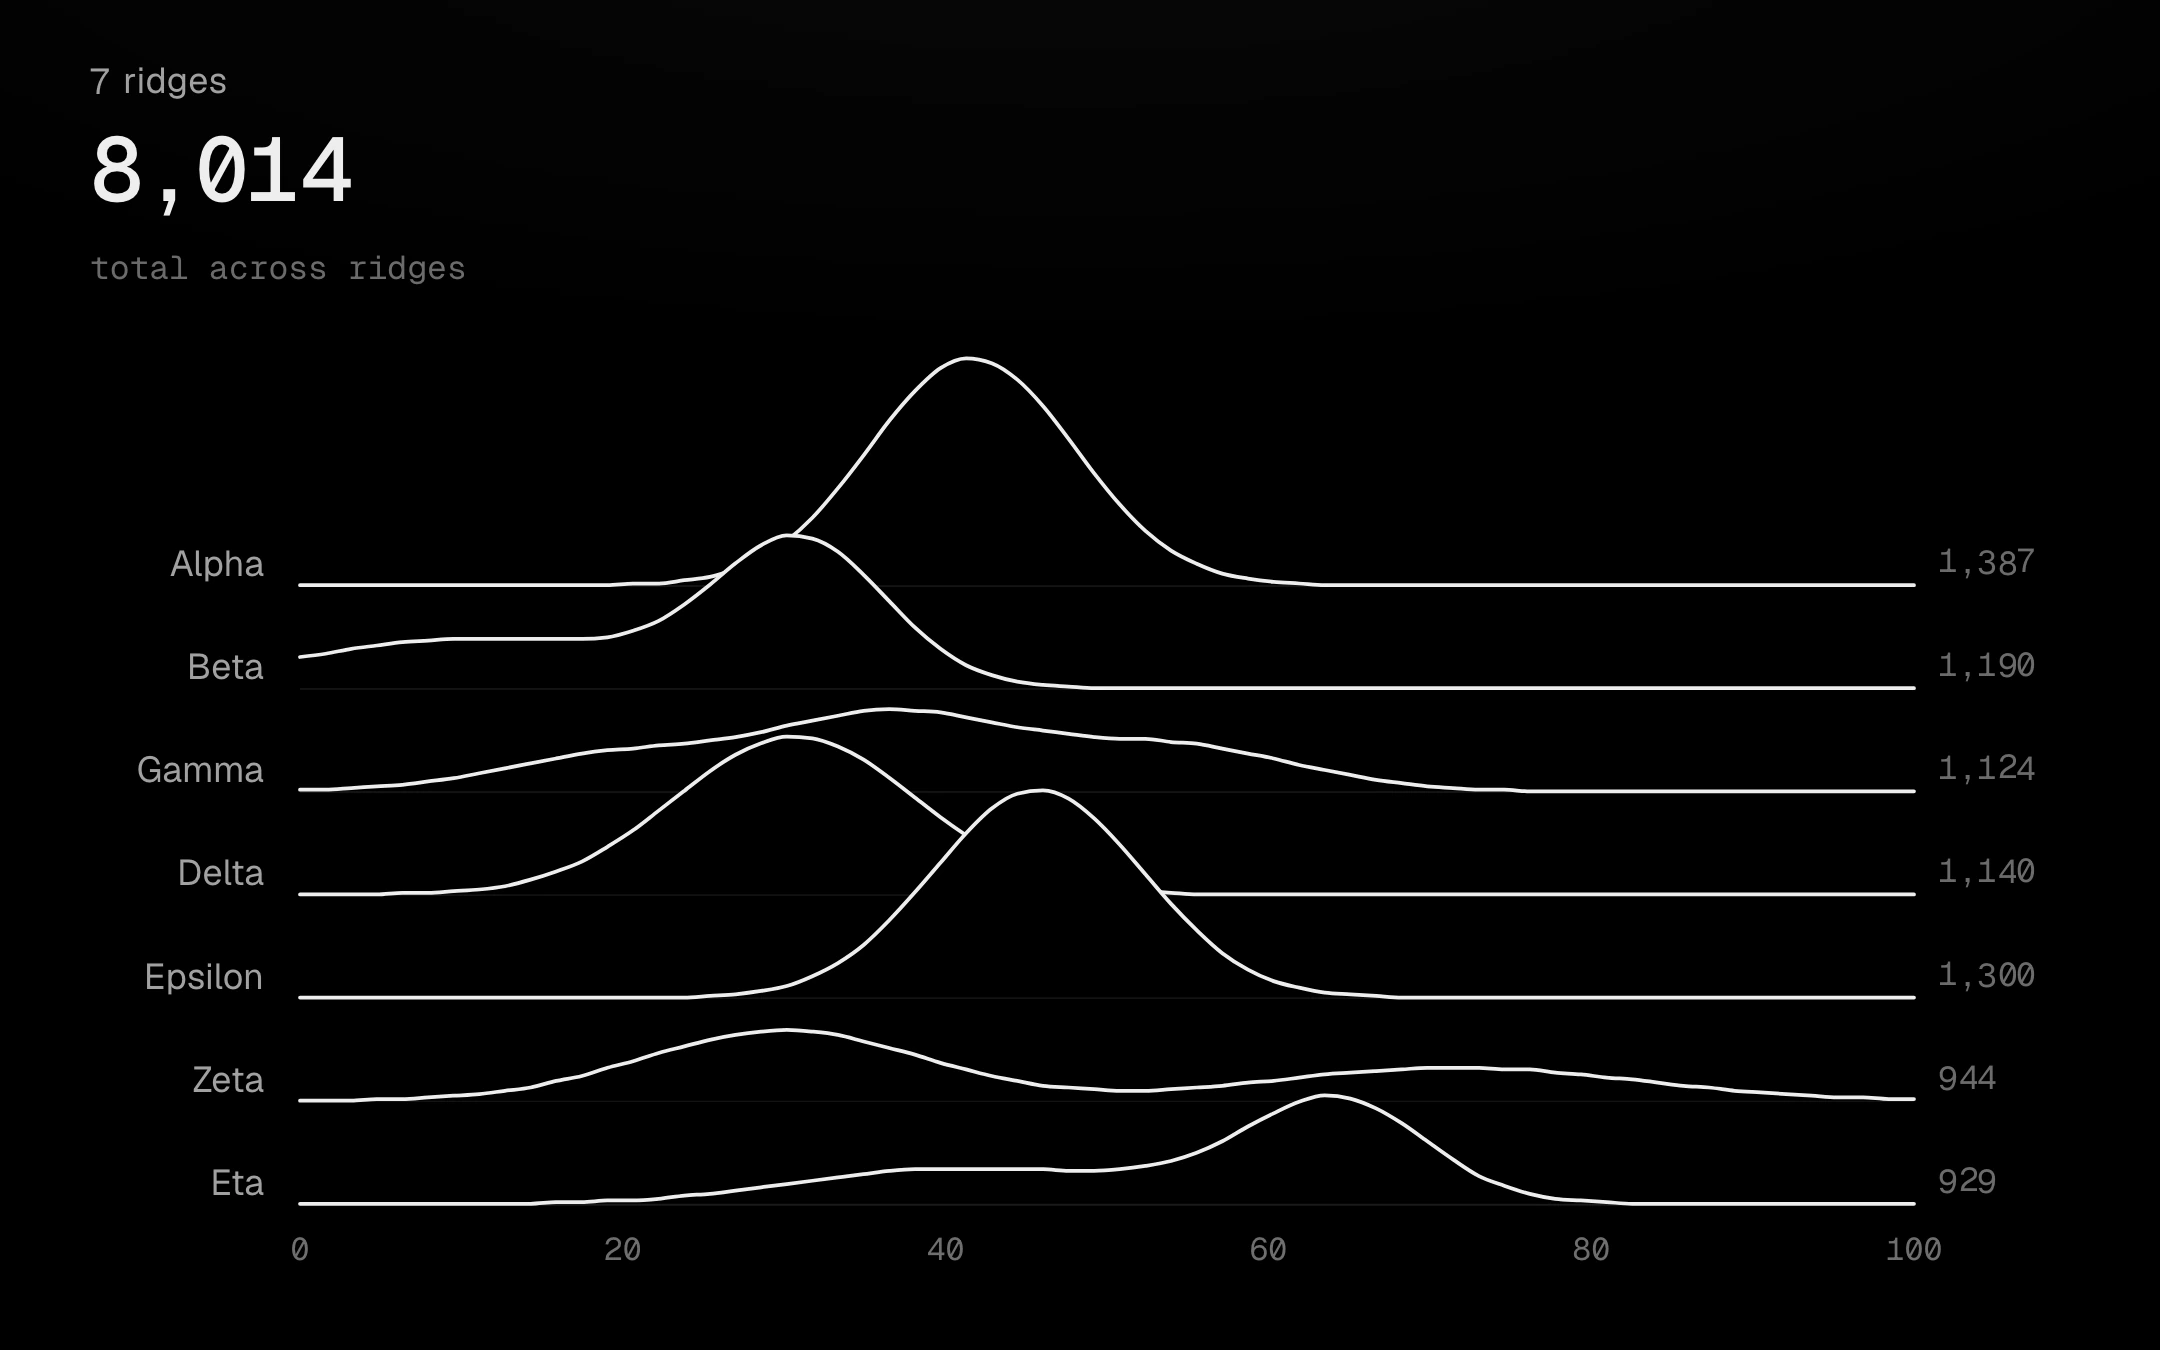
Density curves stacked like a range of hills: each ridge is a stage-black fill with a bone top line, so nearer ridges hide the ones behind.
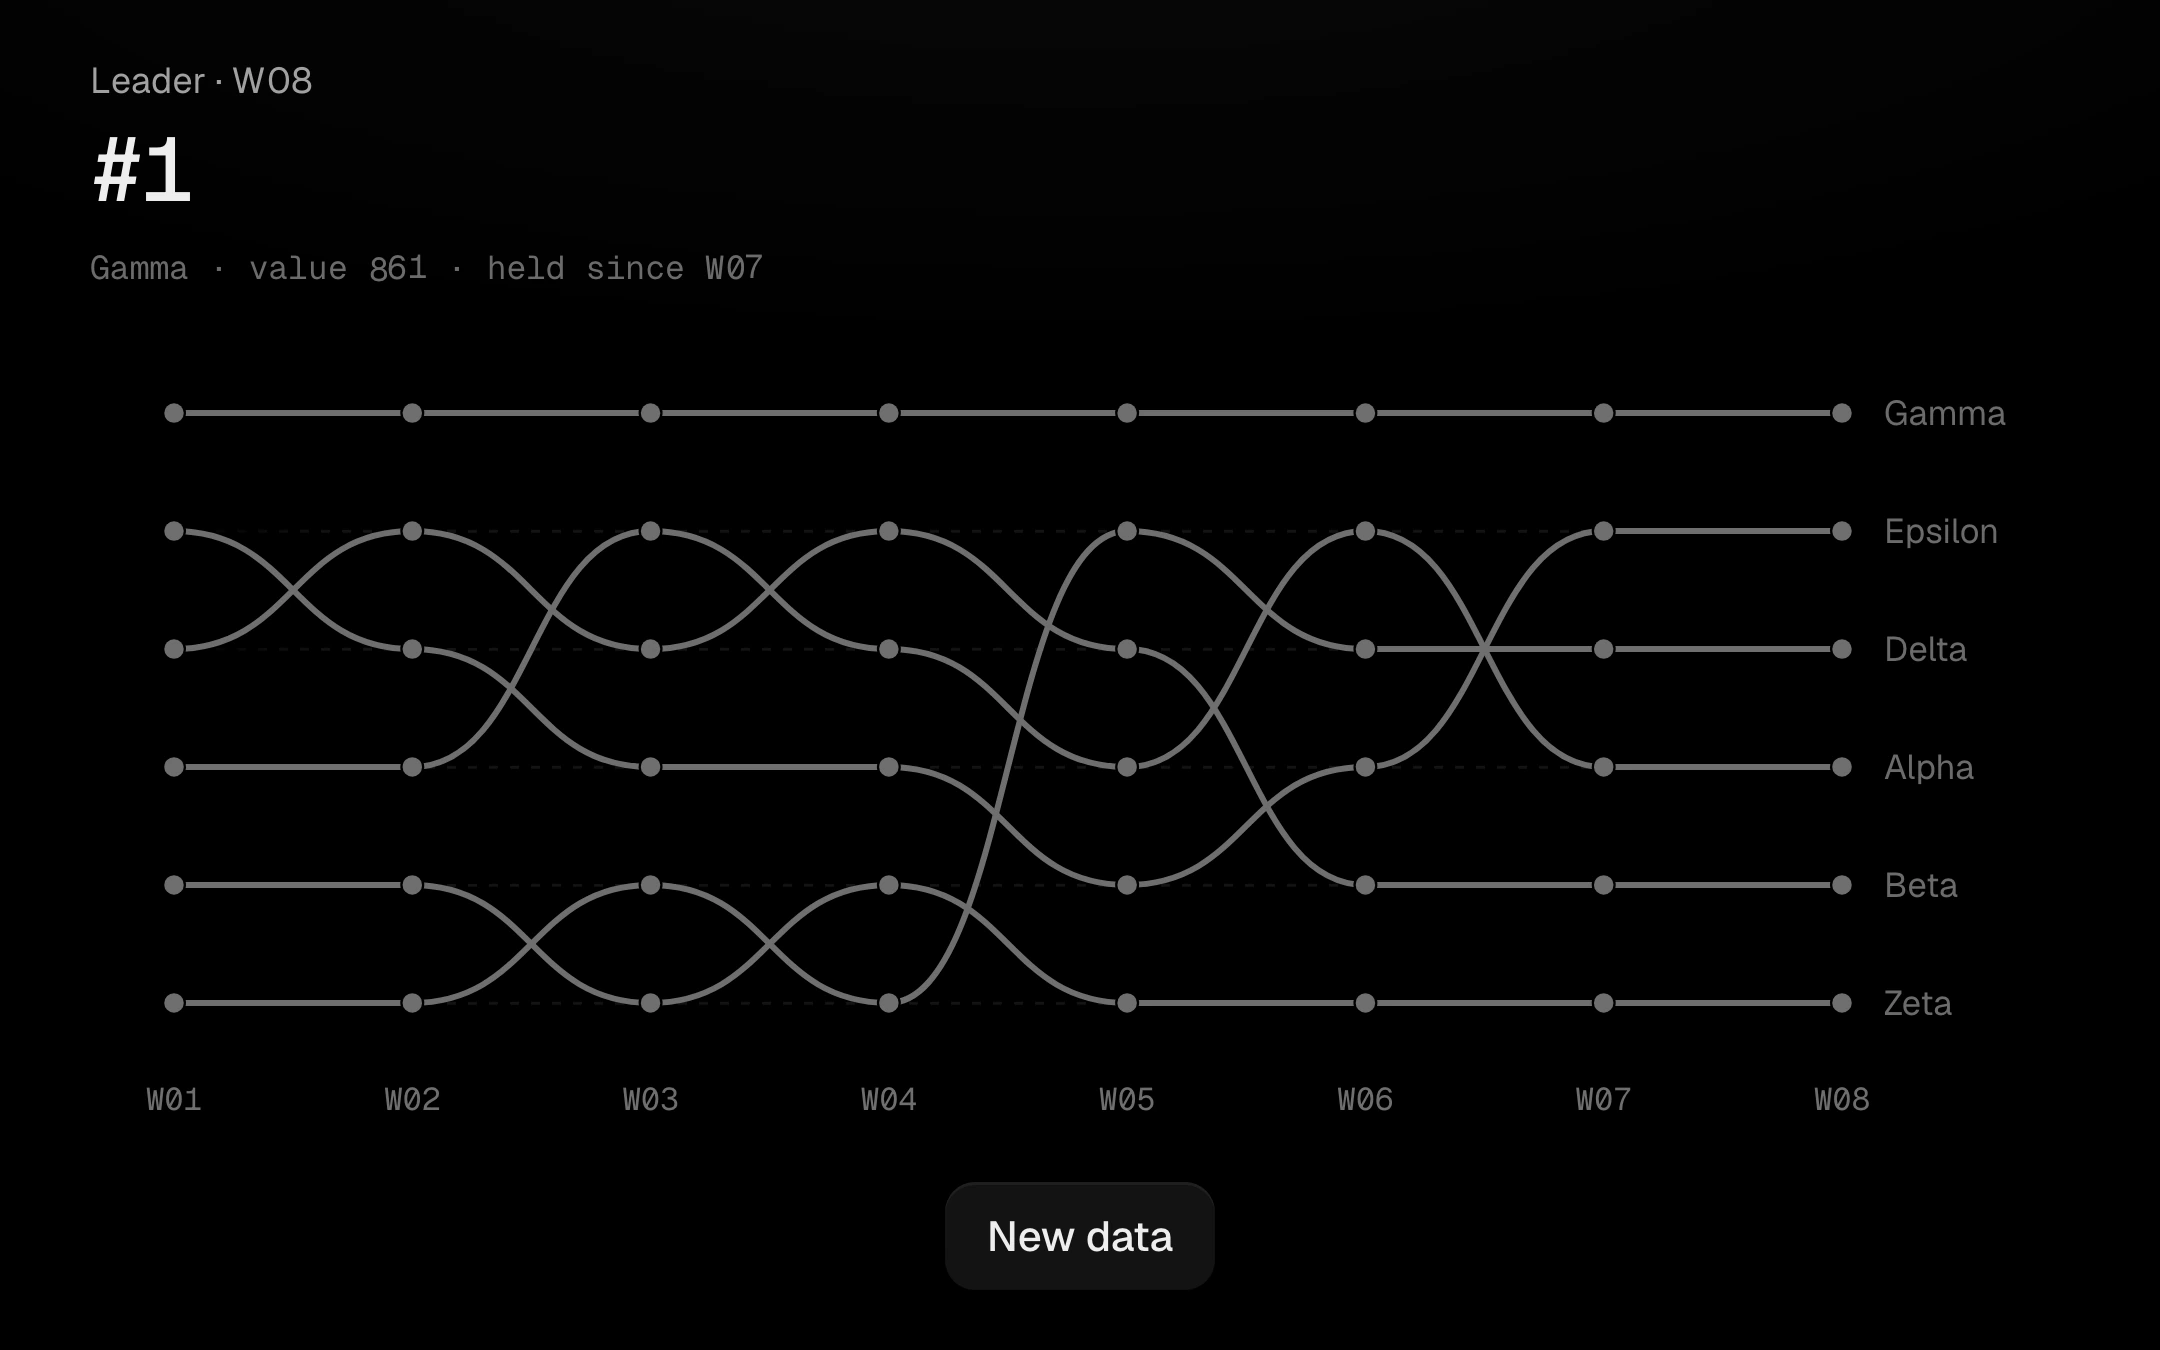
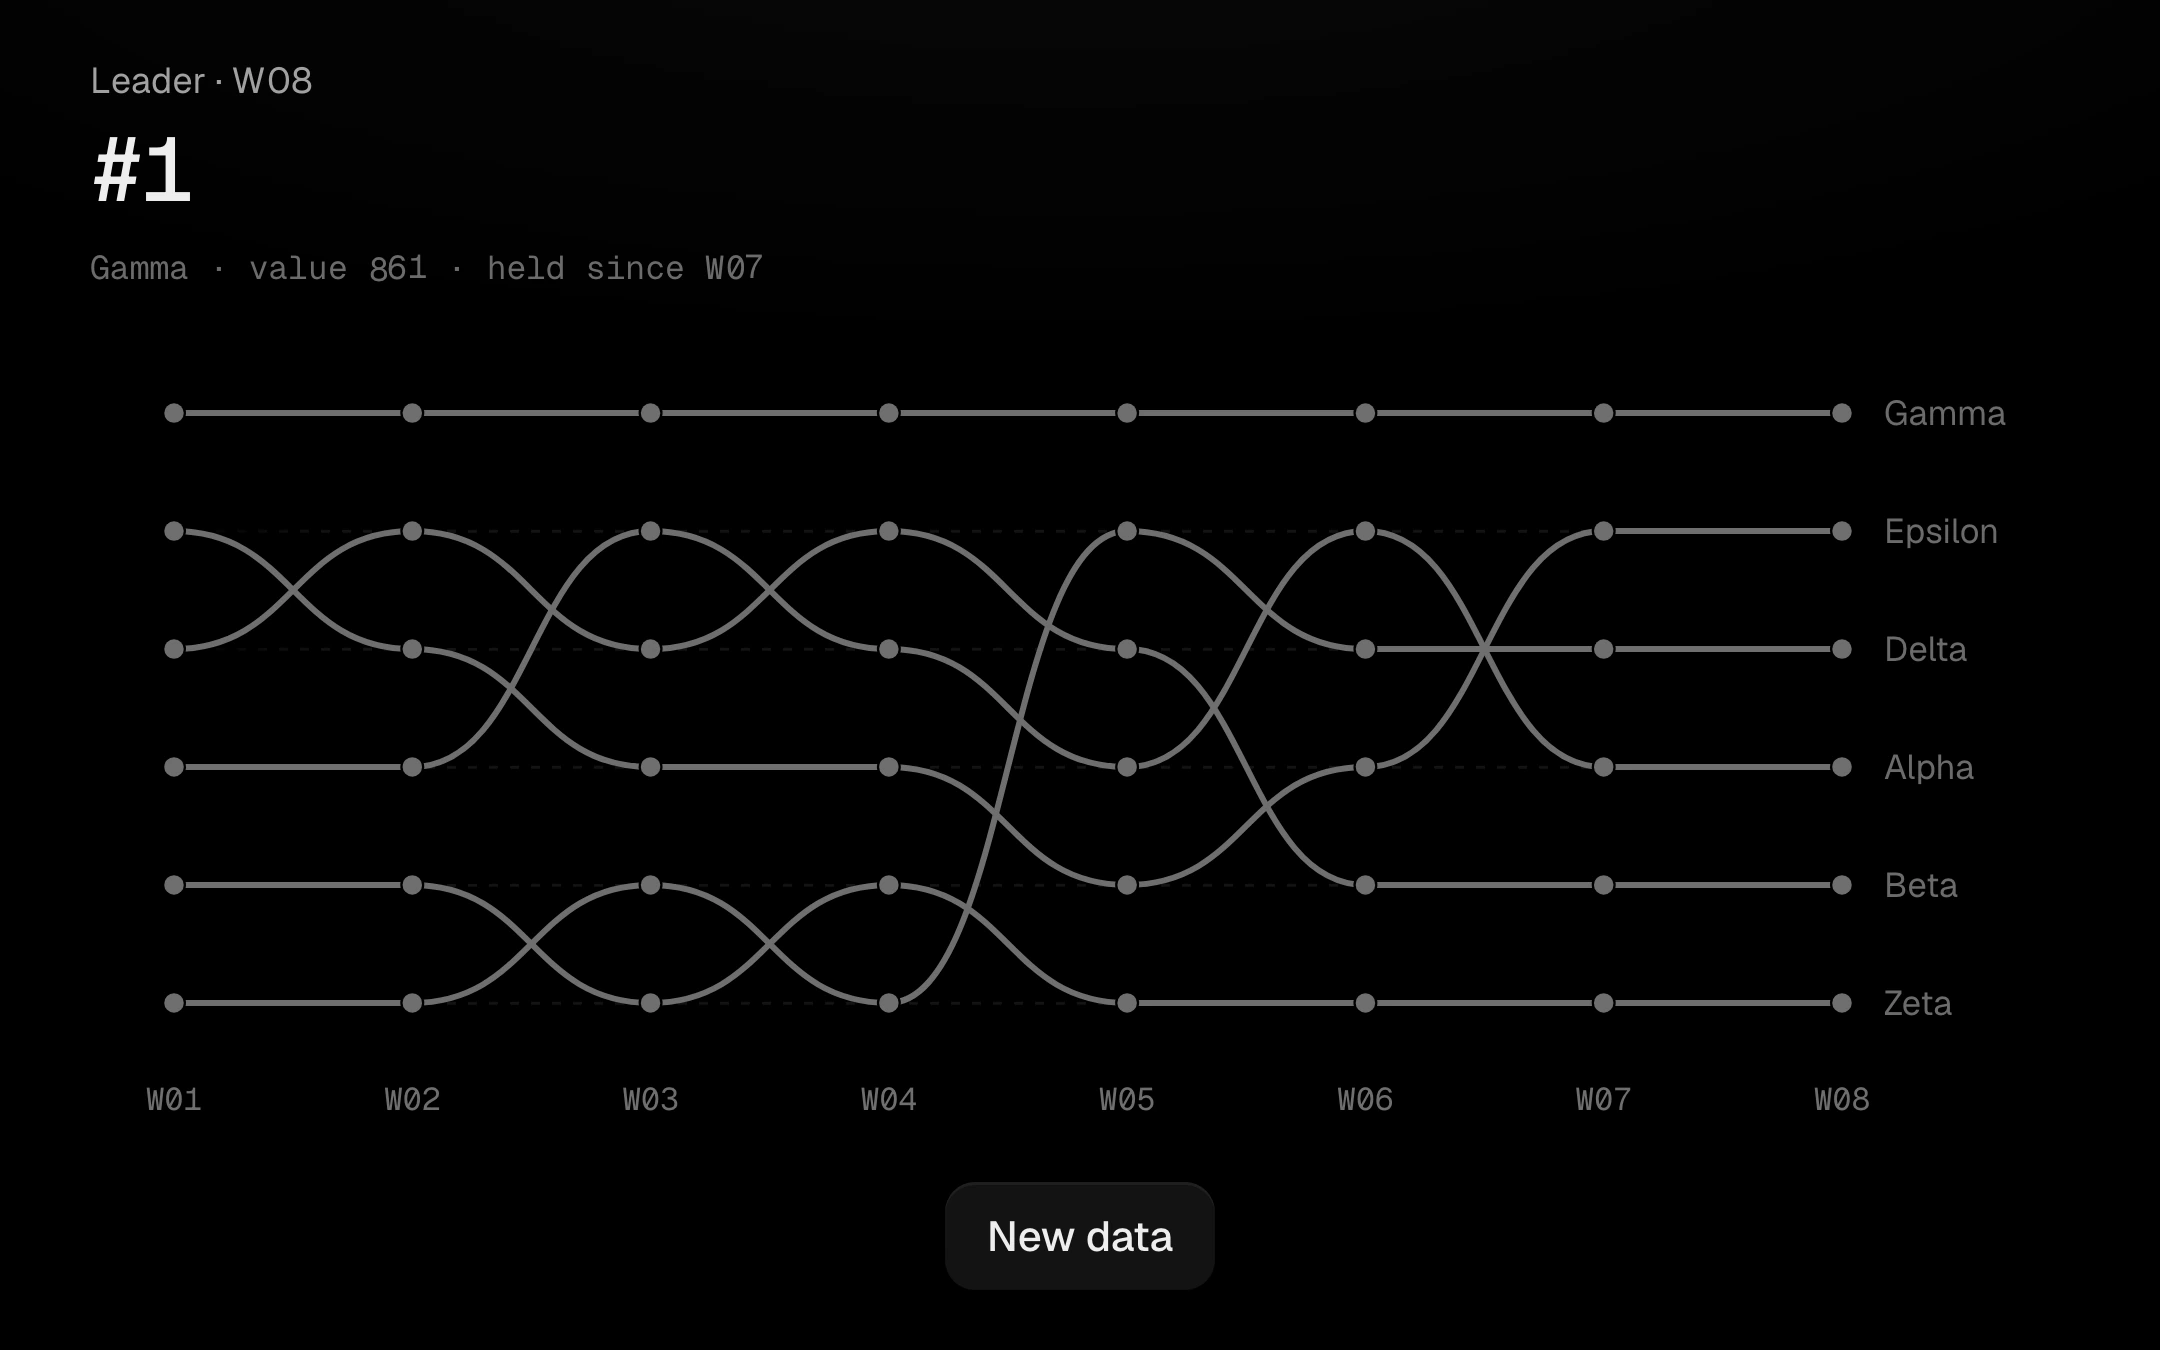
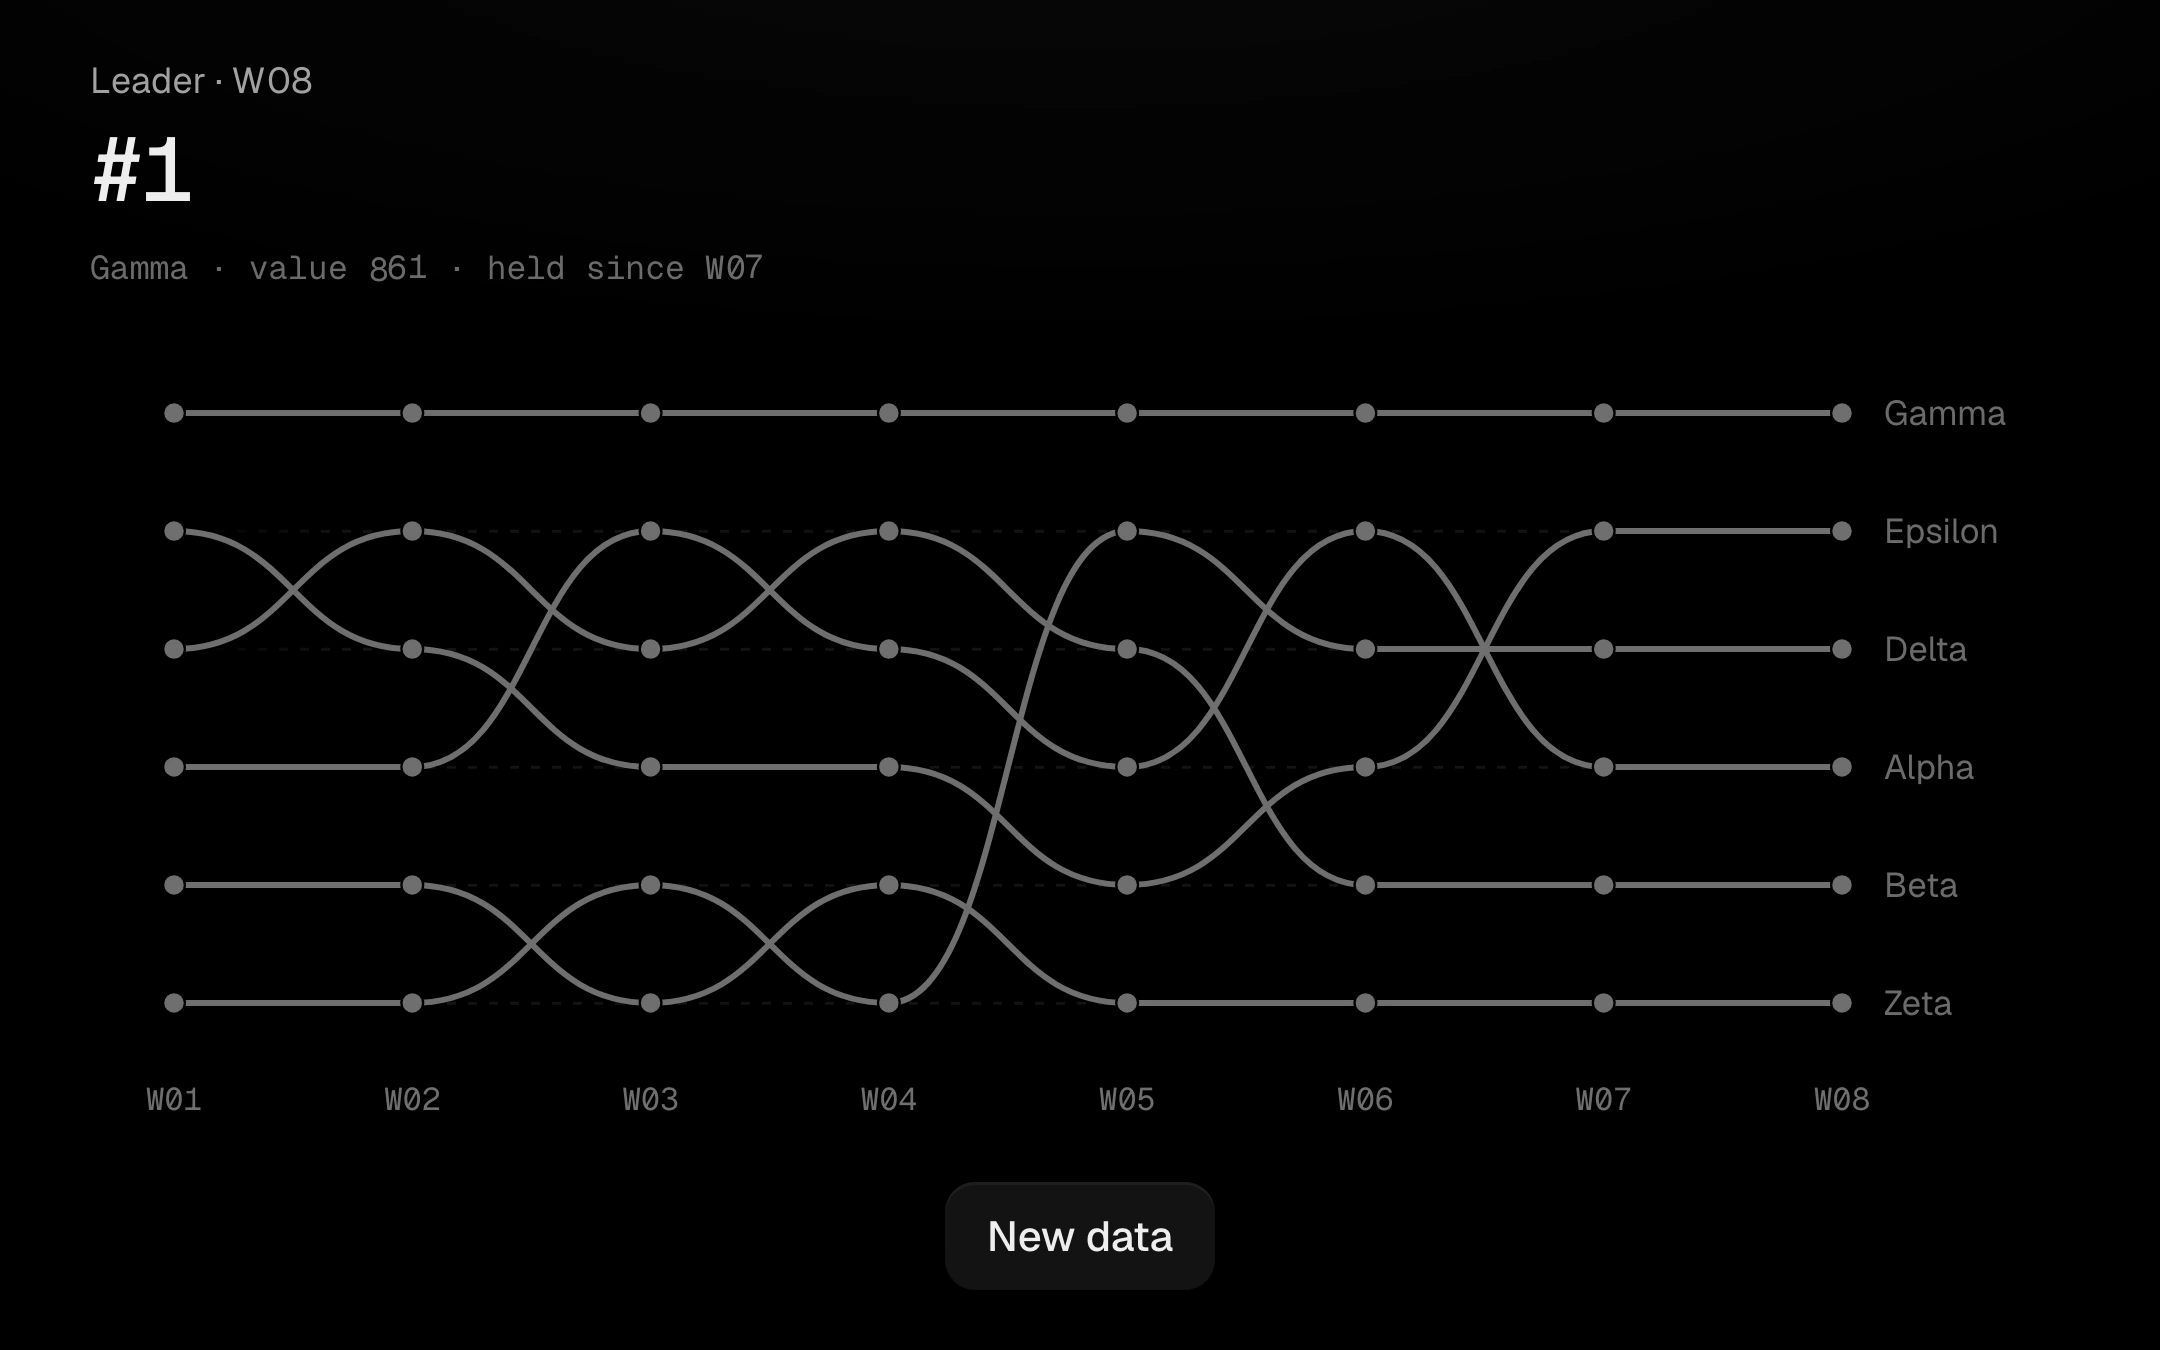
Rank over time as smooth S-curves between rank positions, with each series named at its right end.
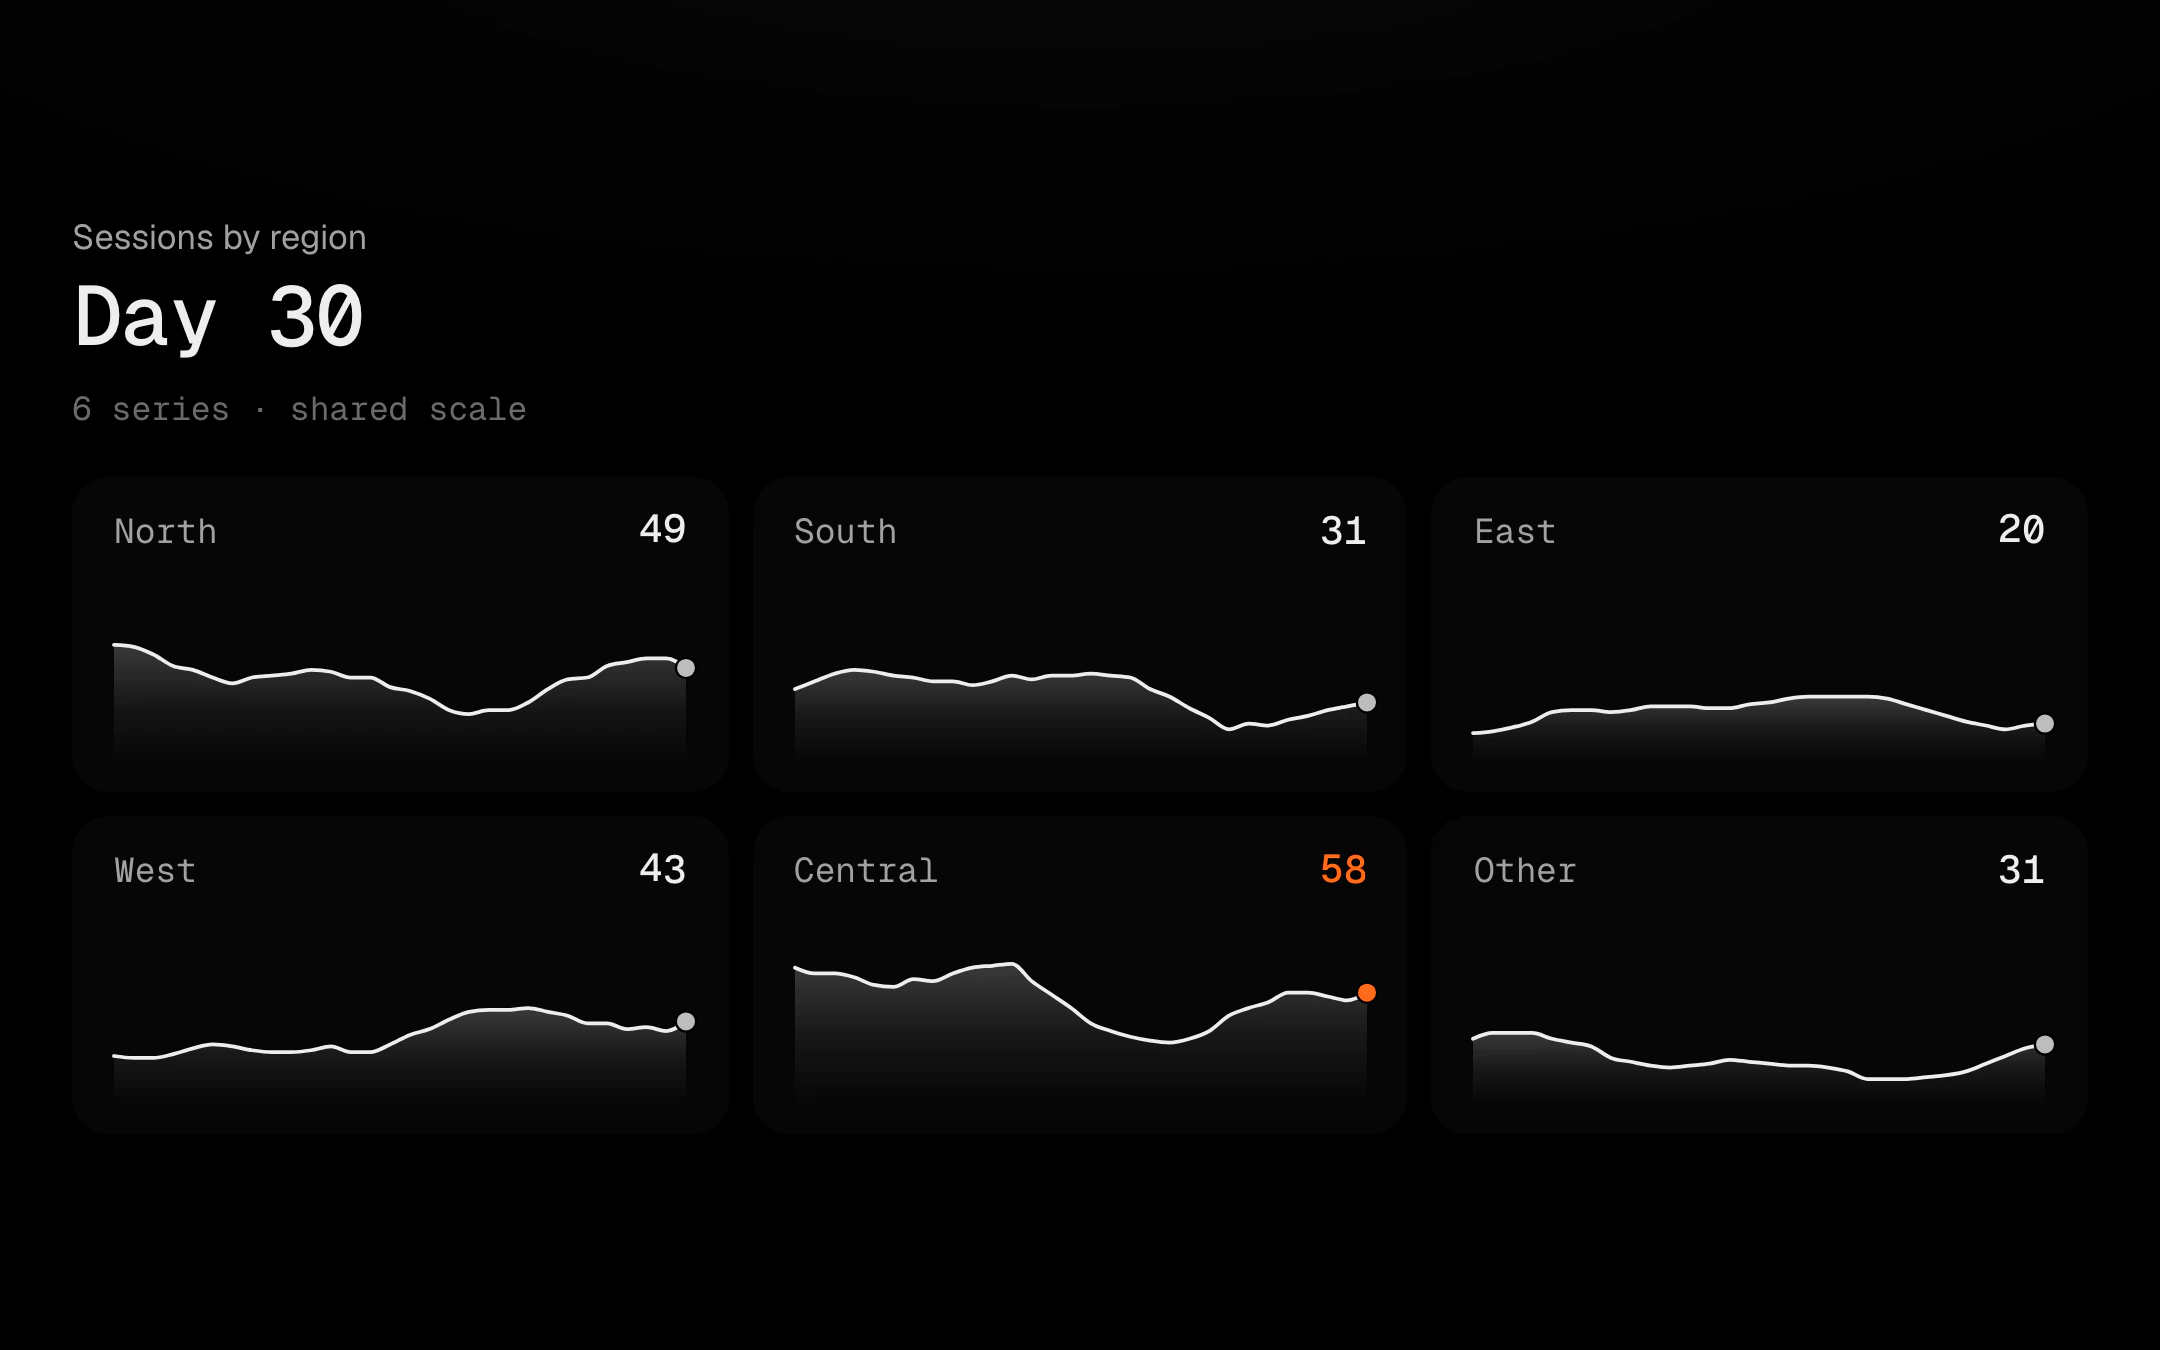
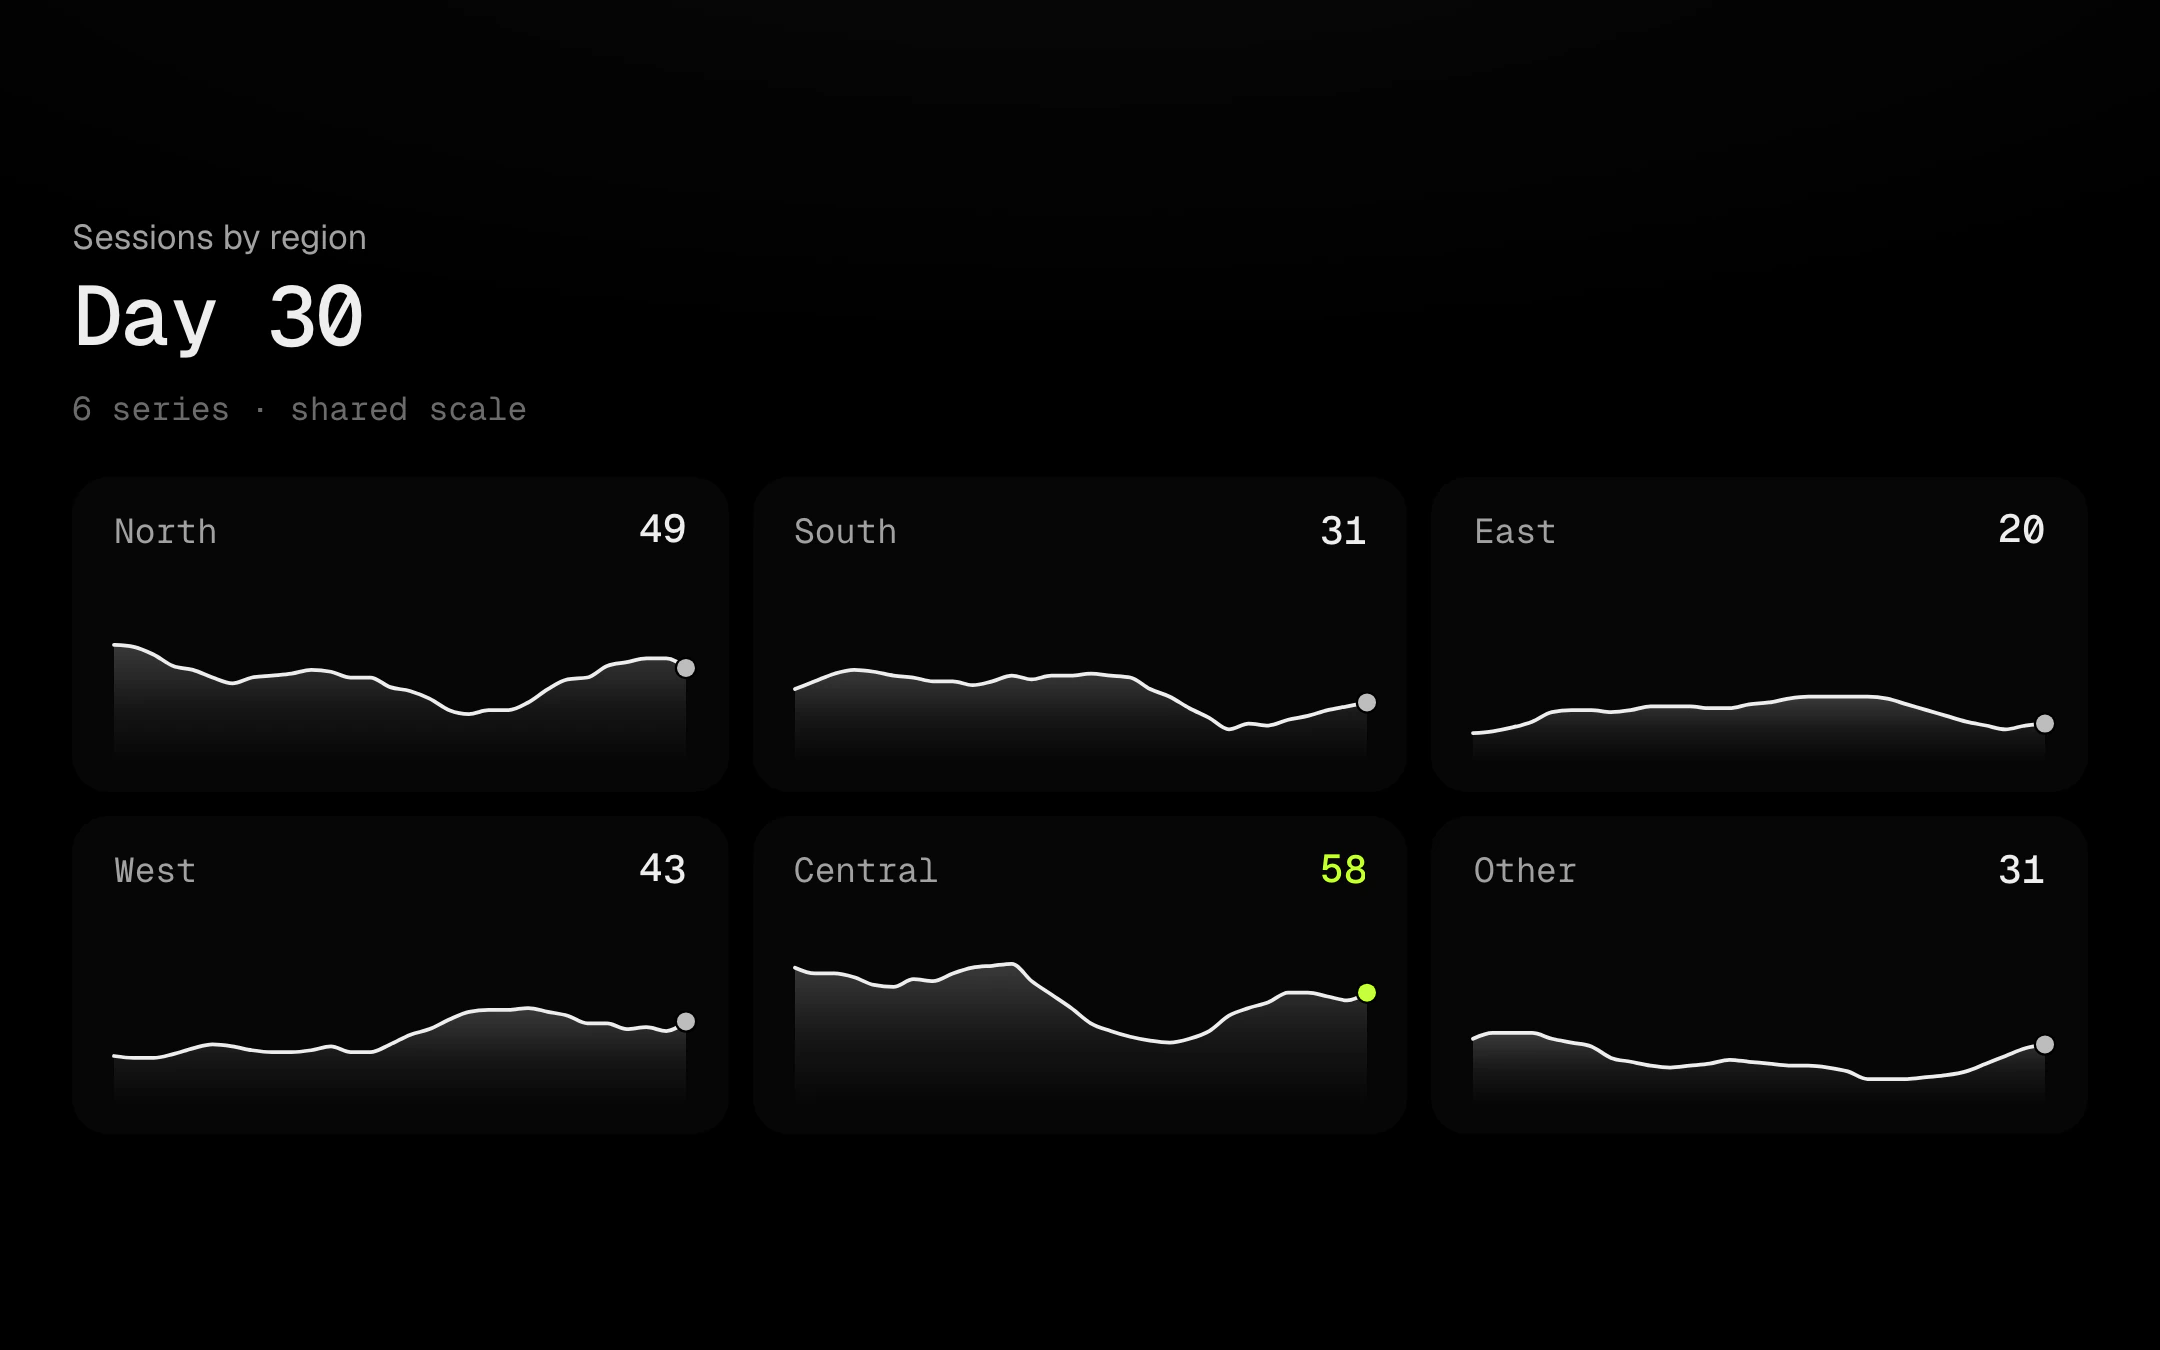
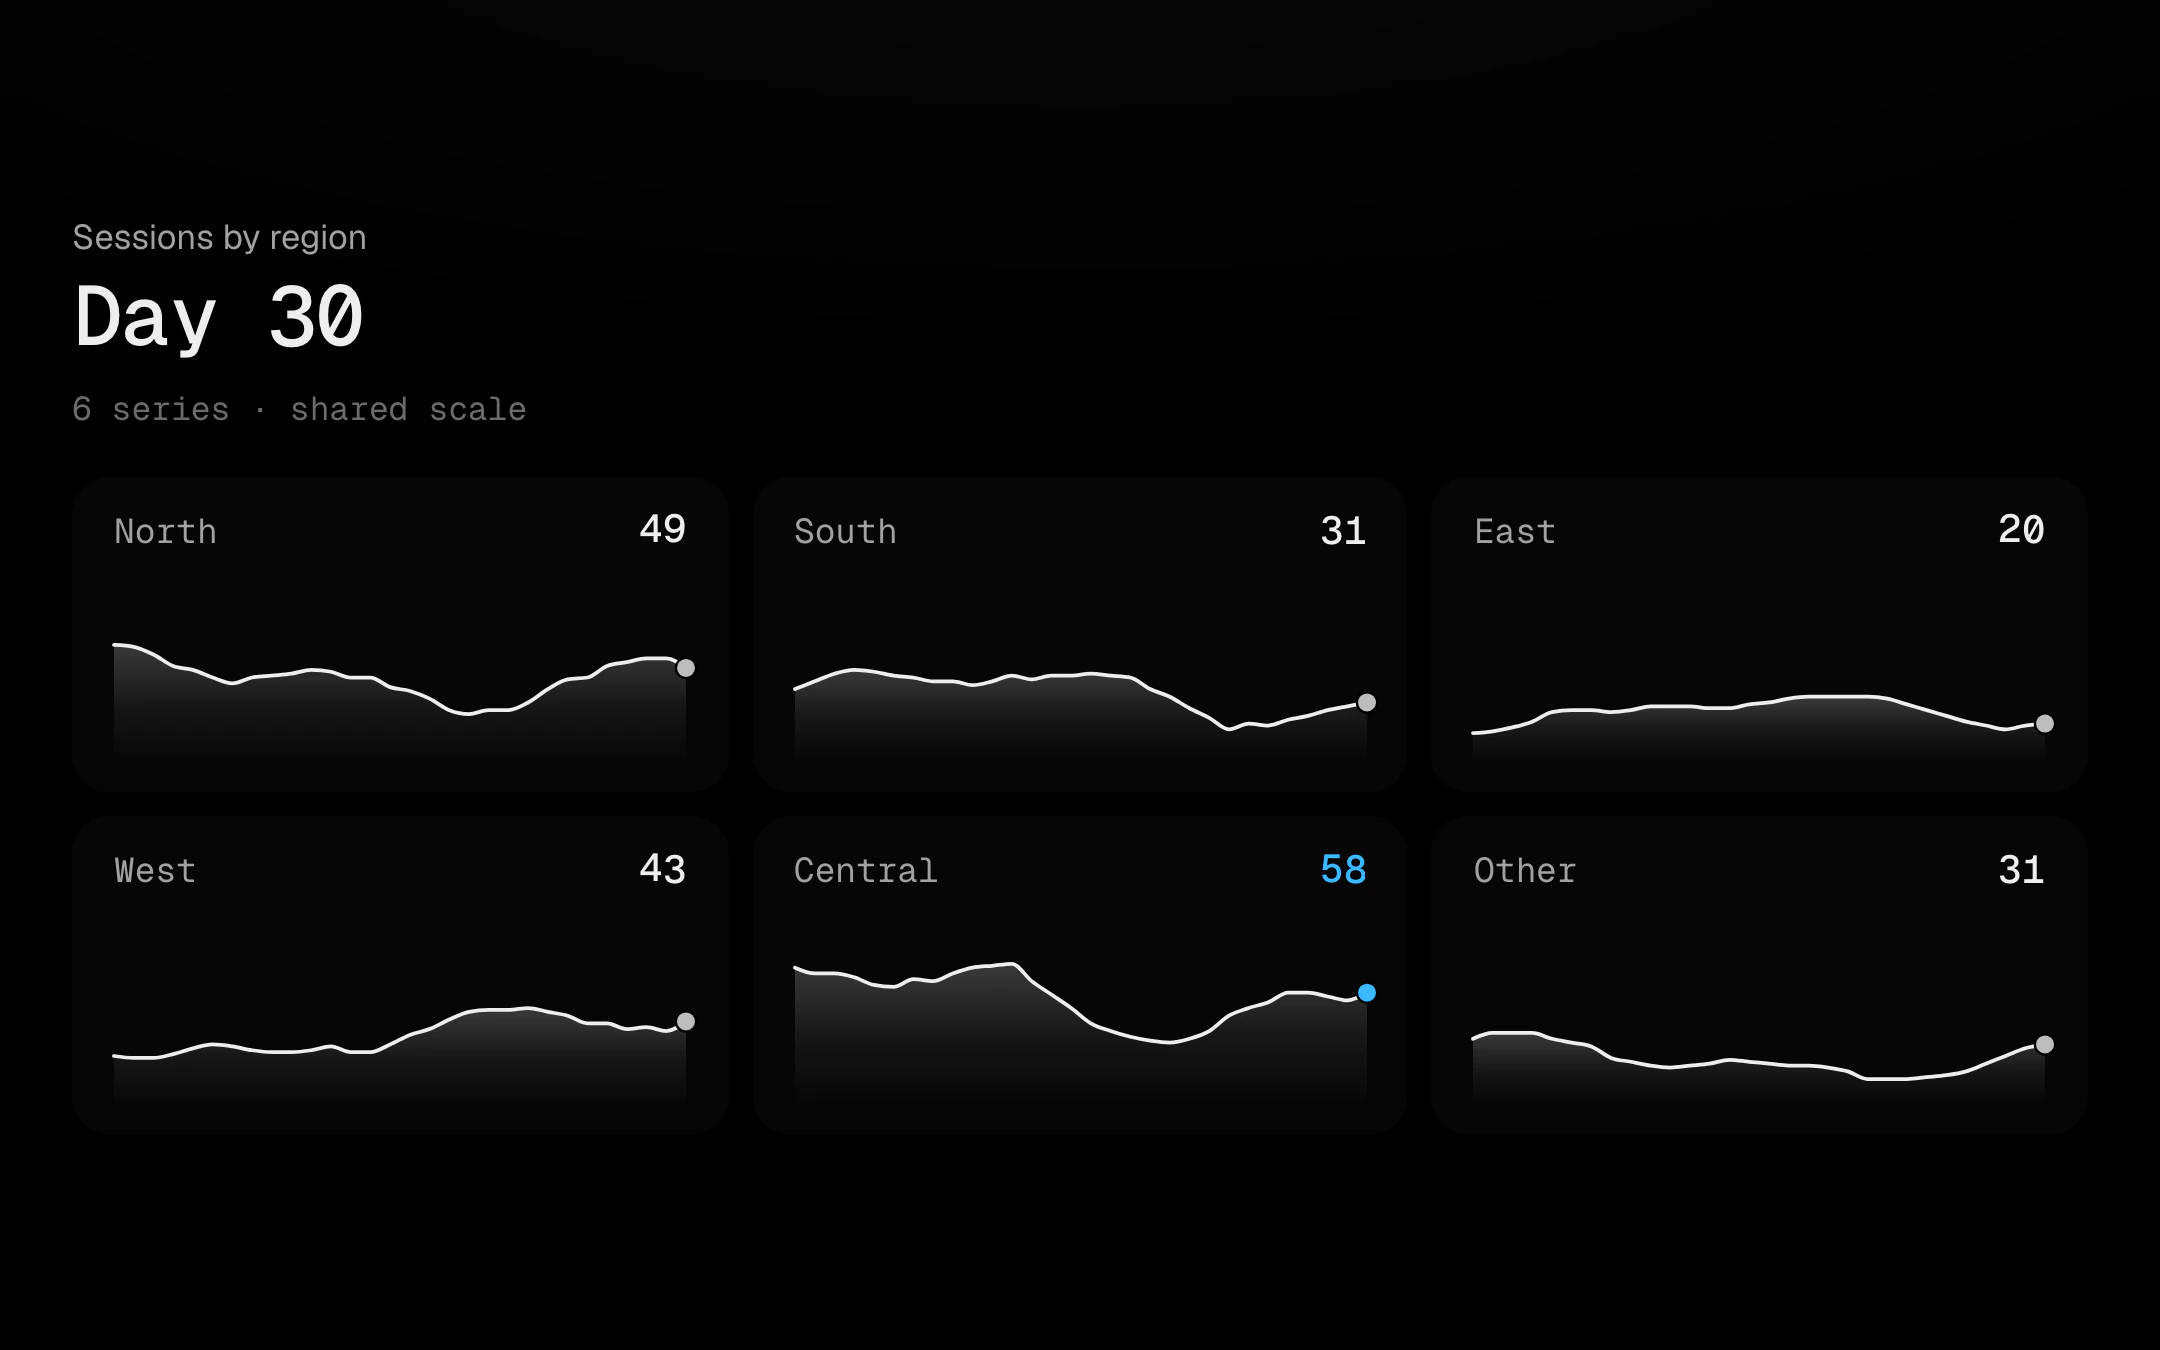
A grid of tiny charts that share one crosshair.
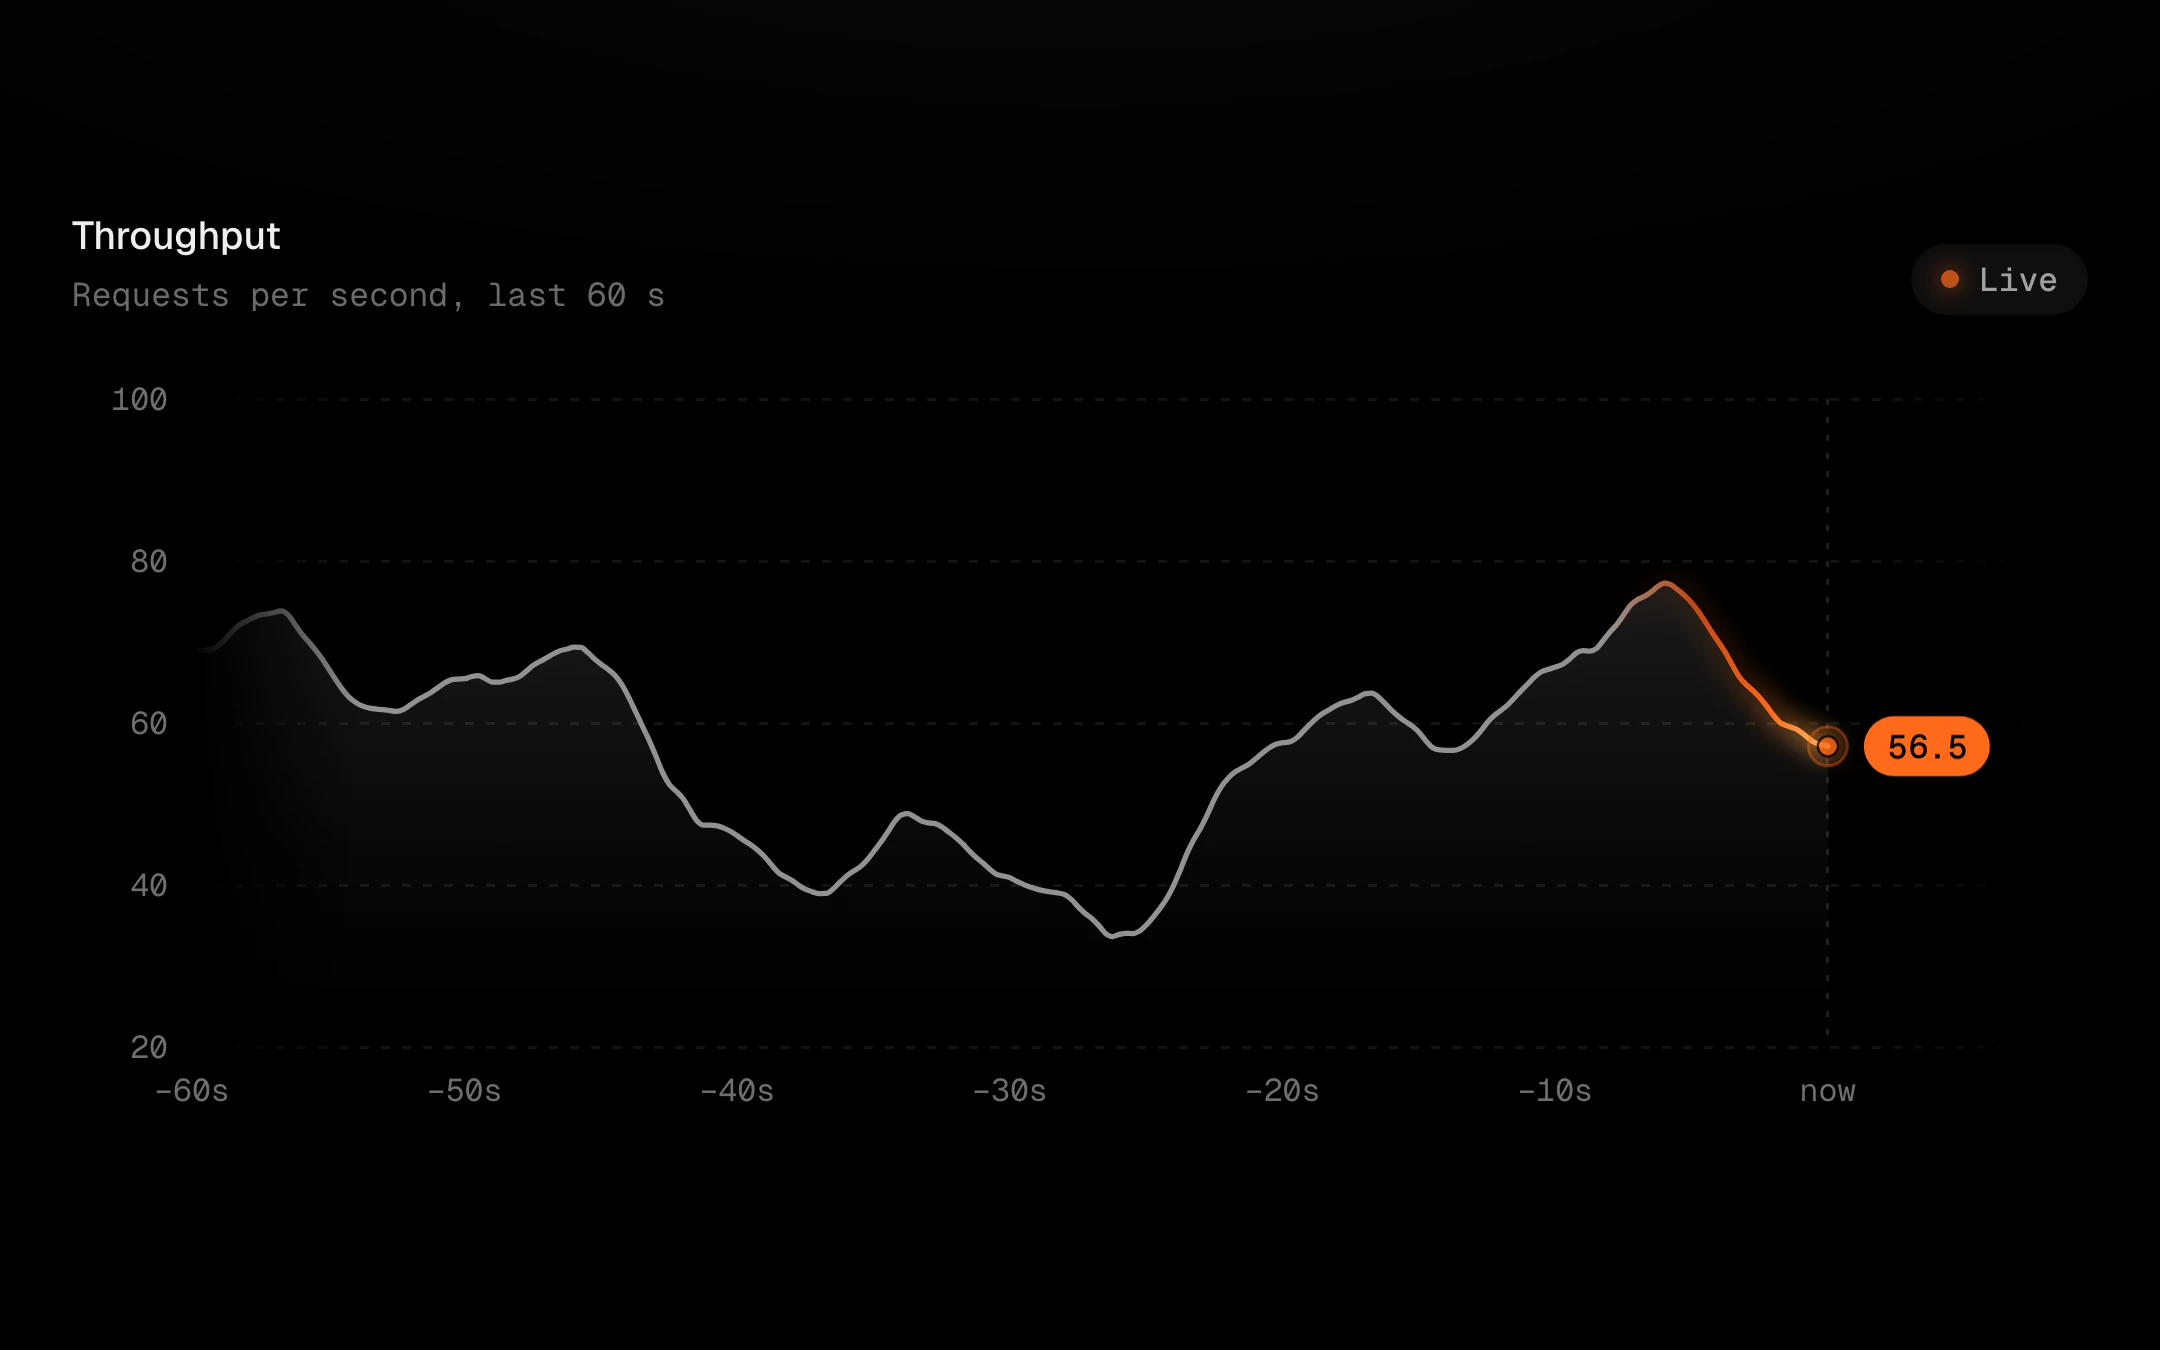
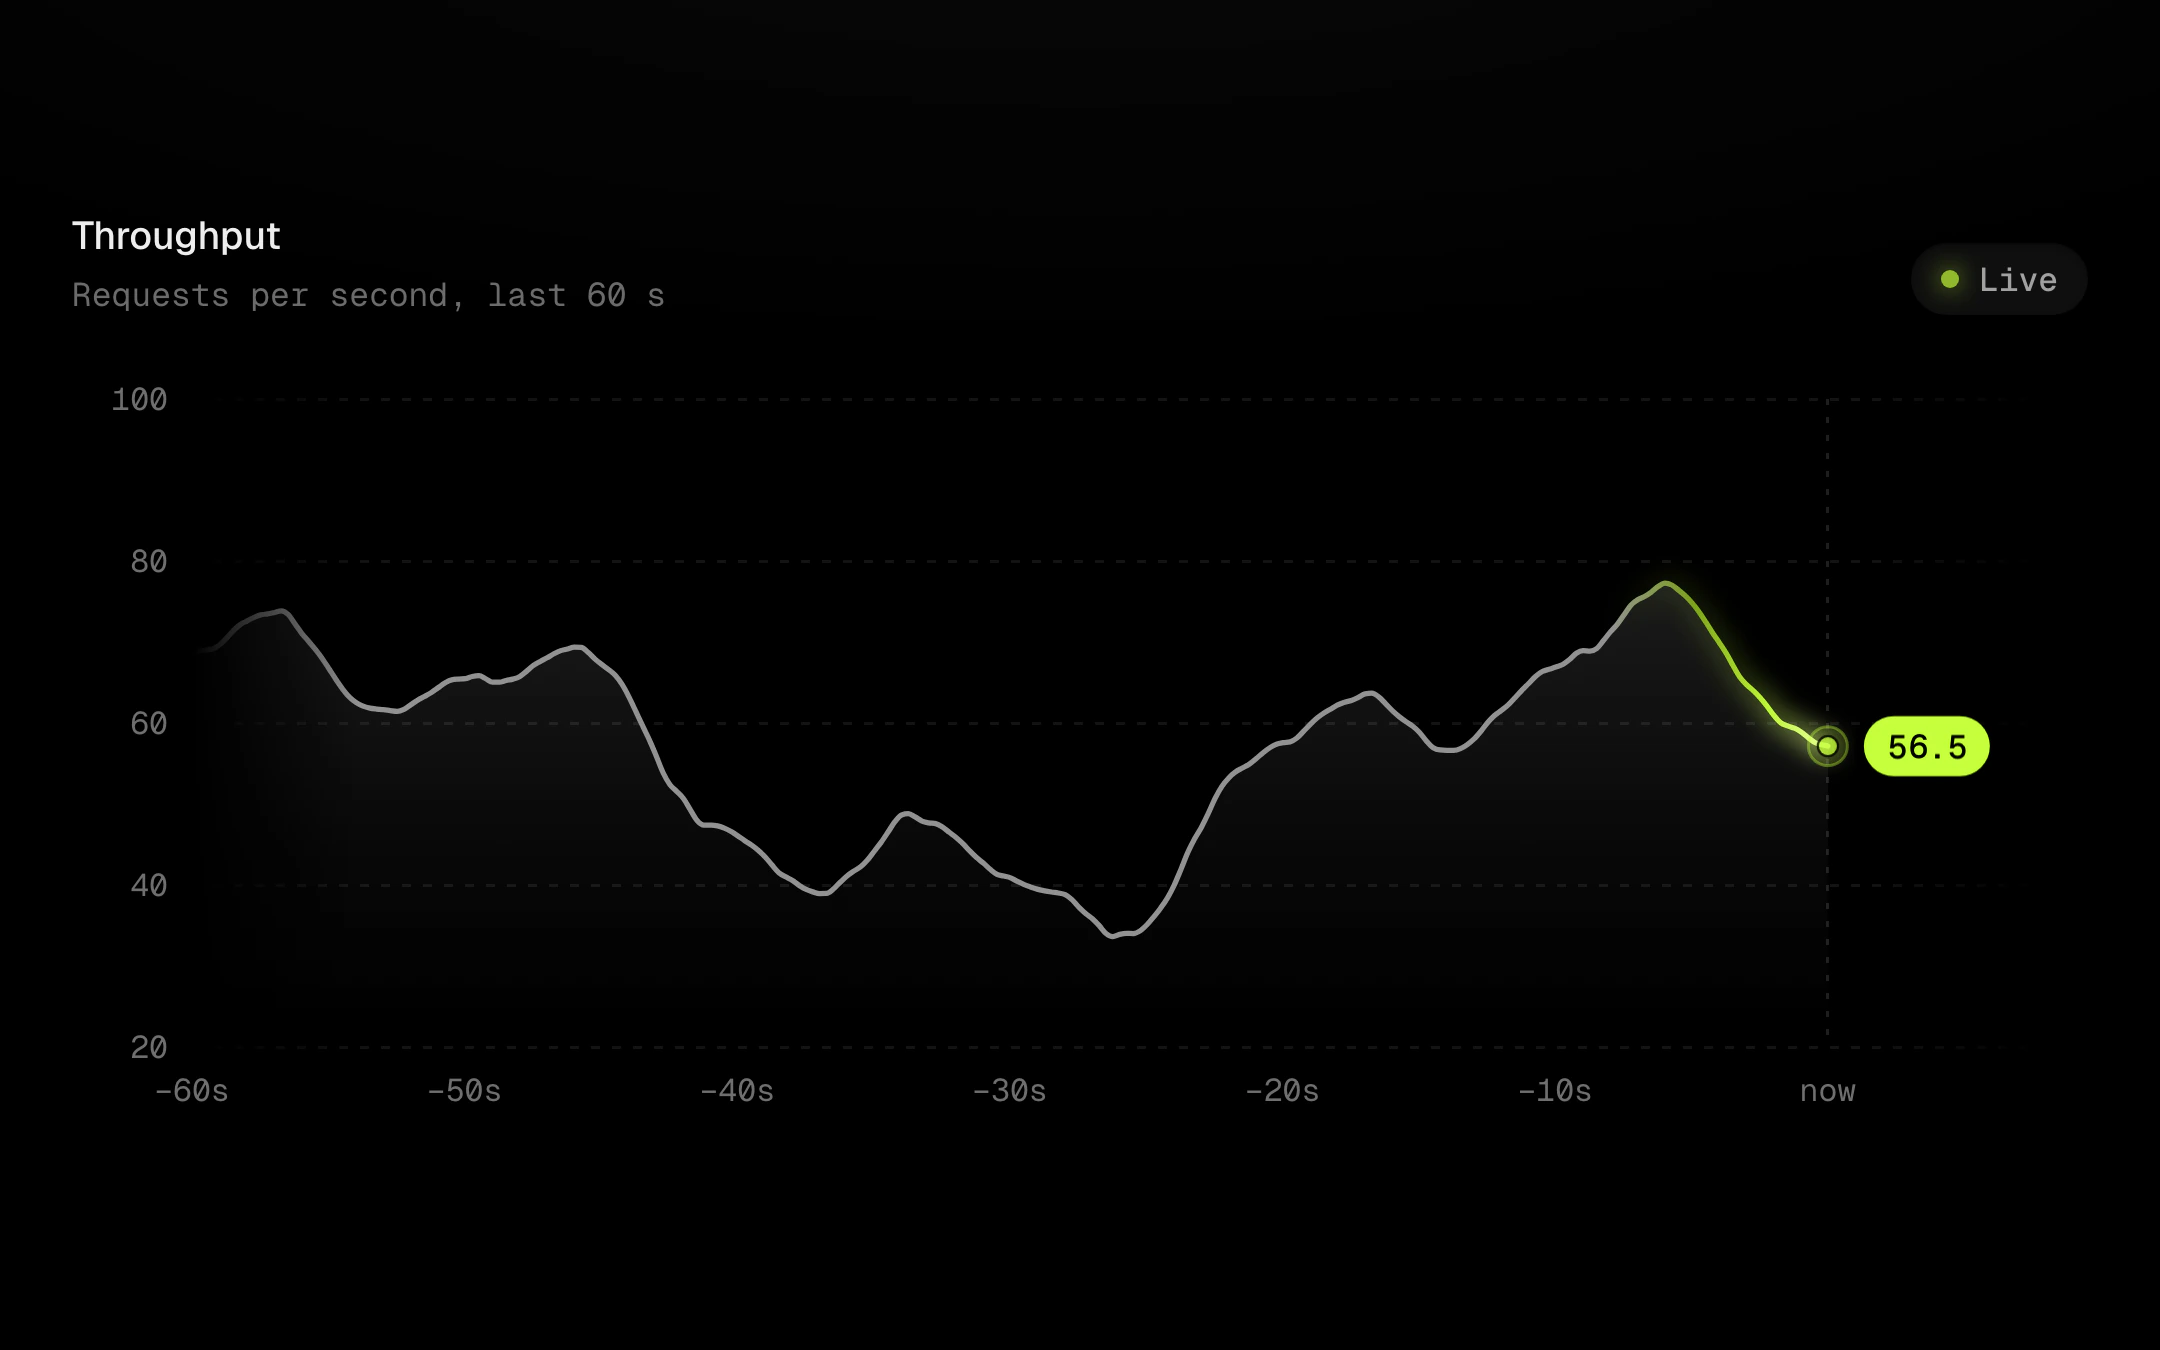
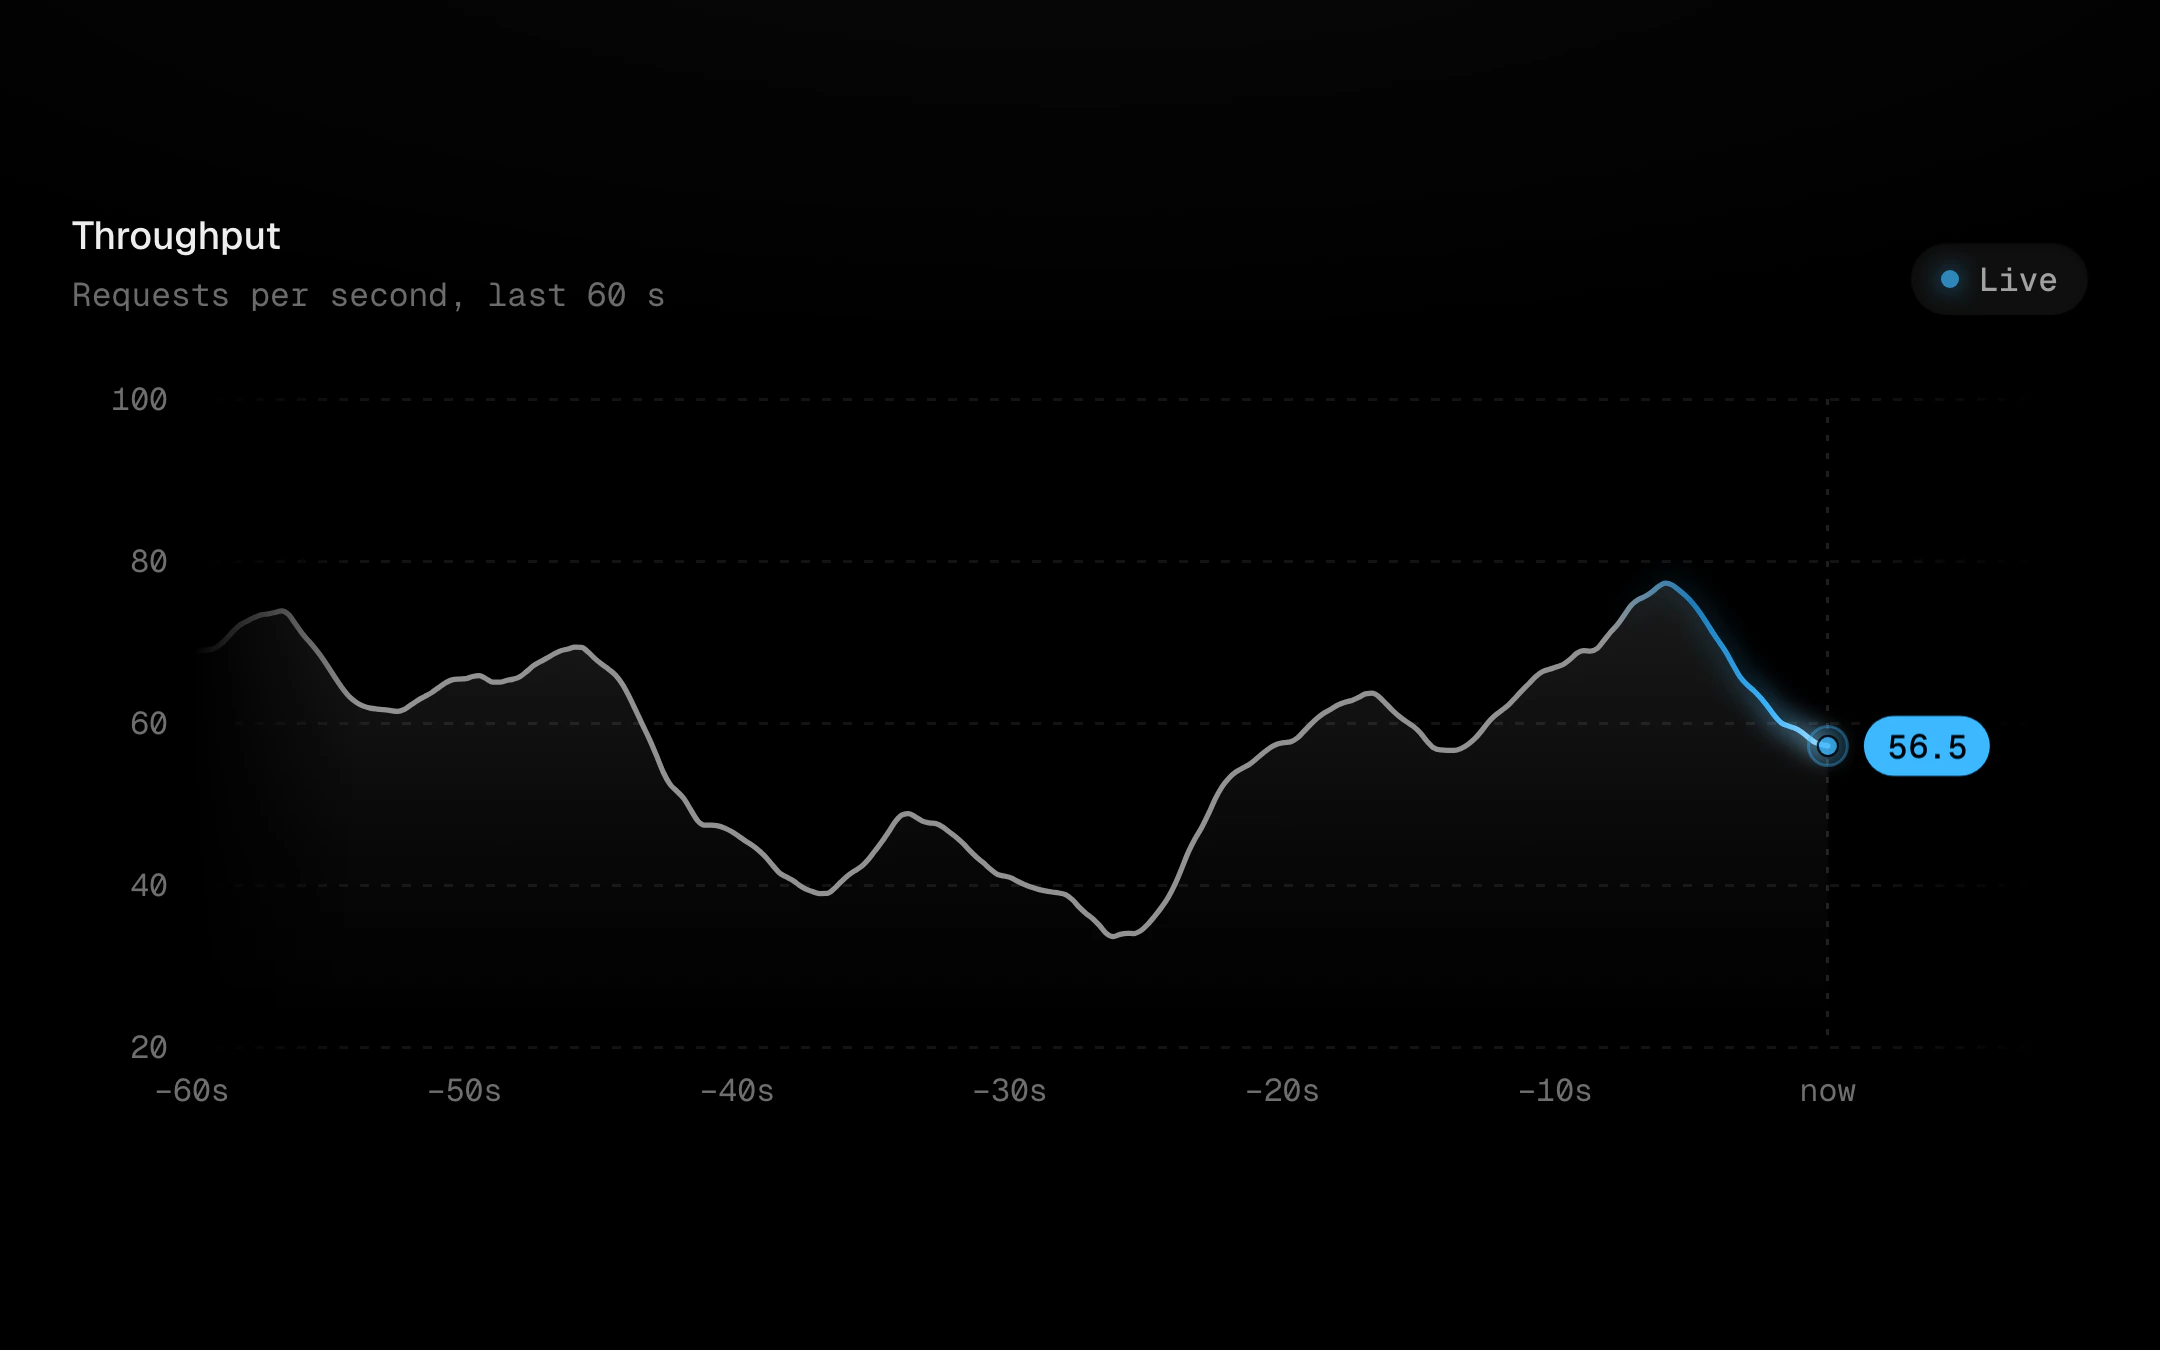
A streaming line that never ticks.
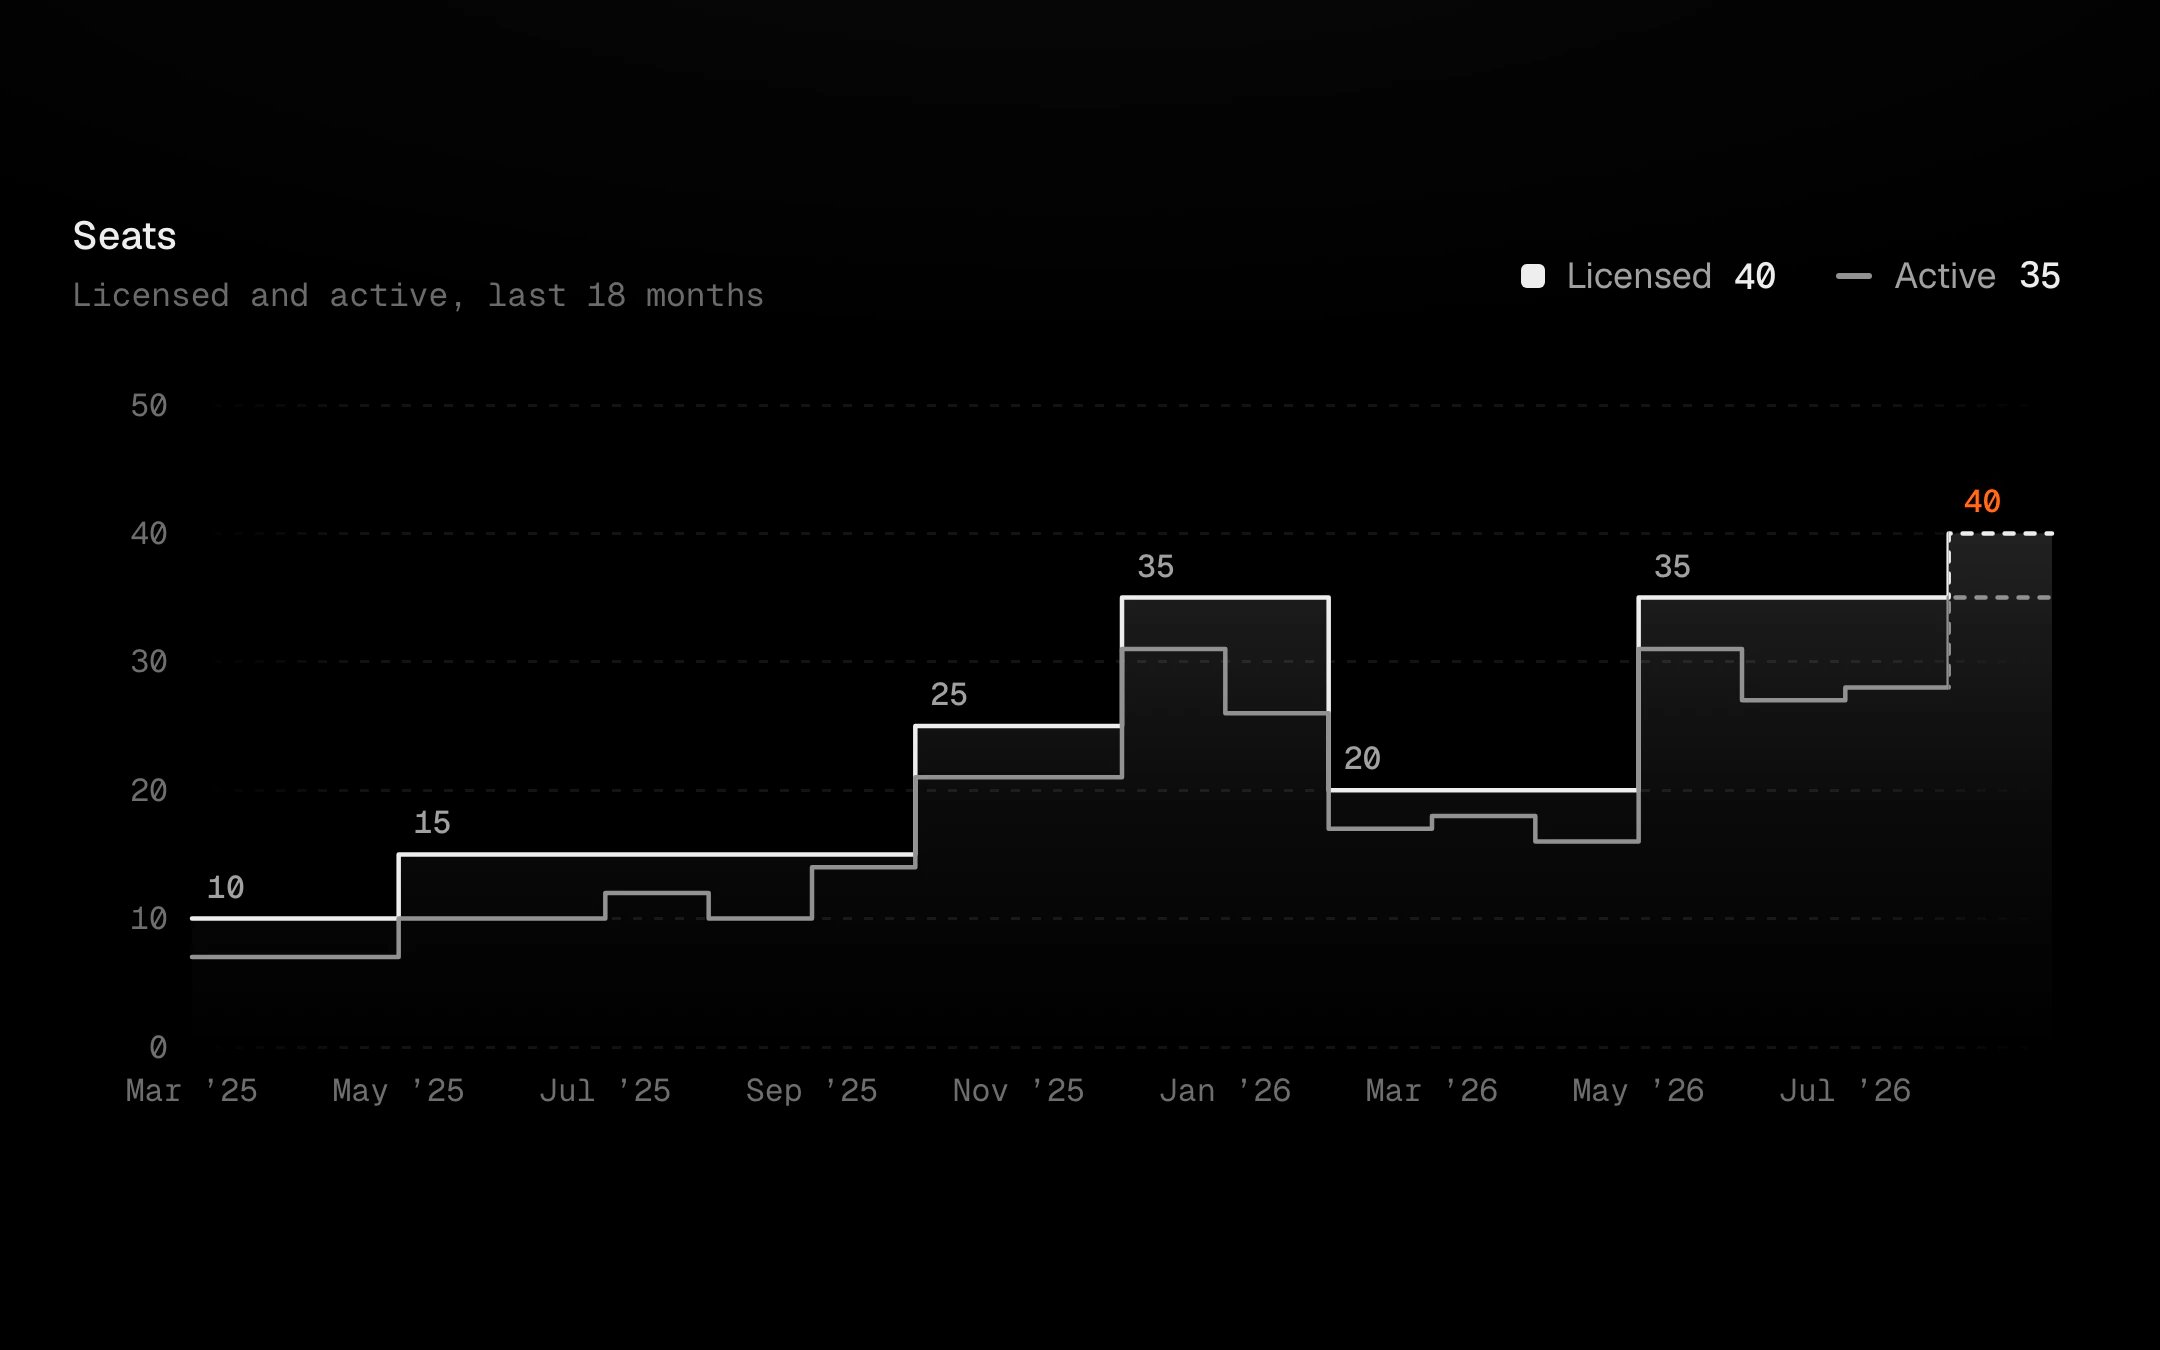
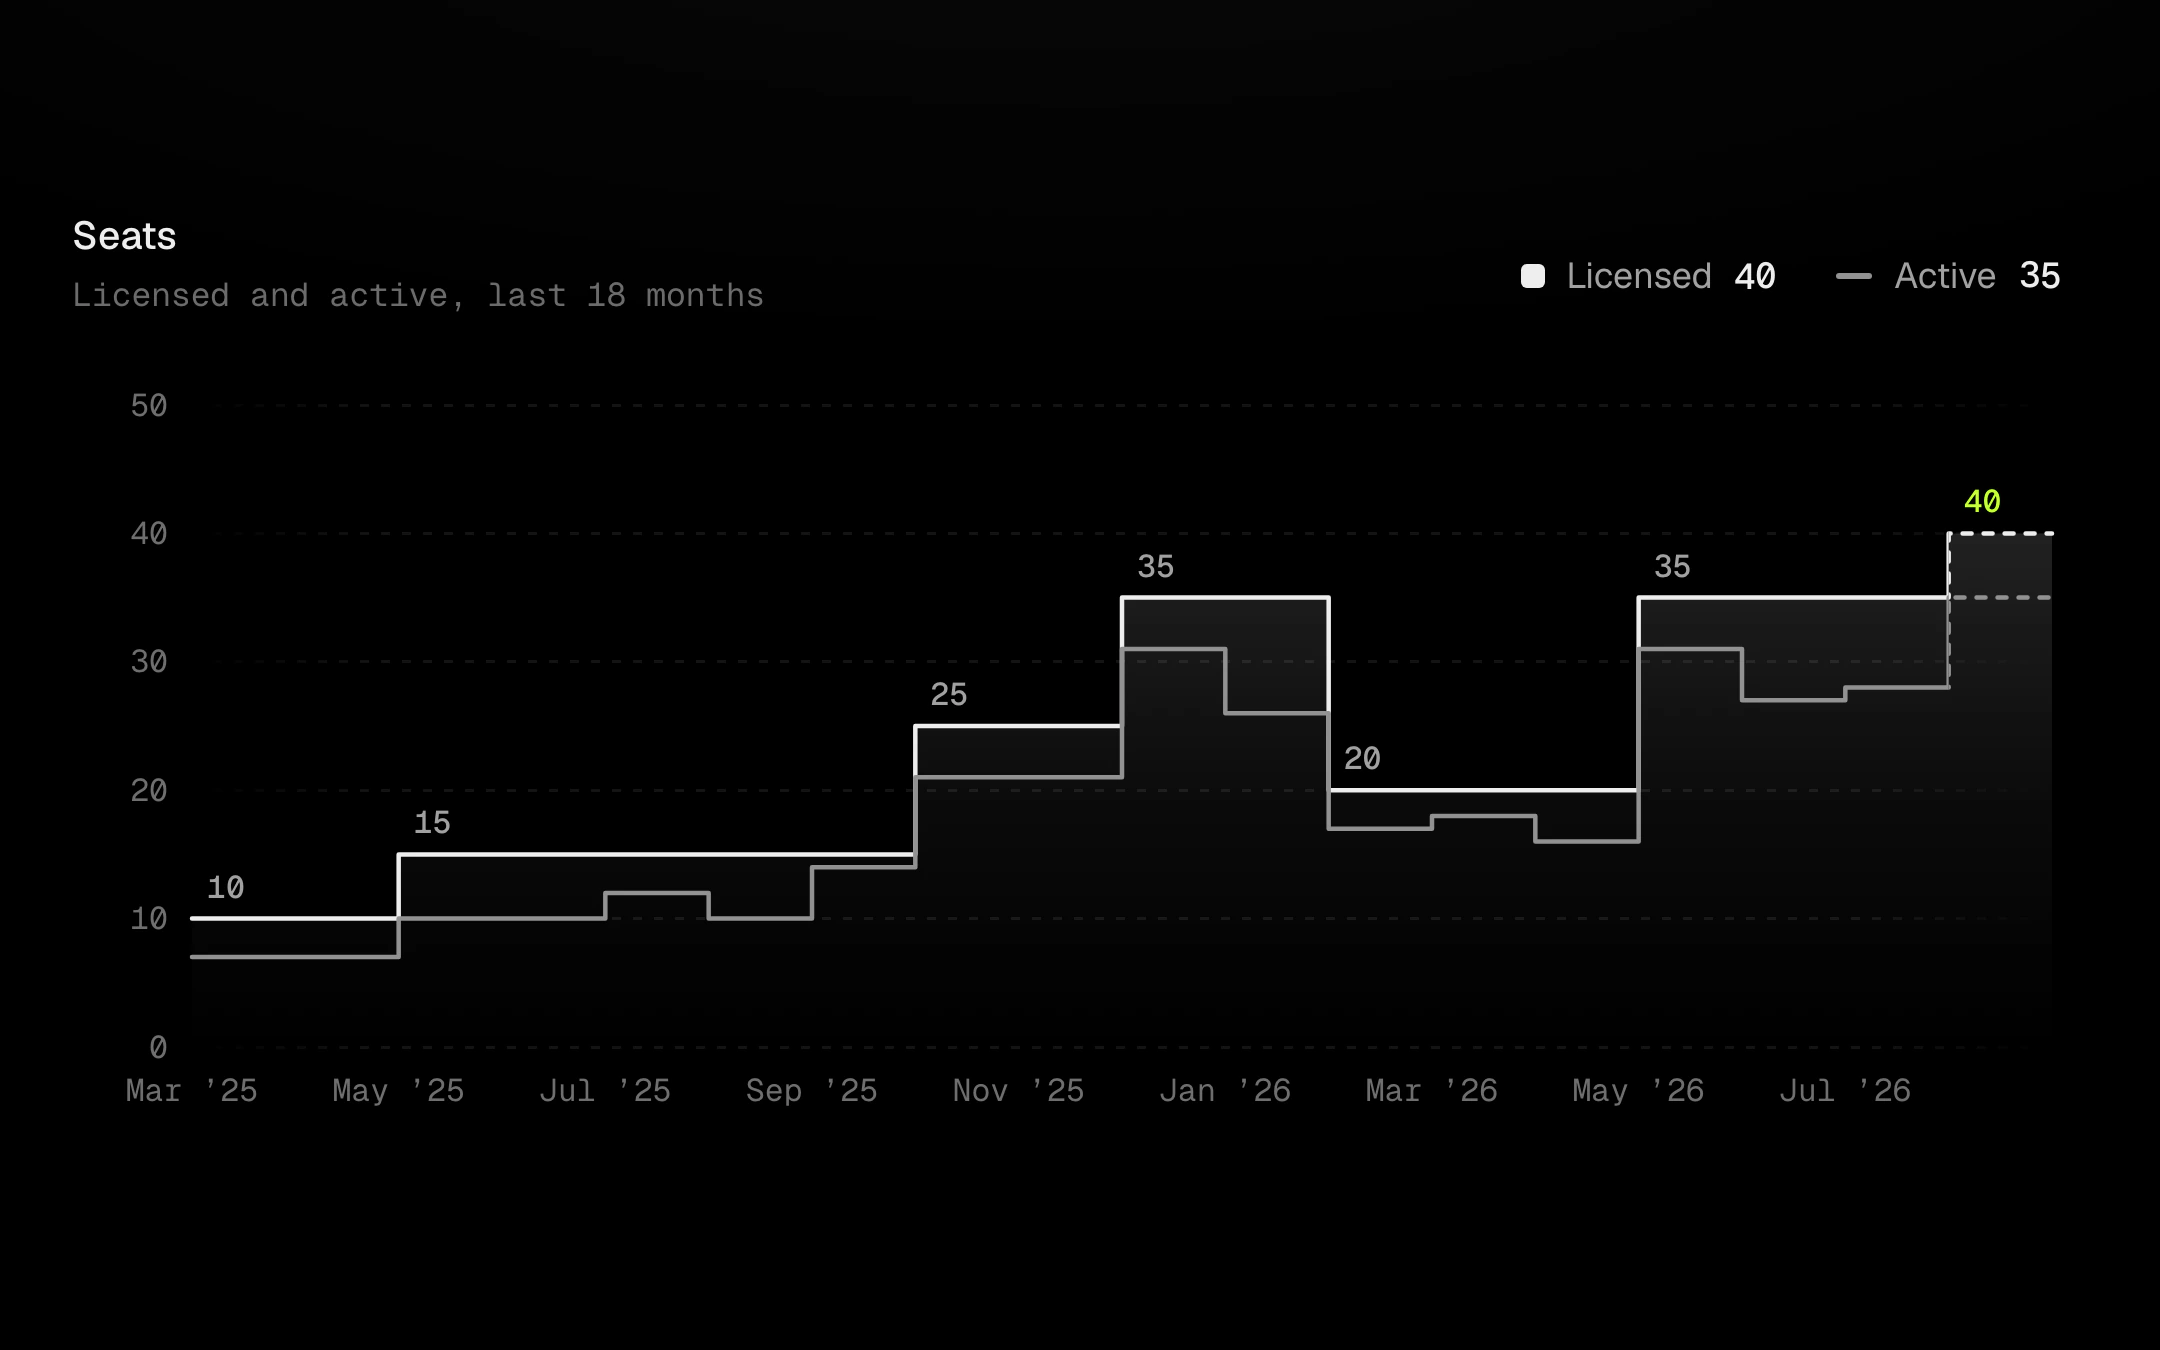
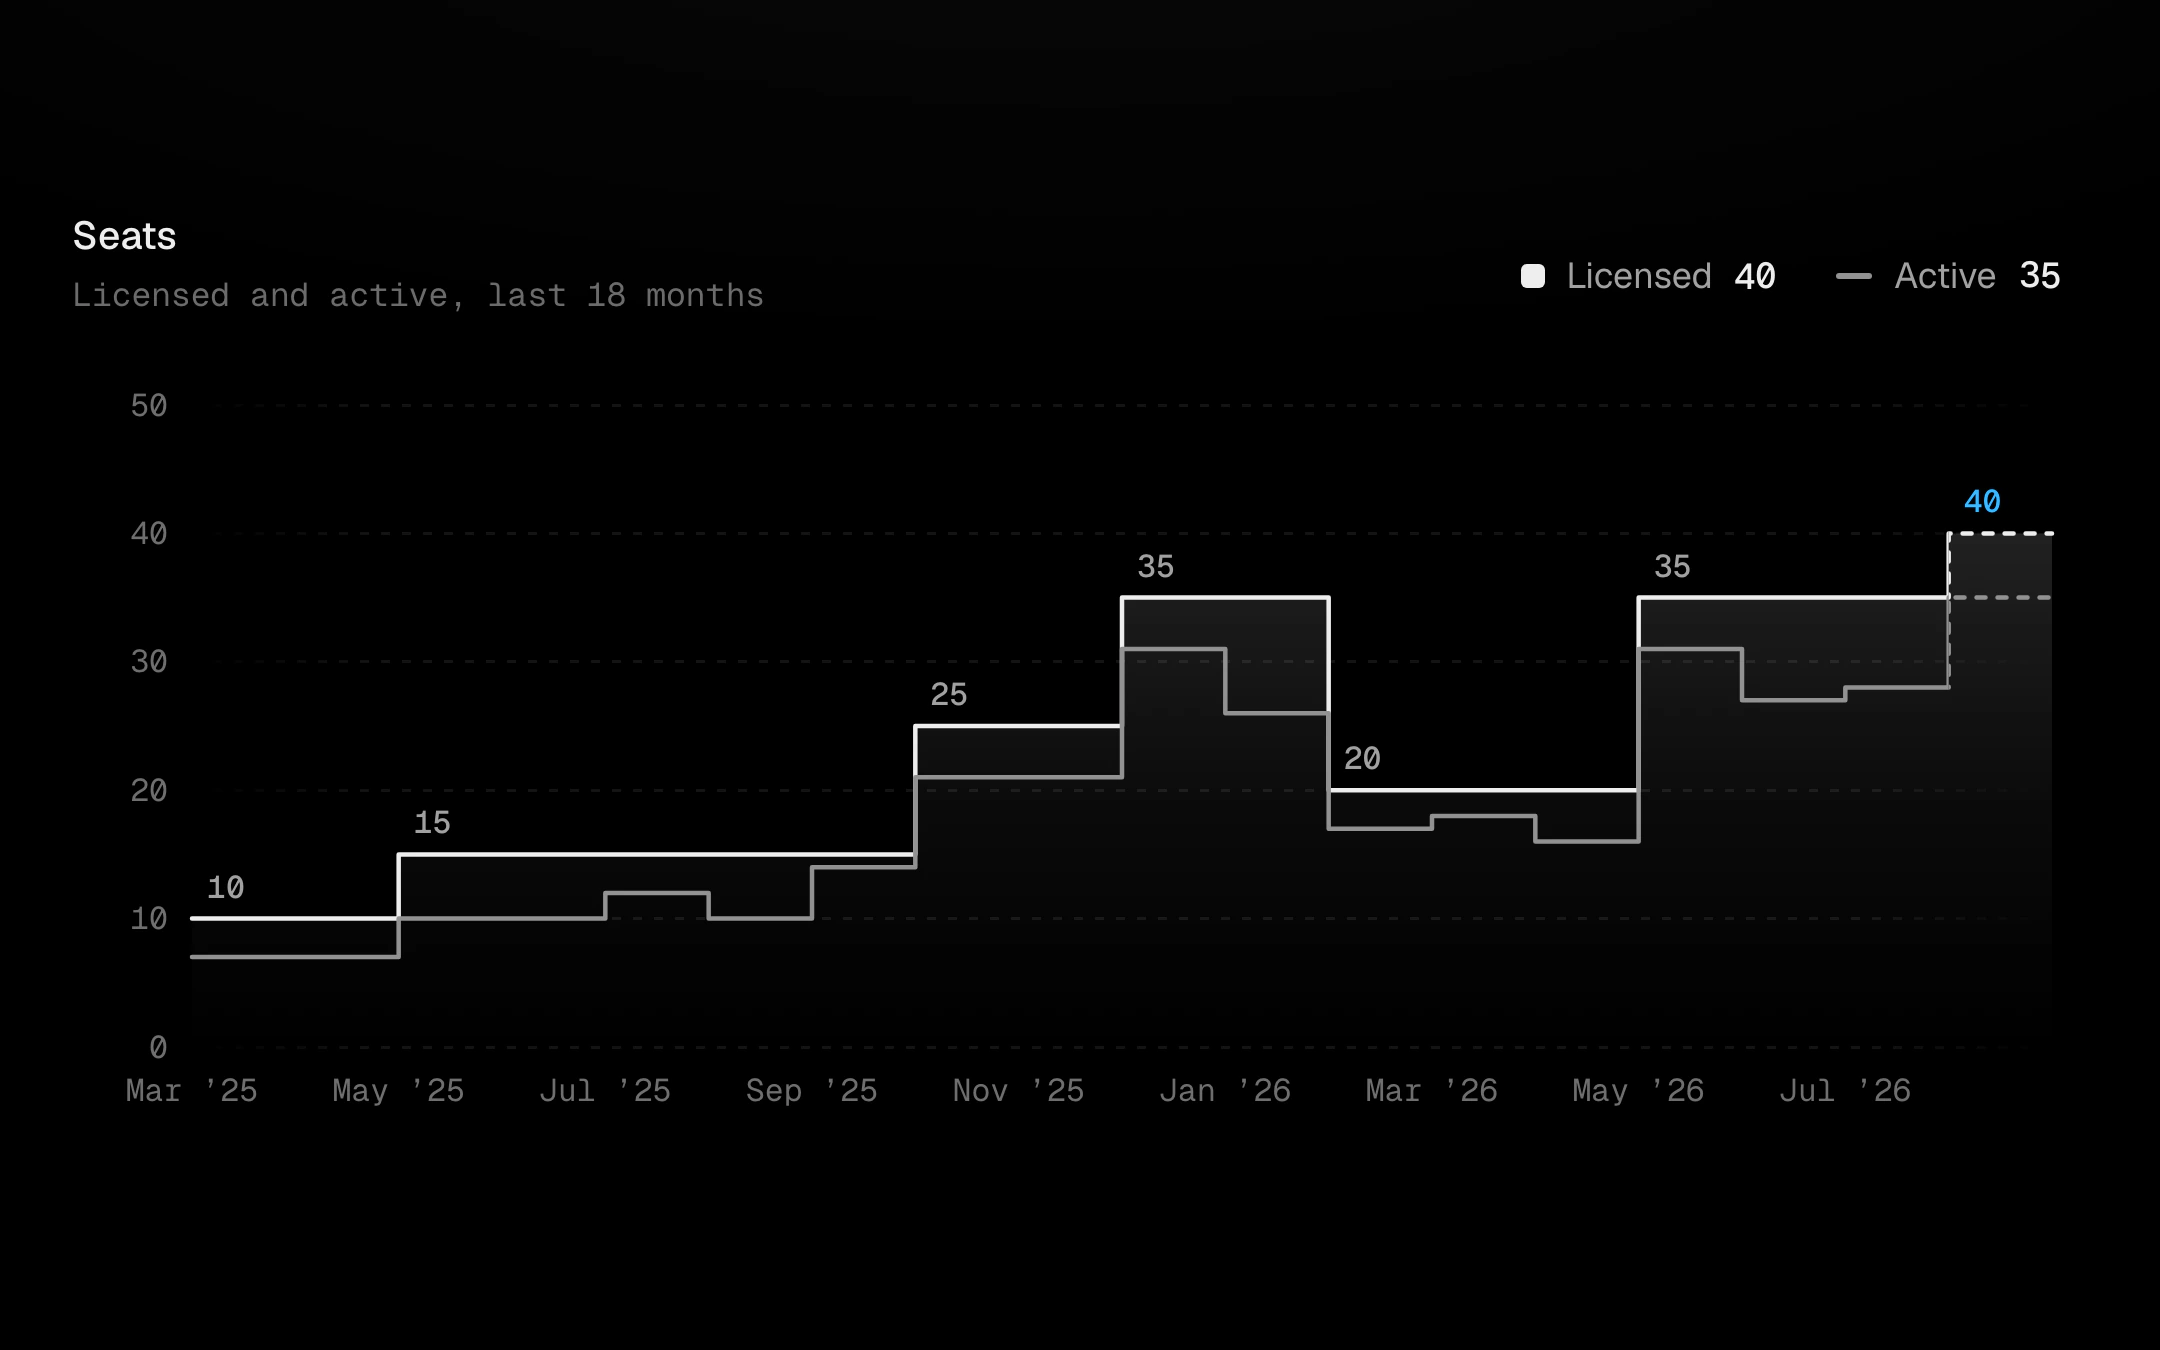
Honest steps for tiers, plans and prices: values that hold until they change.
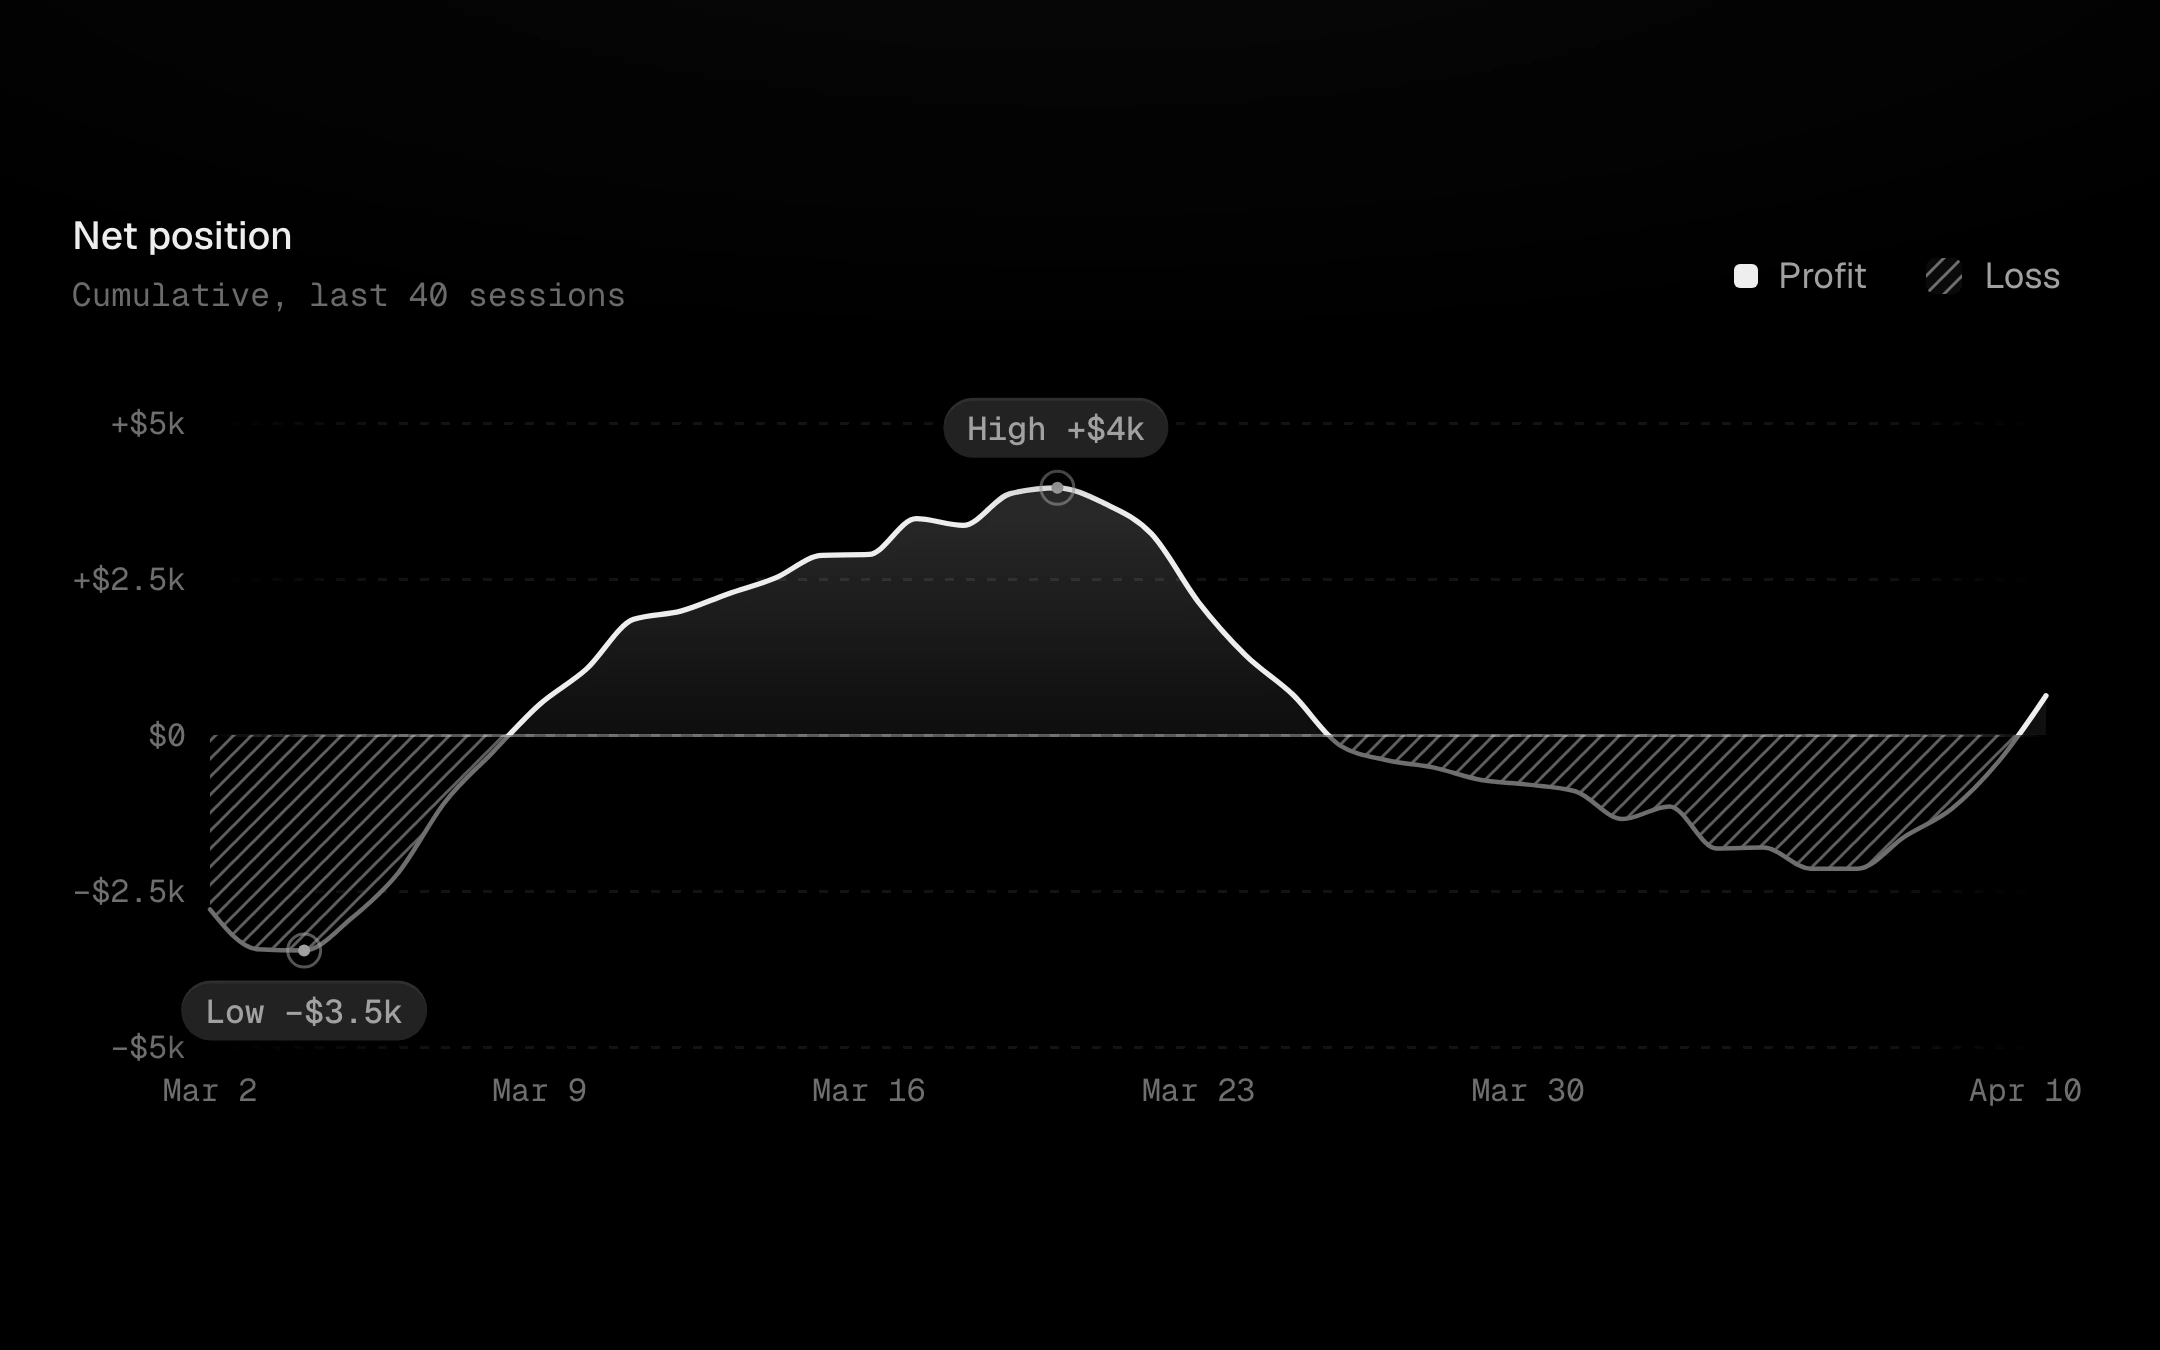
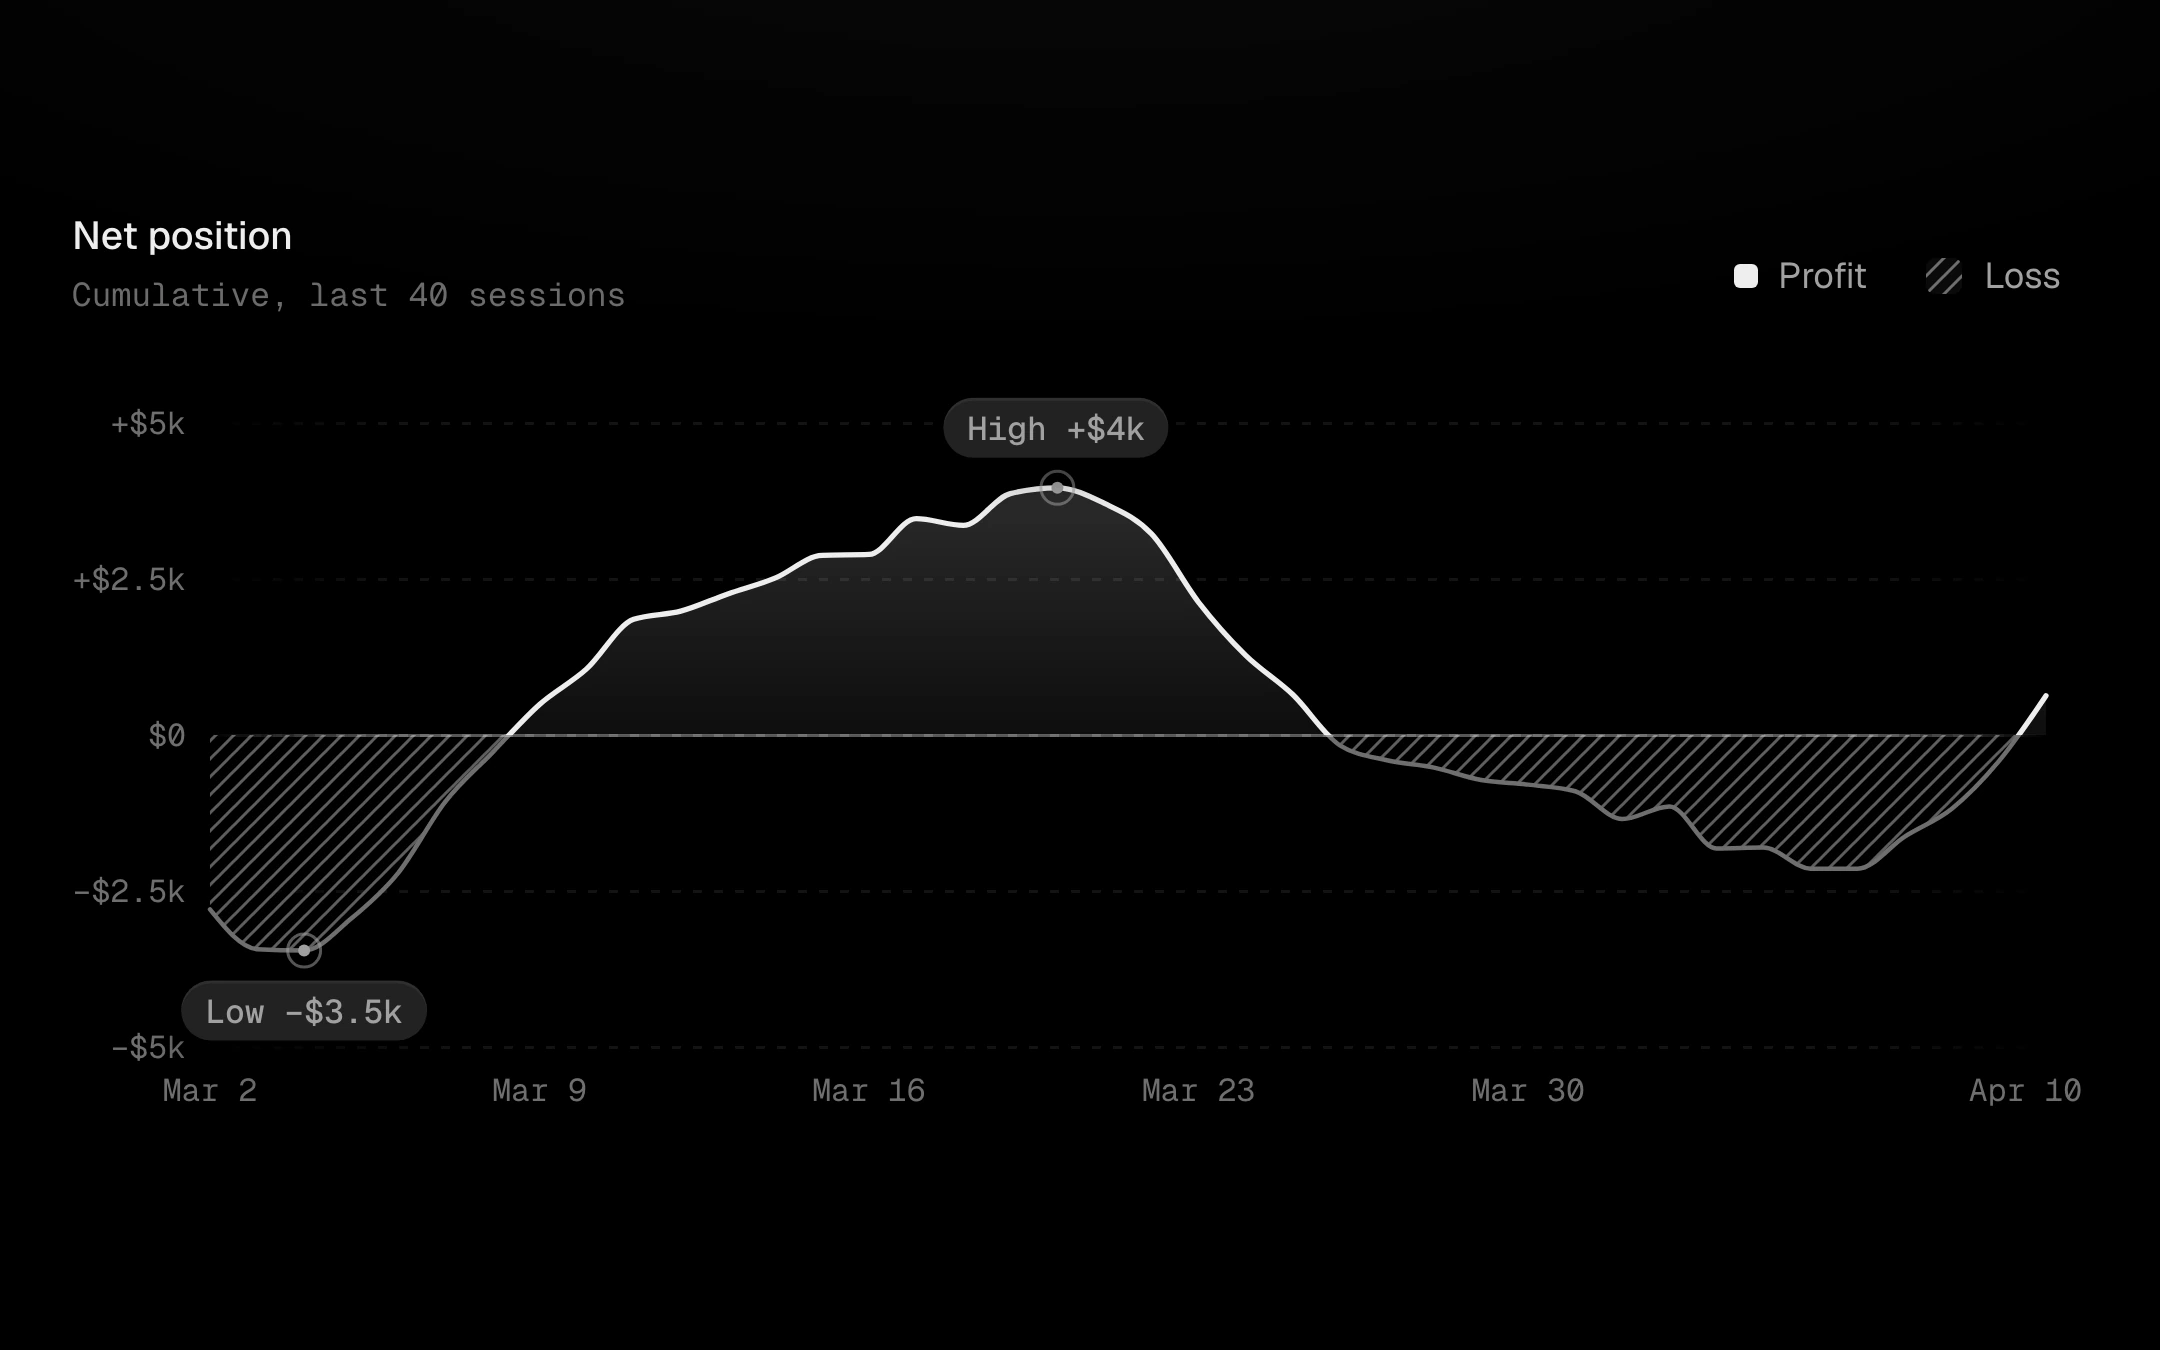
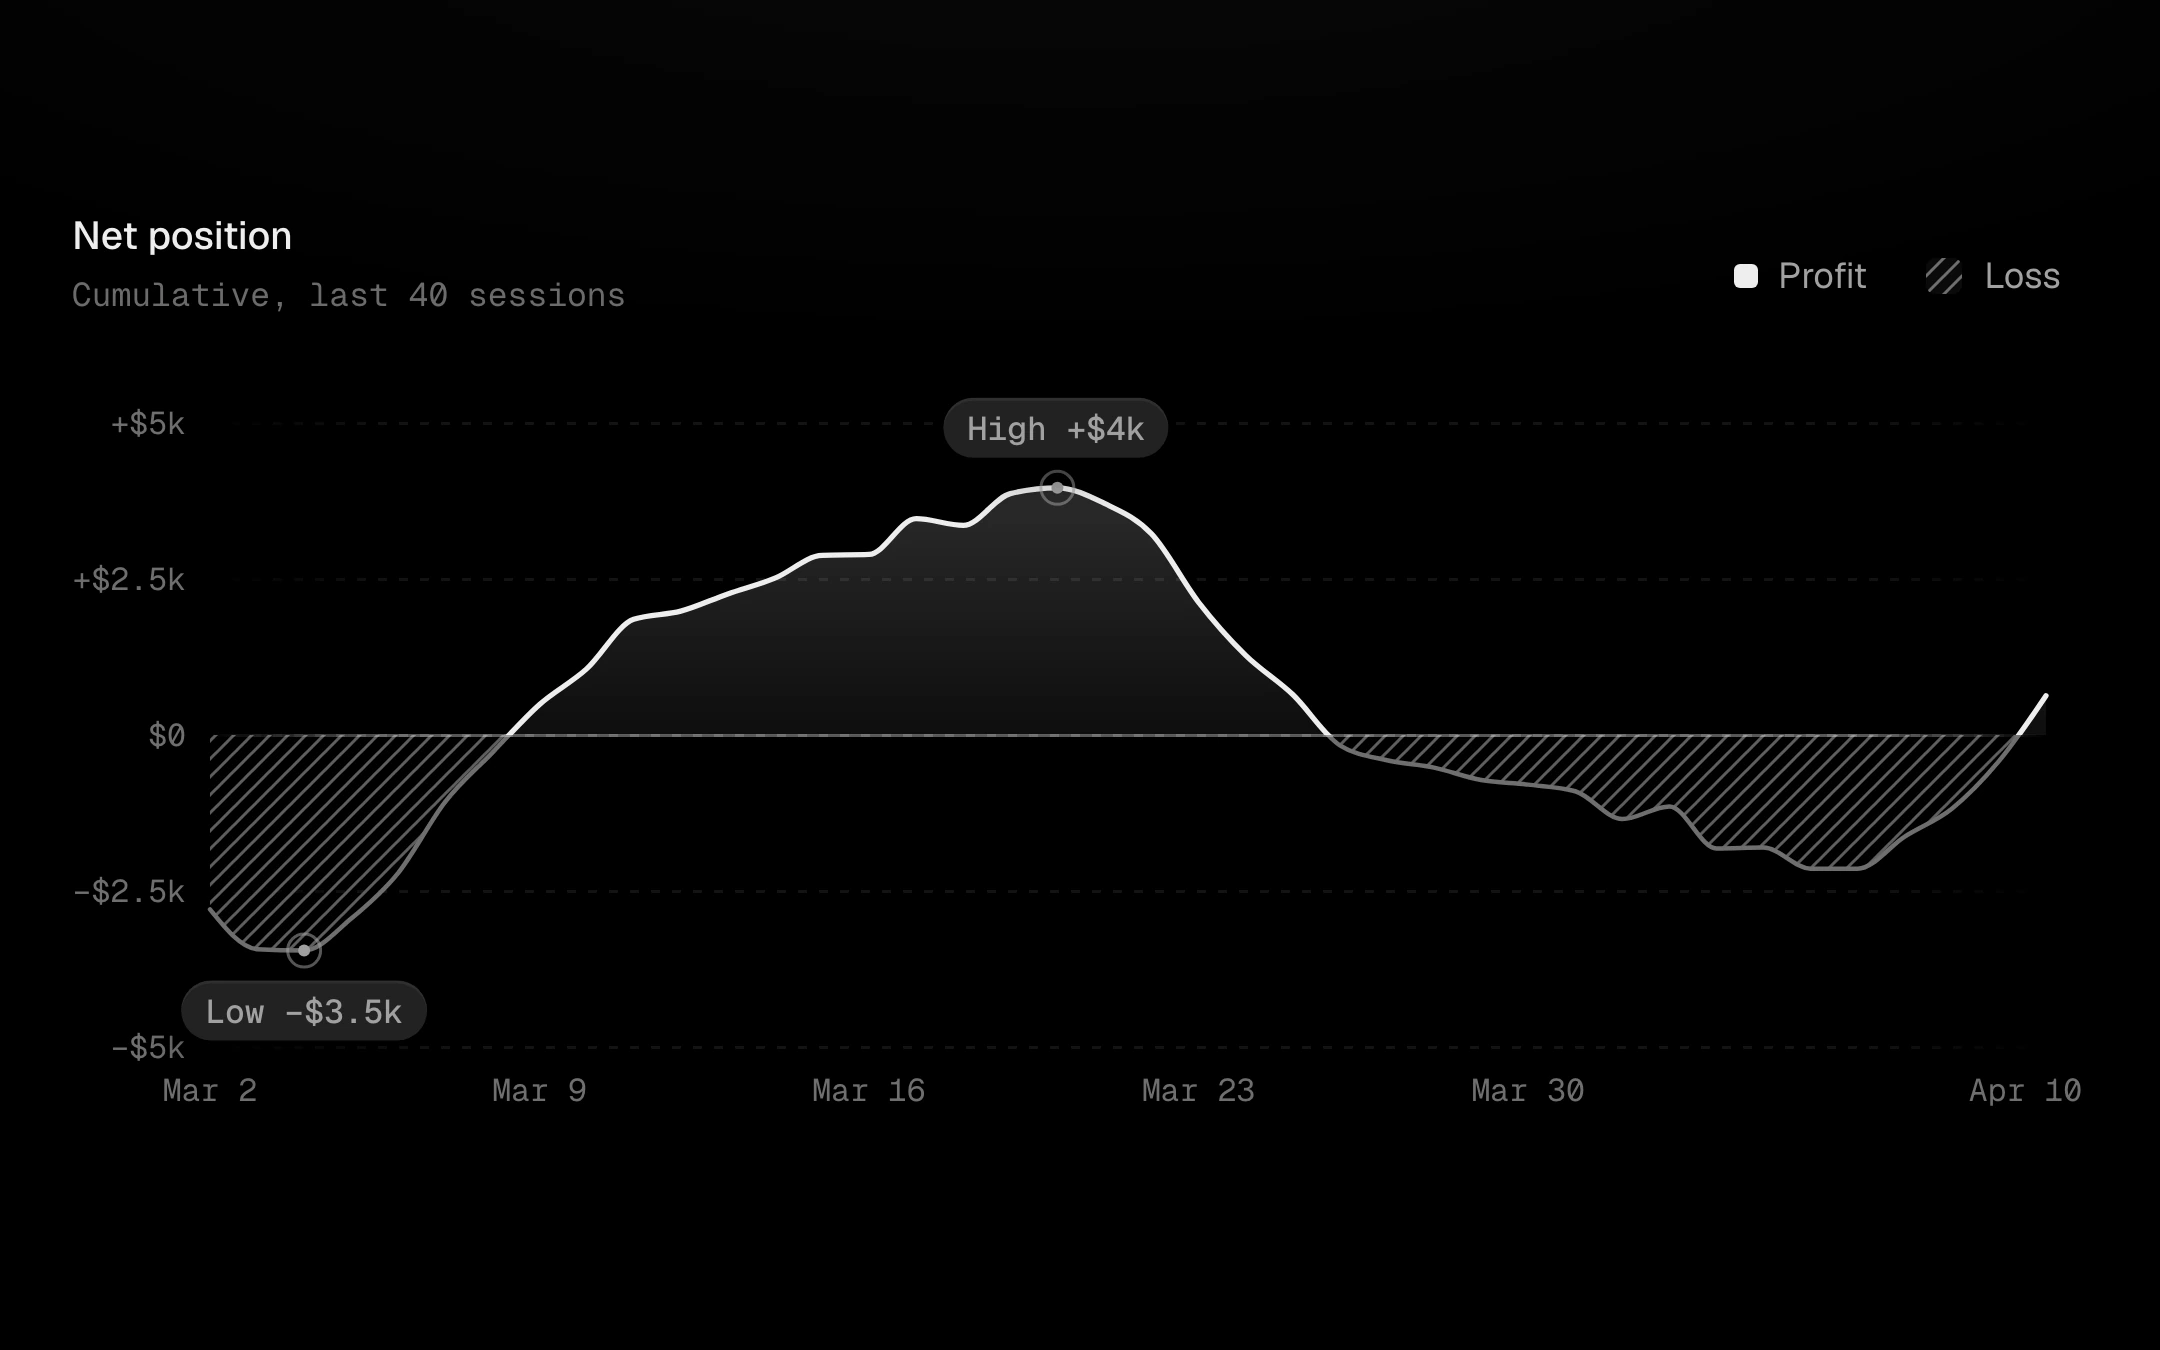
One line split exactly at zero.
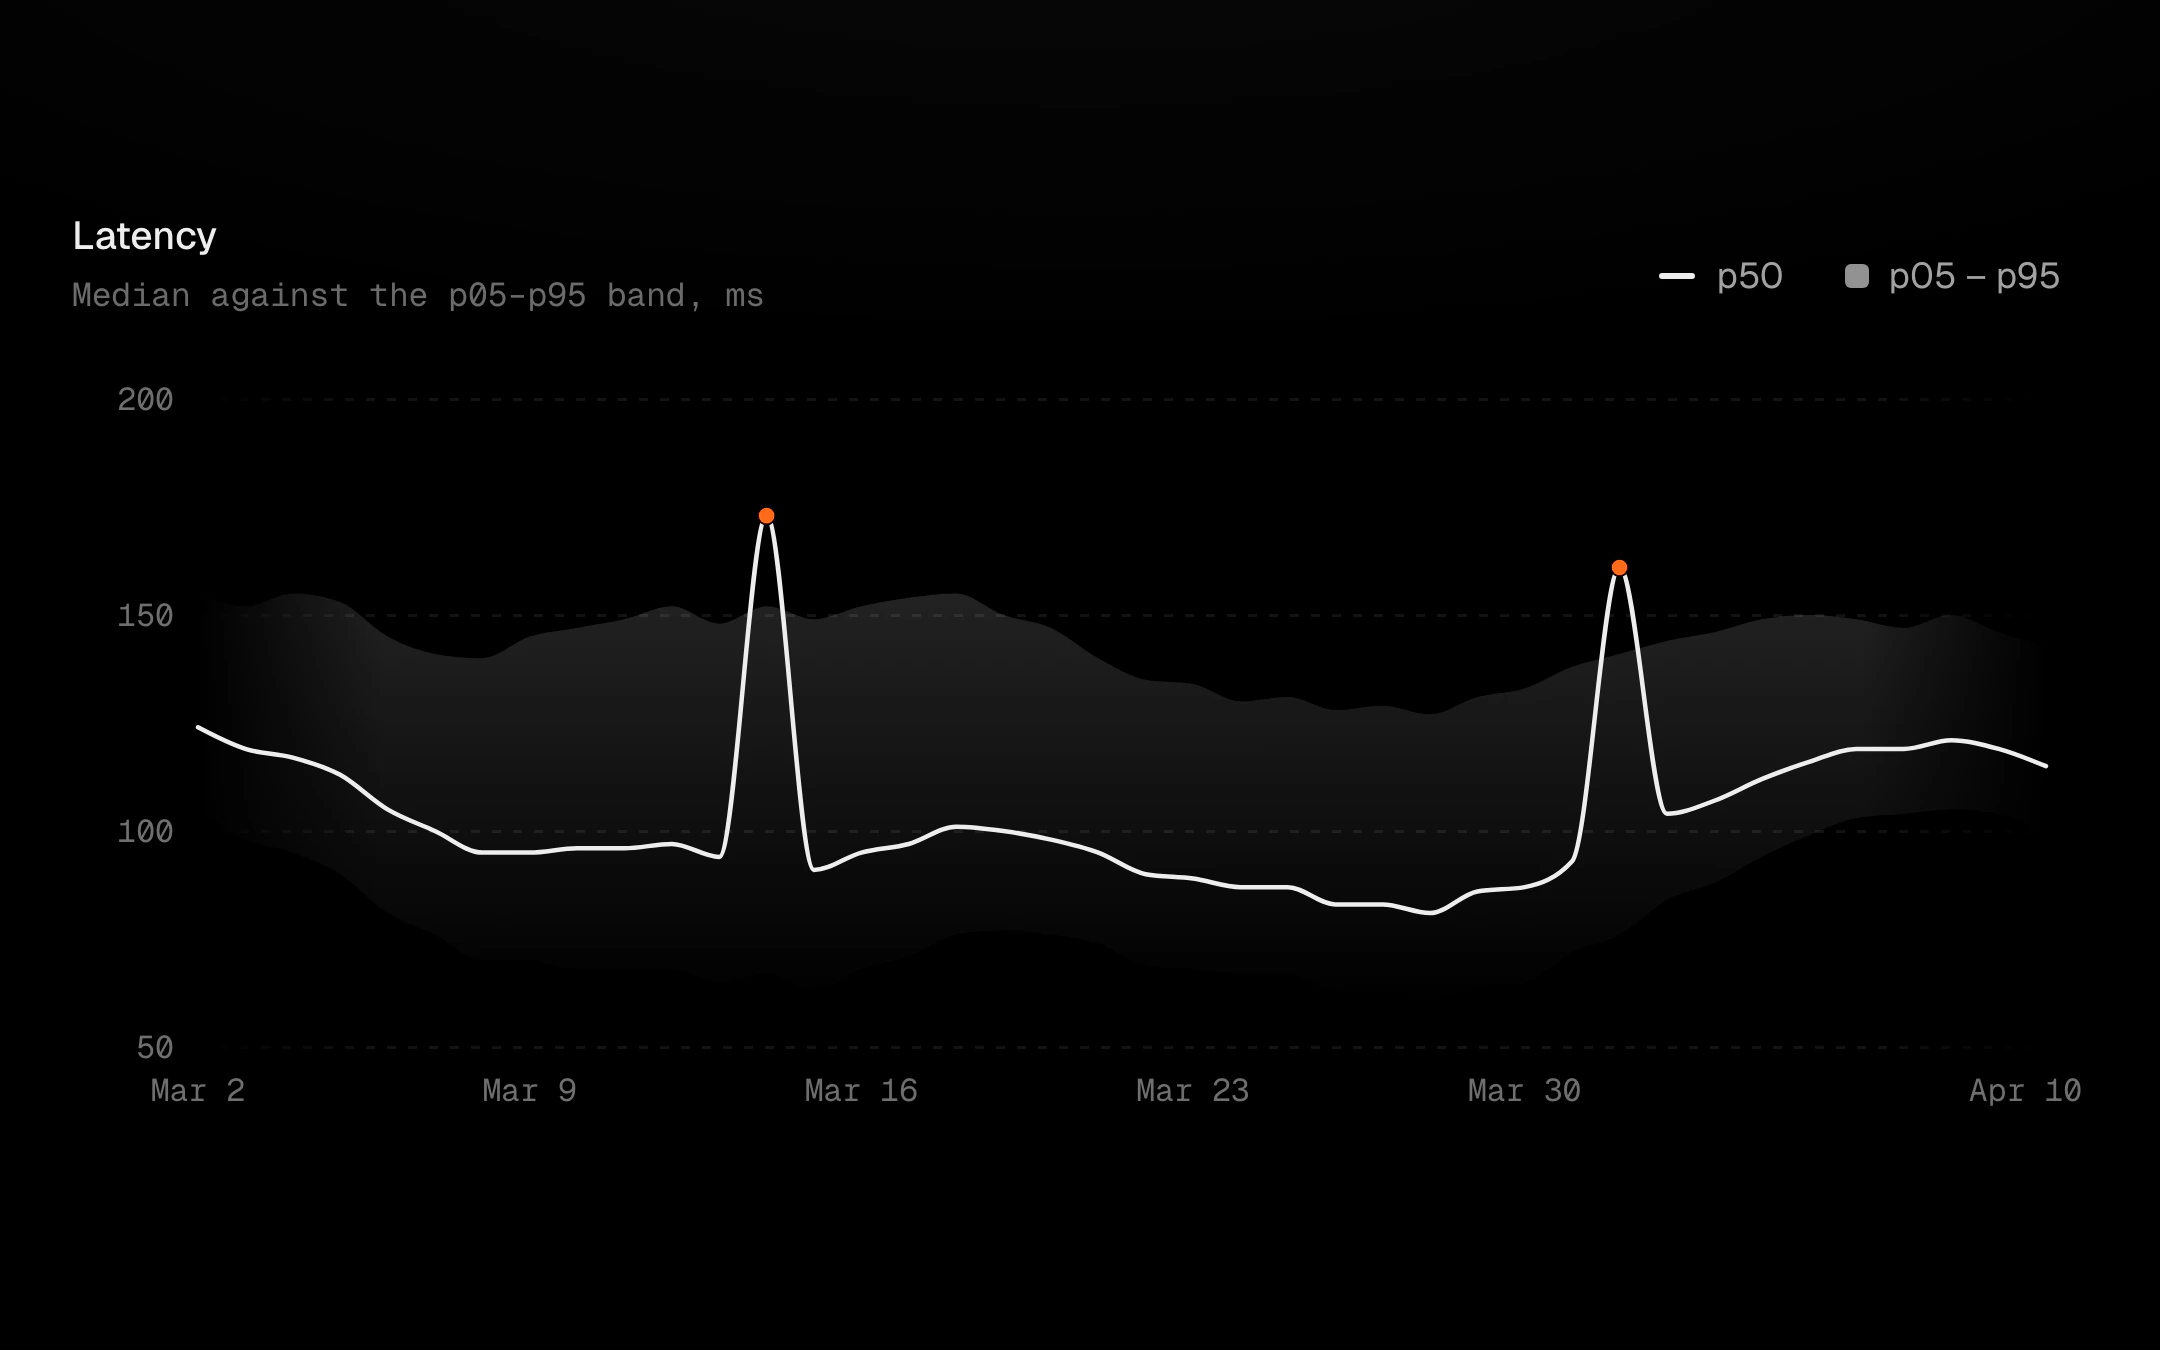
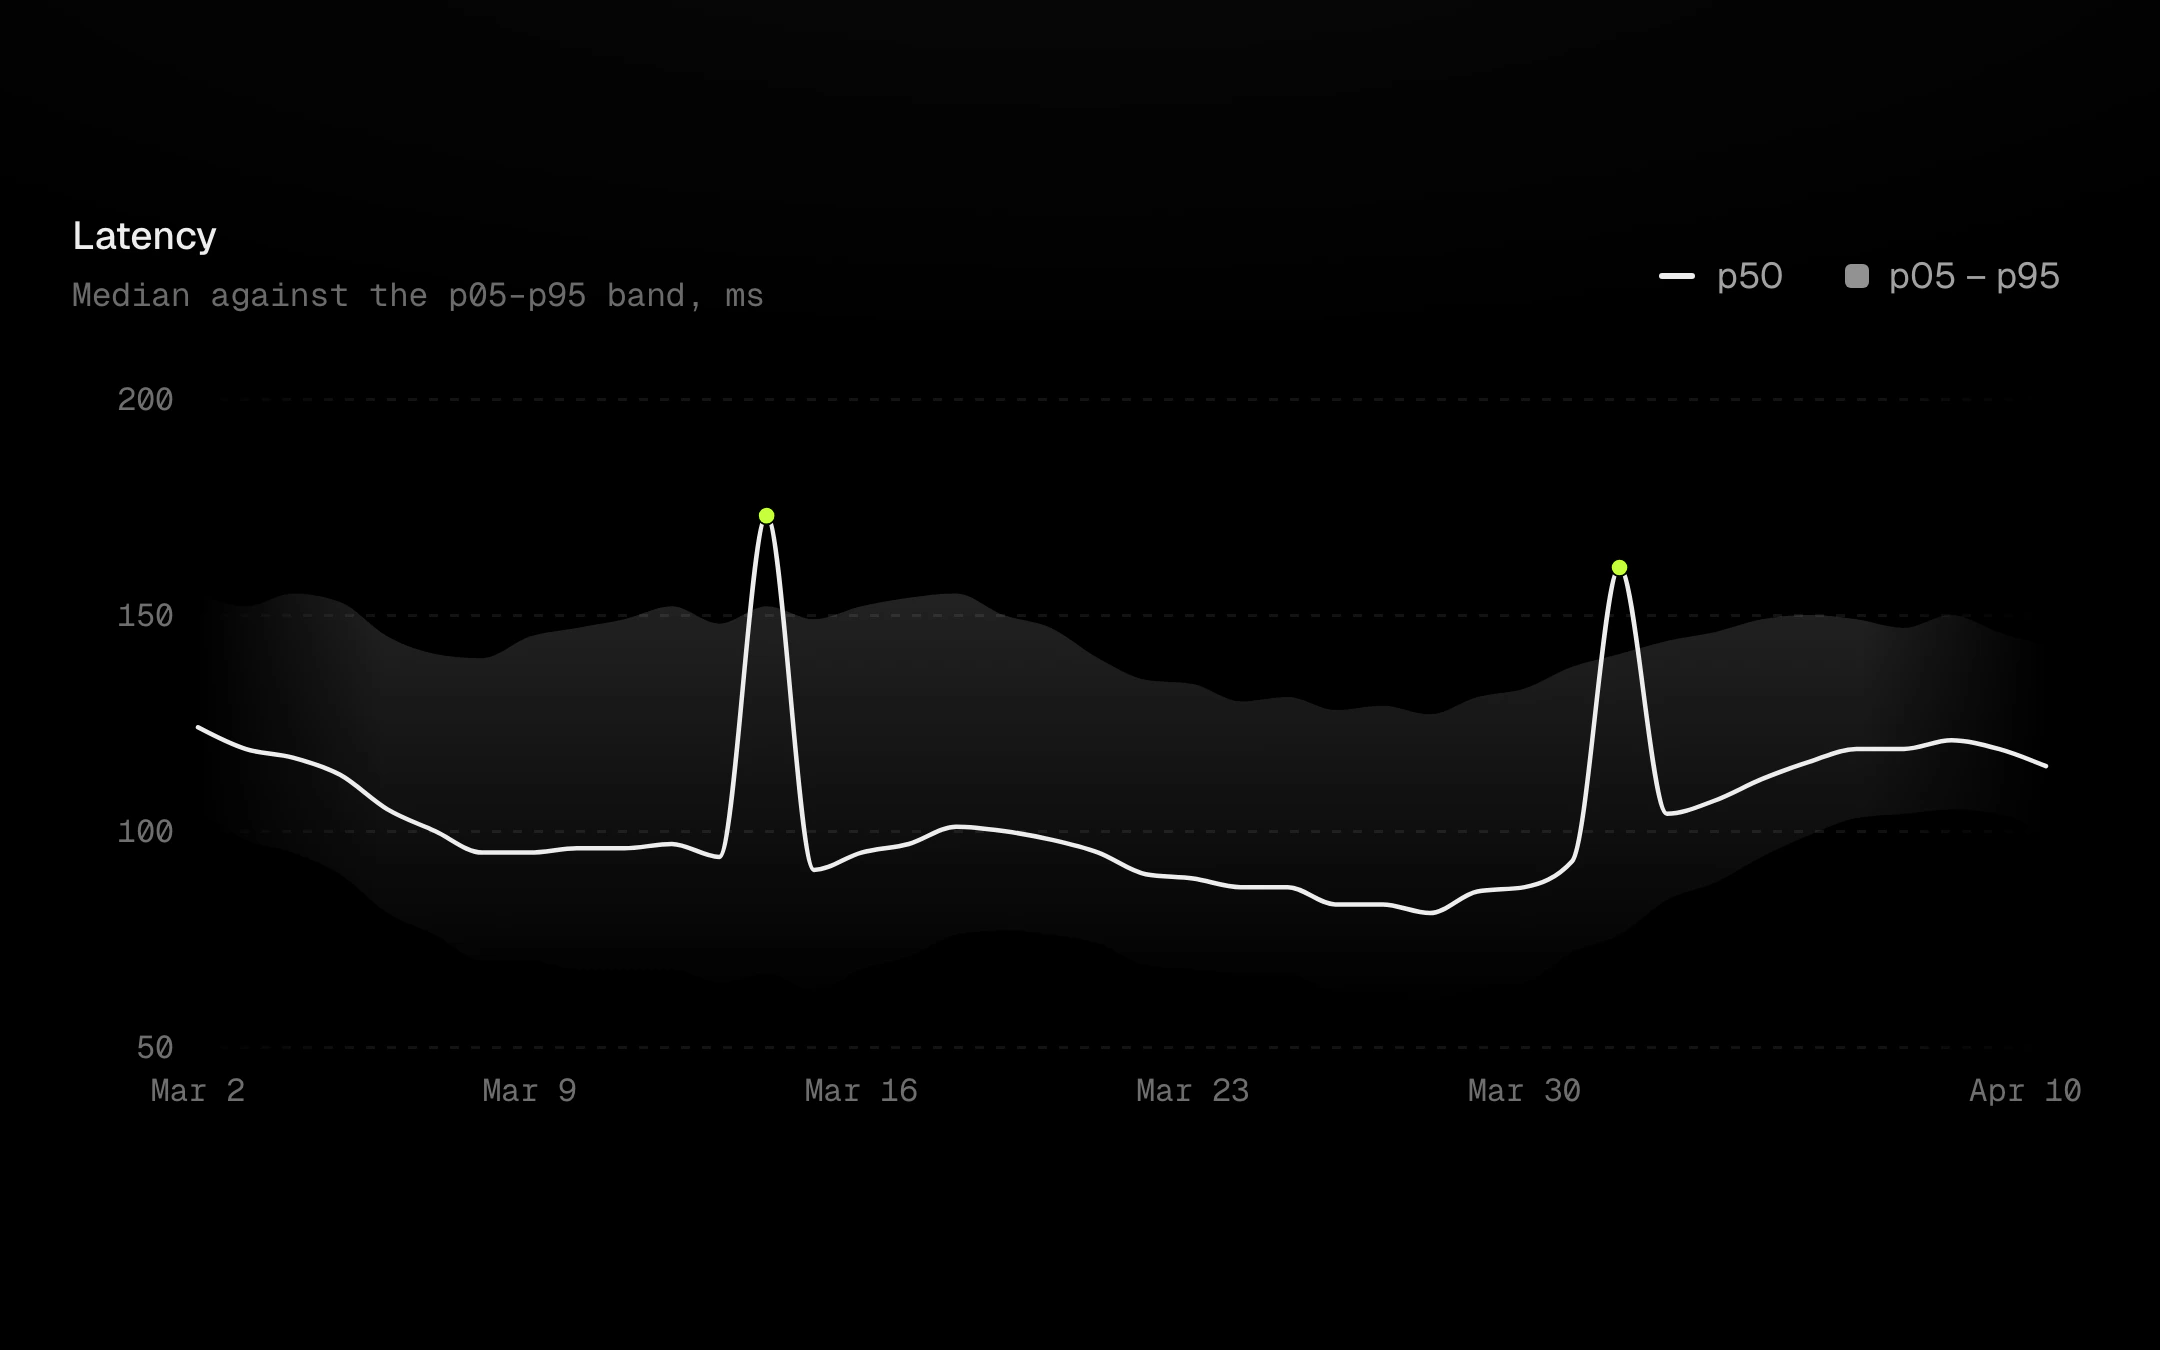
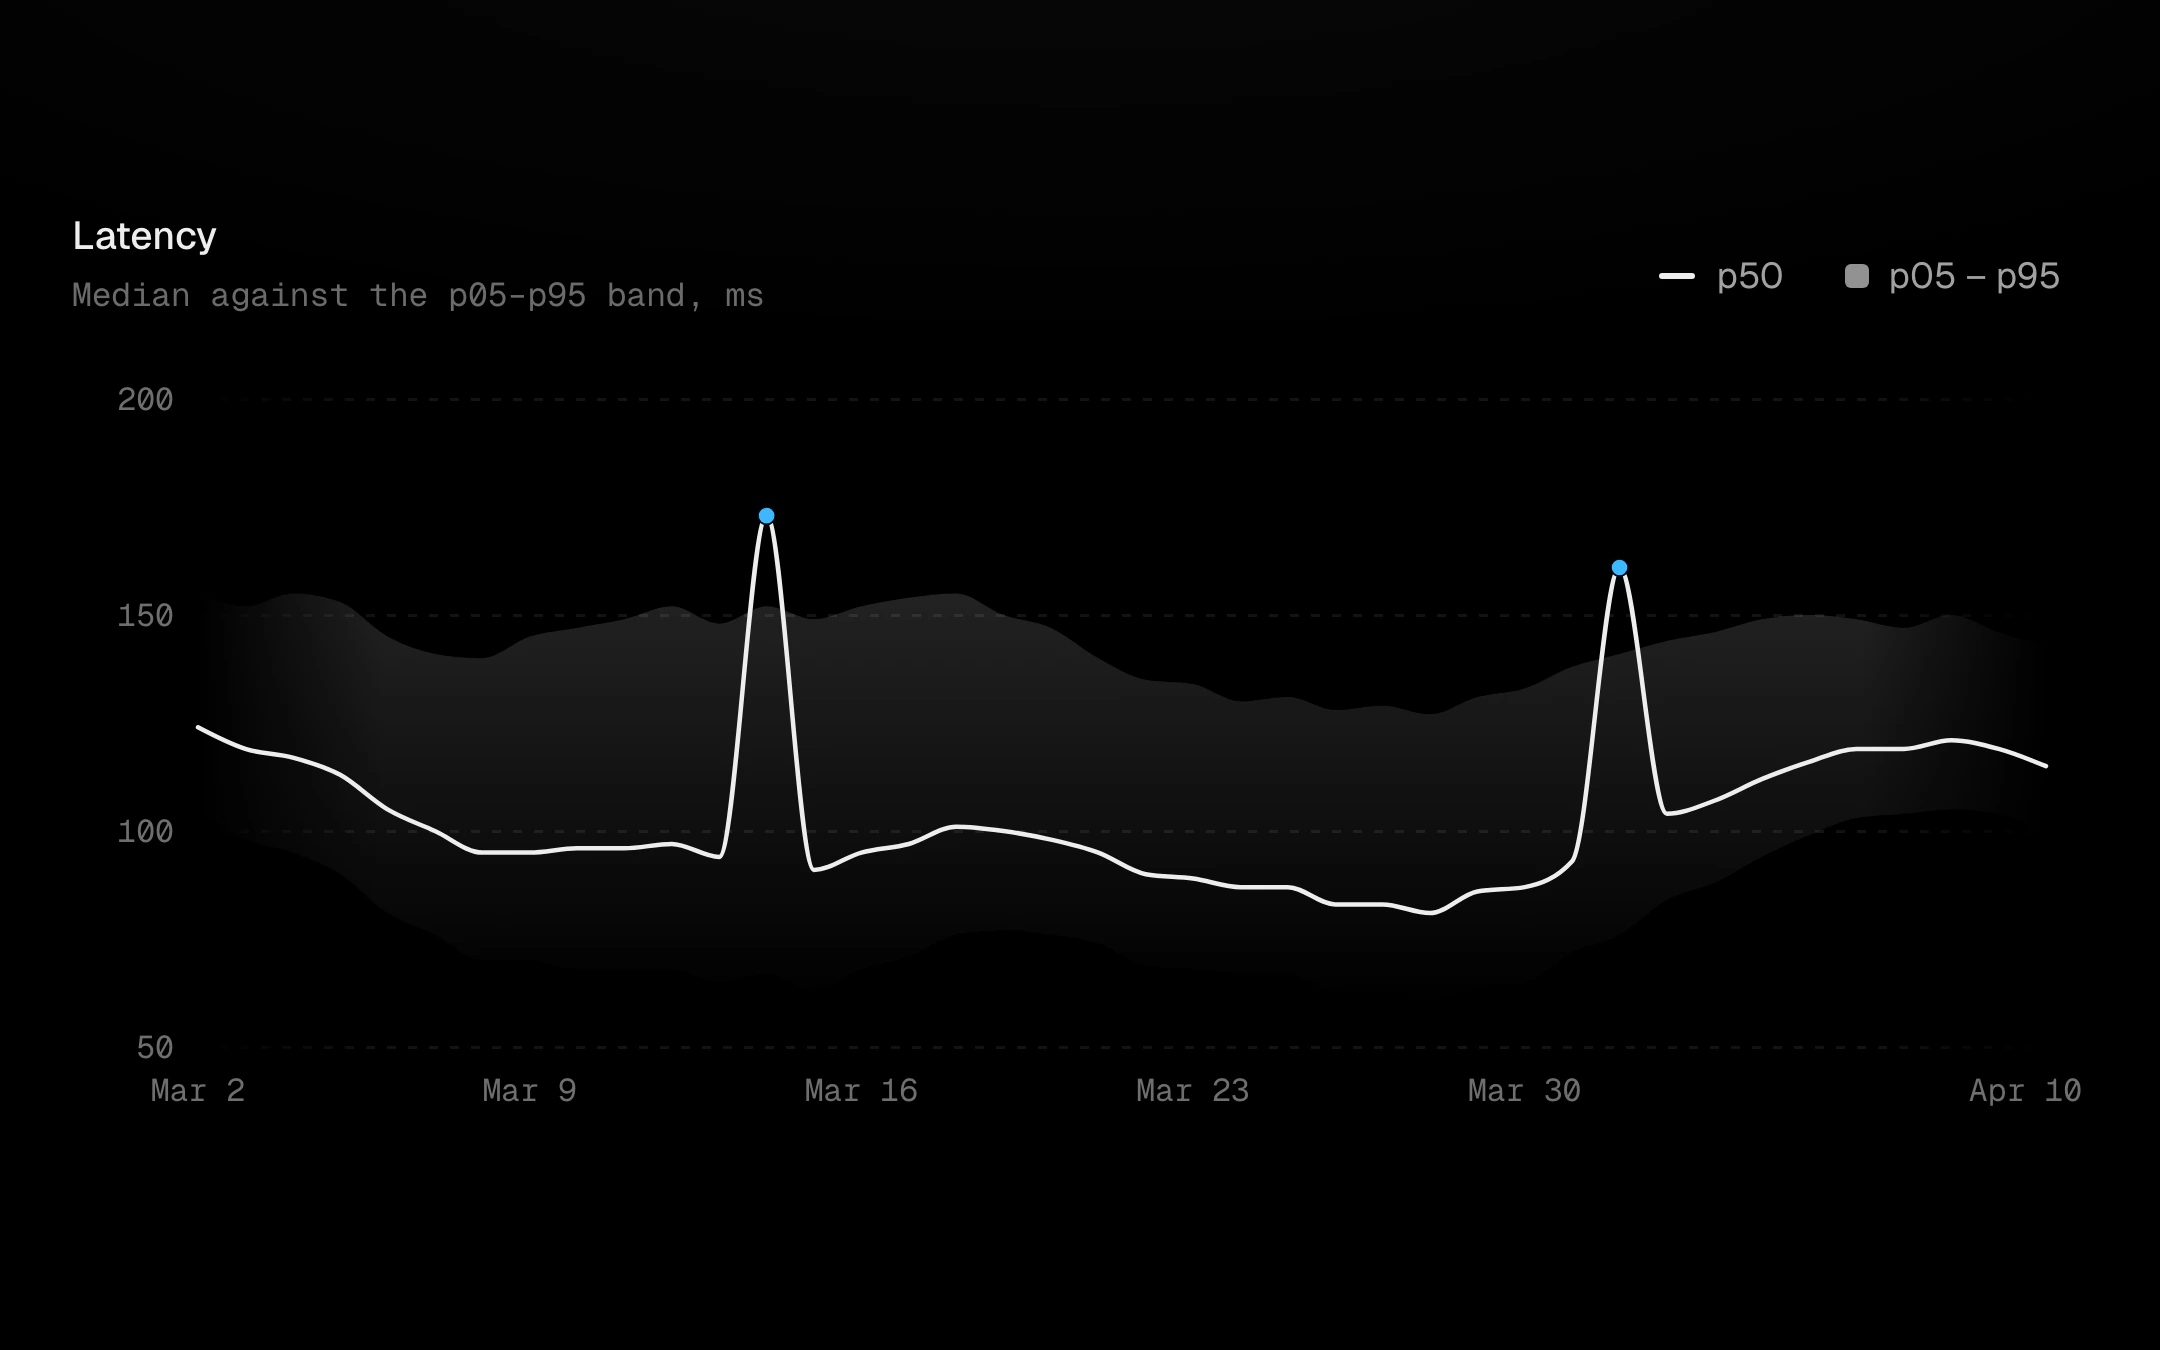
A line inside its envelope: min–max, a confidence interval, or Bollinger bands (a moving average ± kσ).
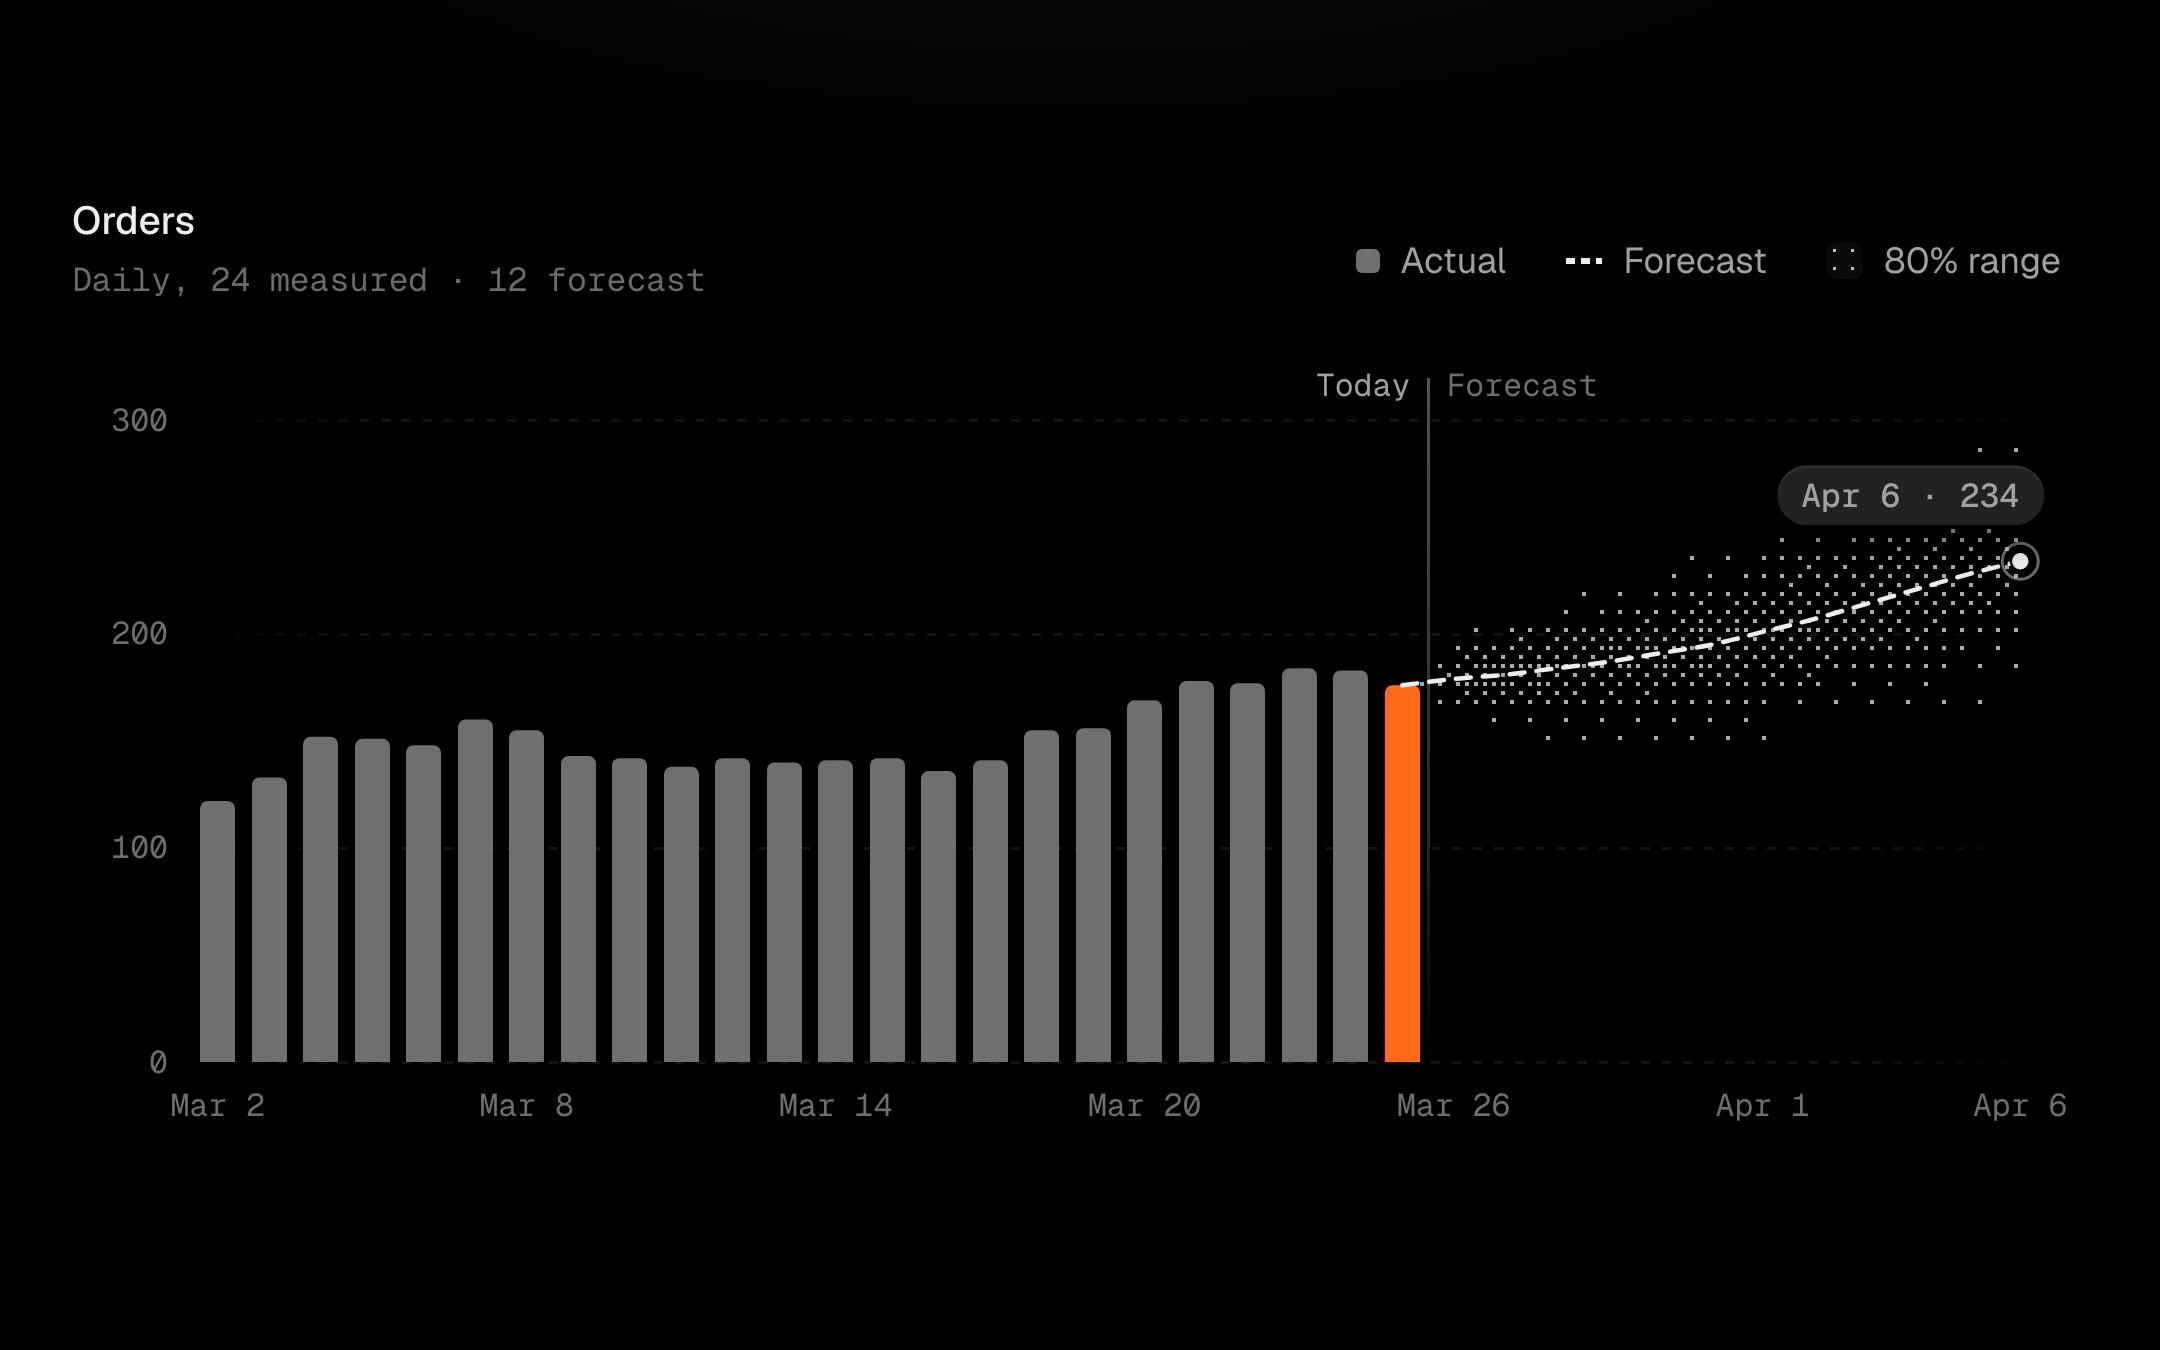
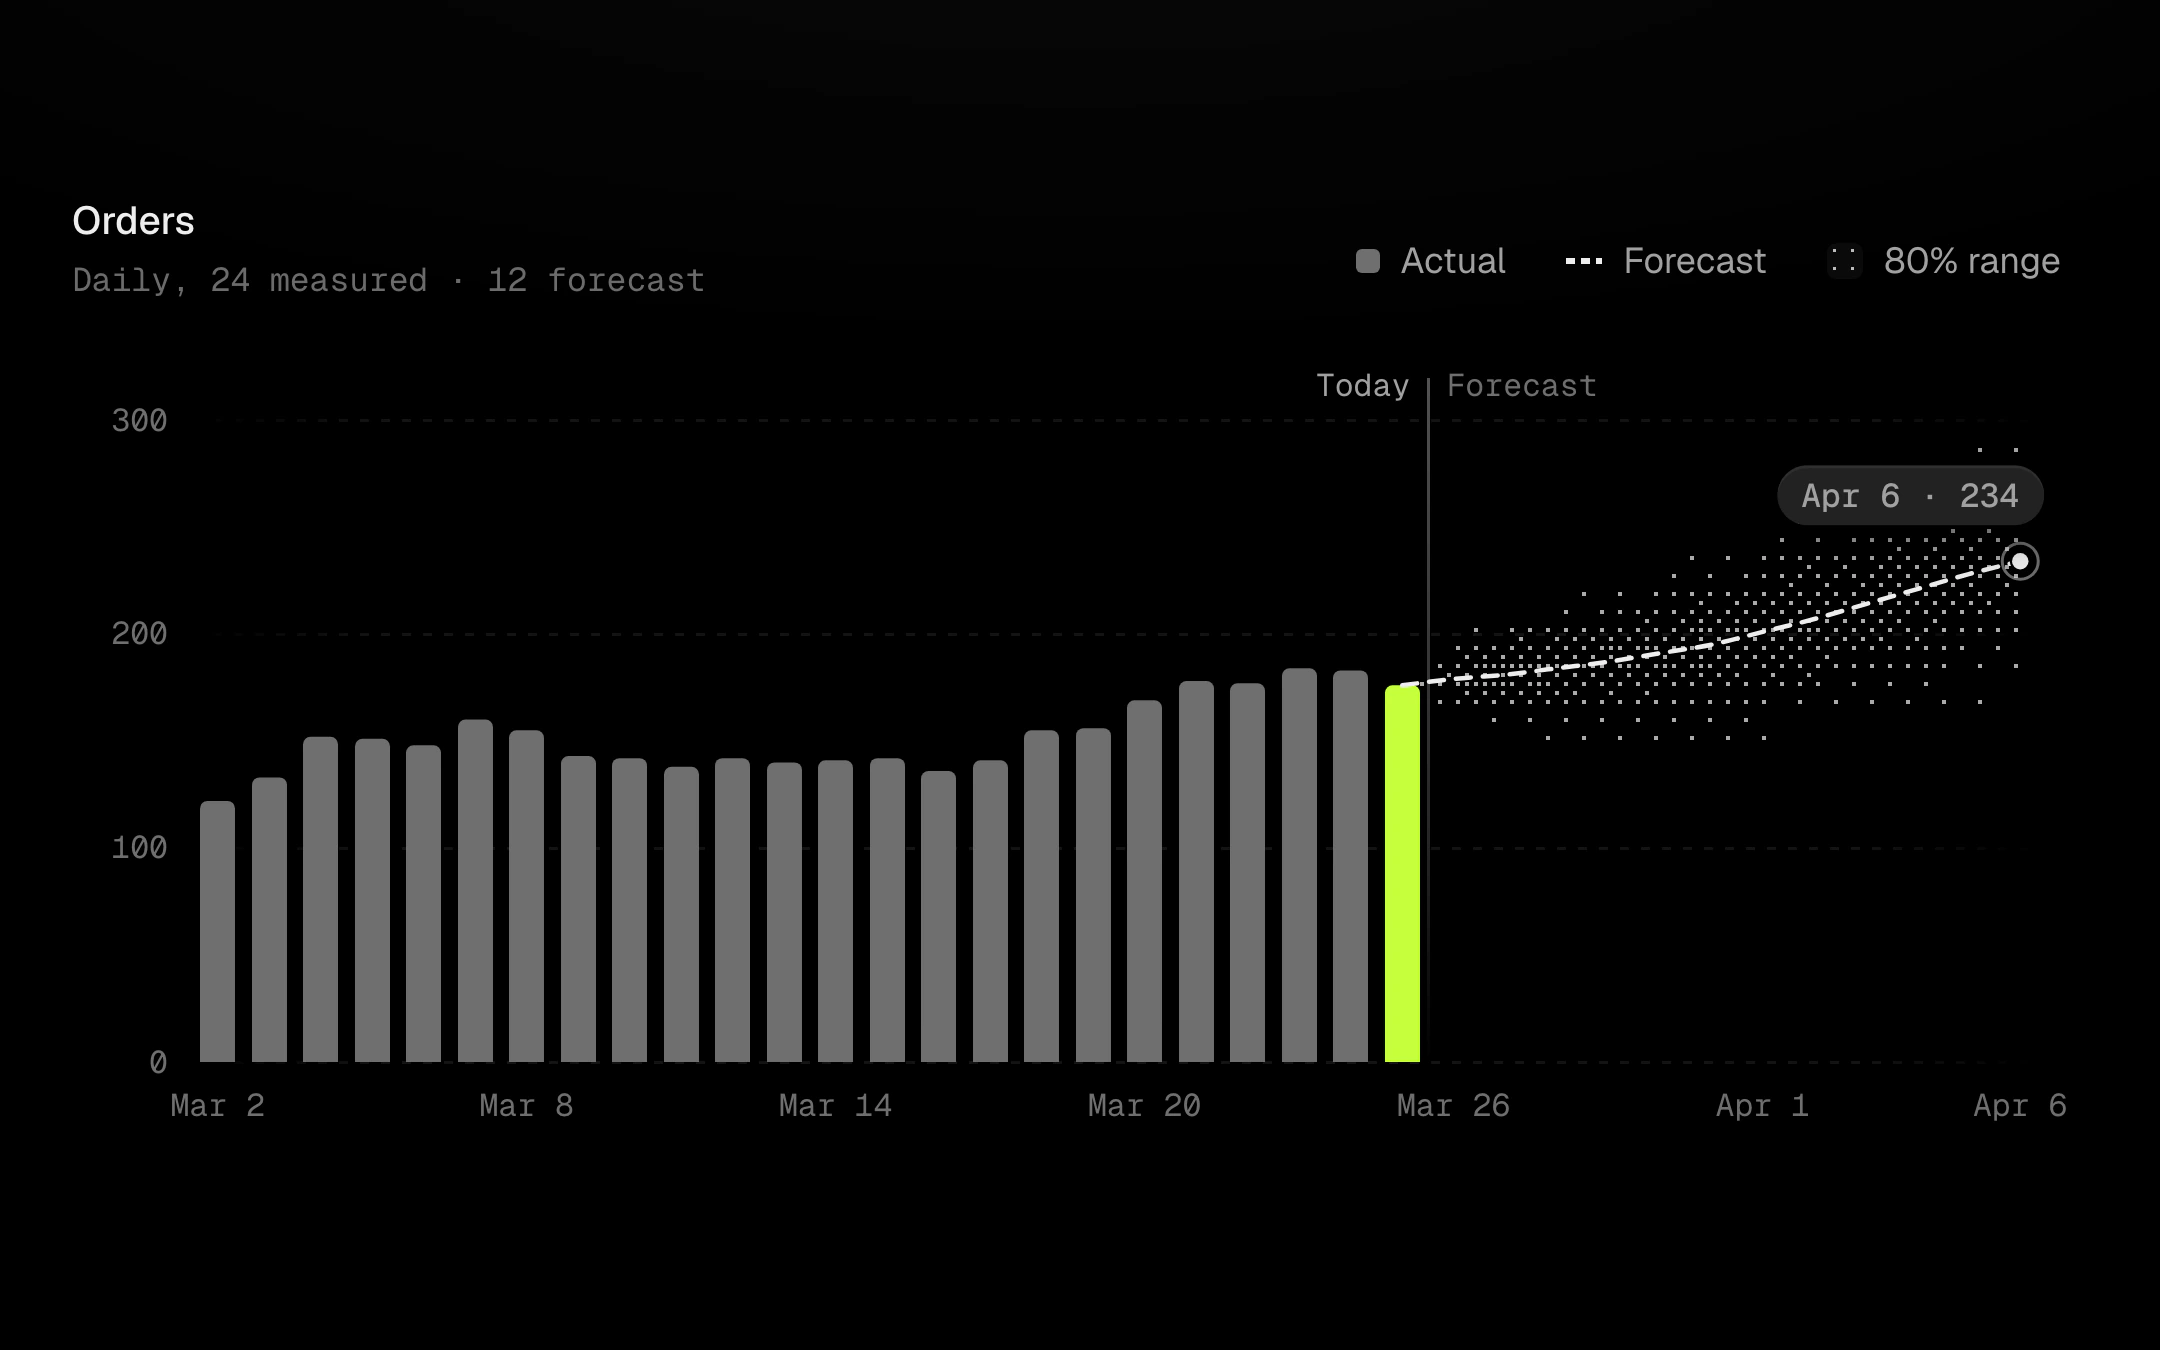
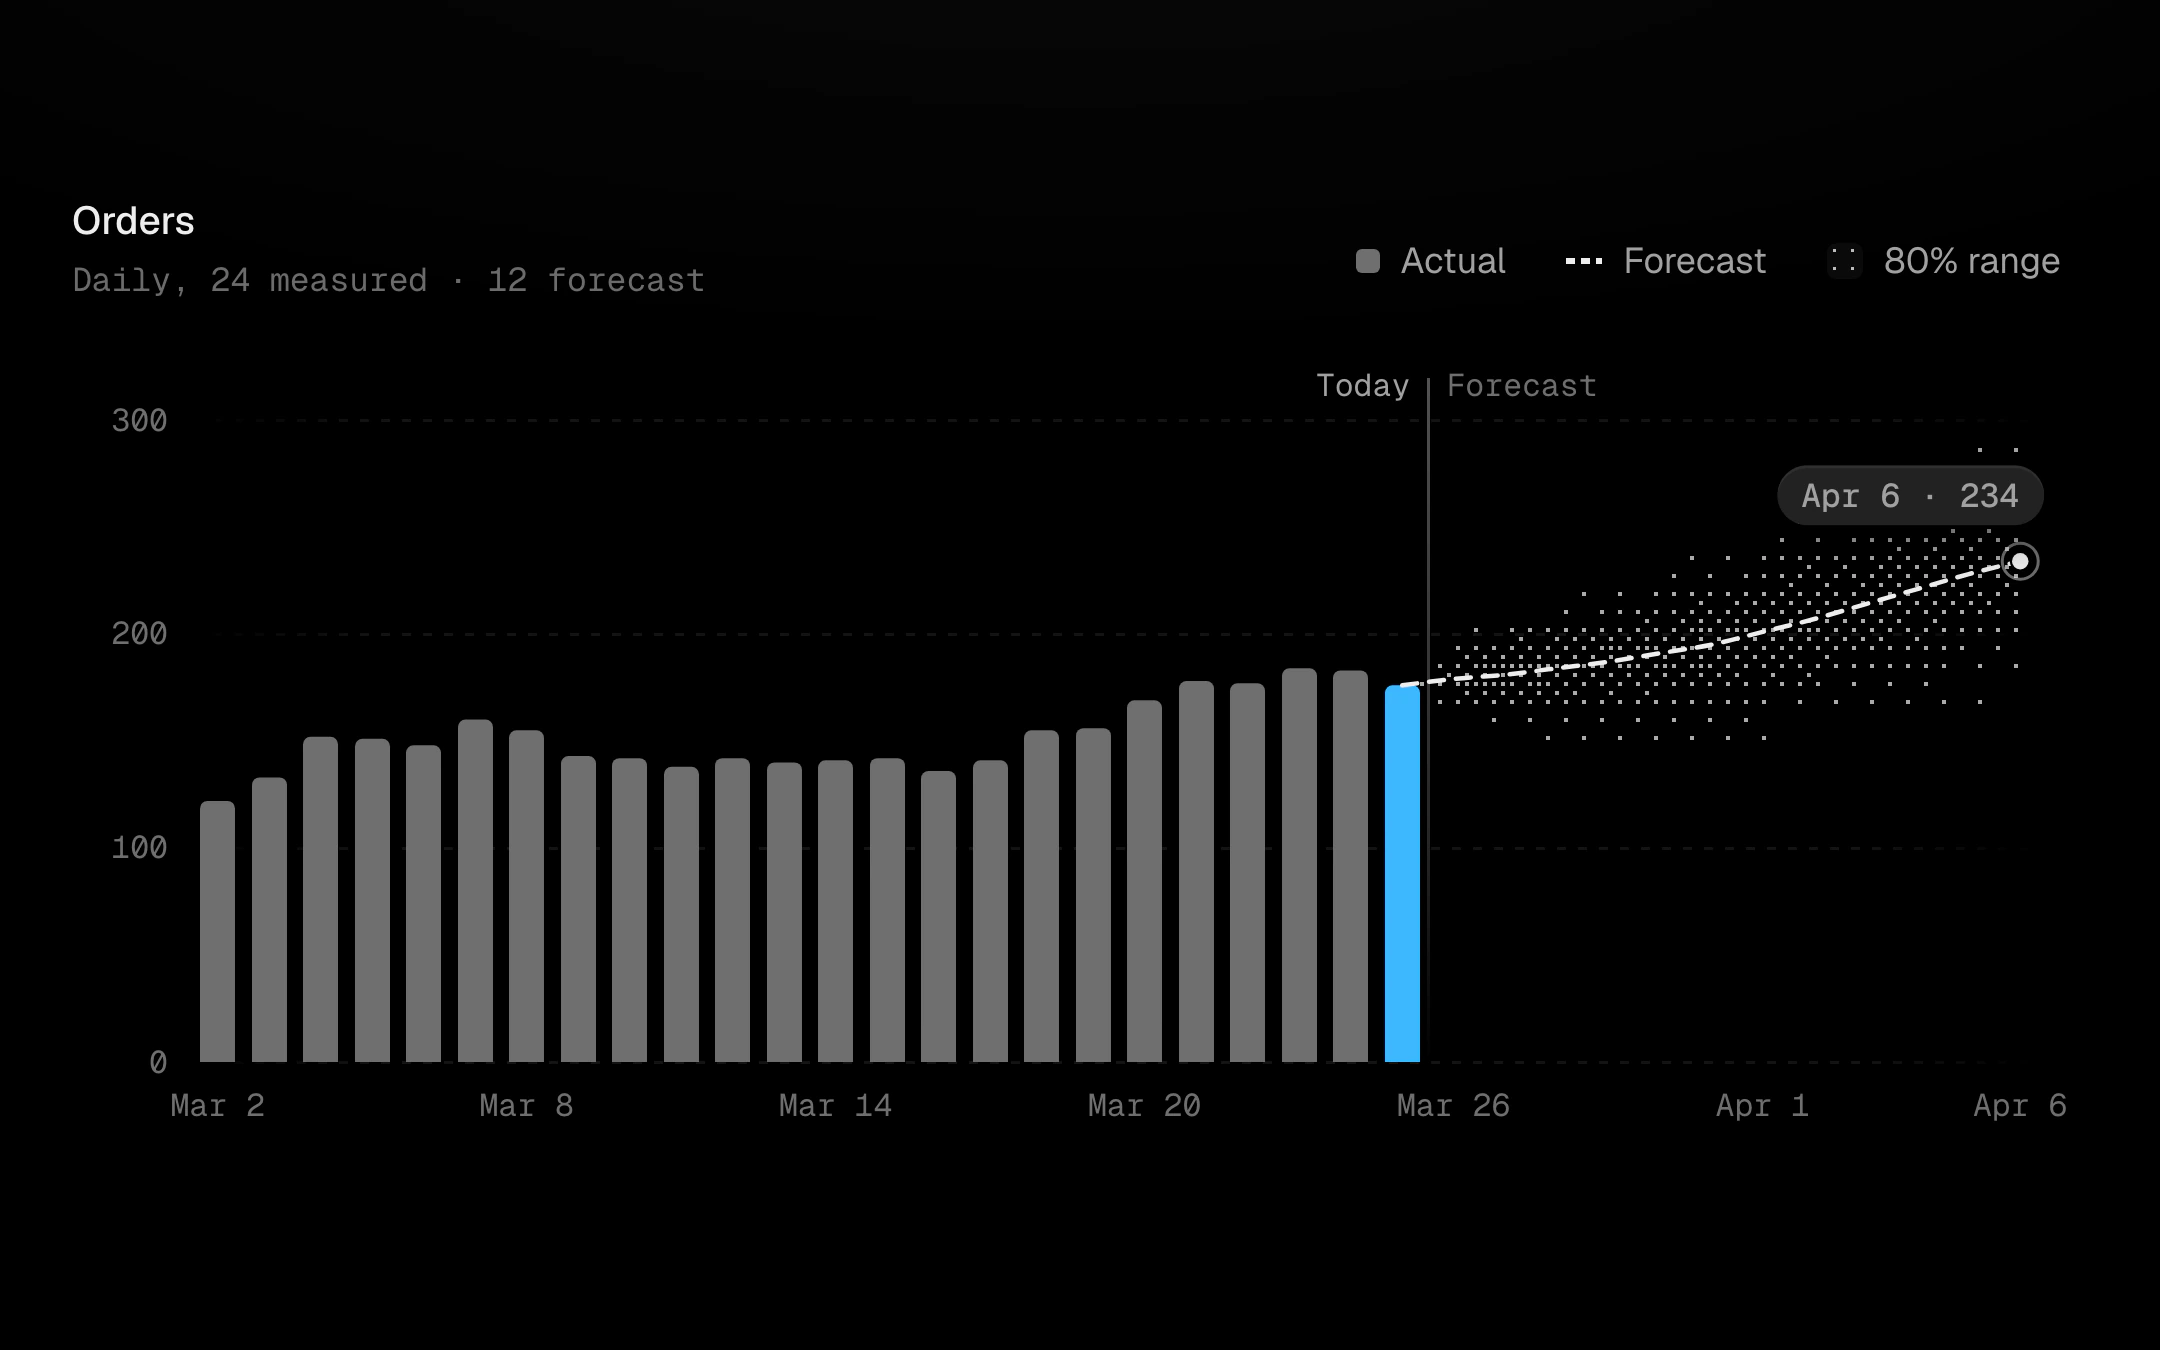
Measured bars hand off to a dashed forecast at a "today" divider.
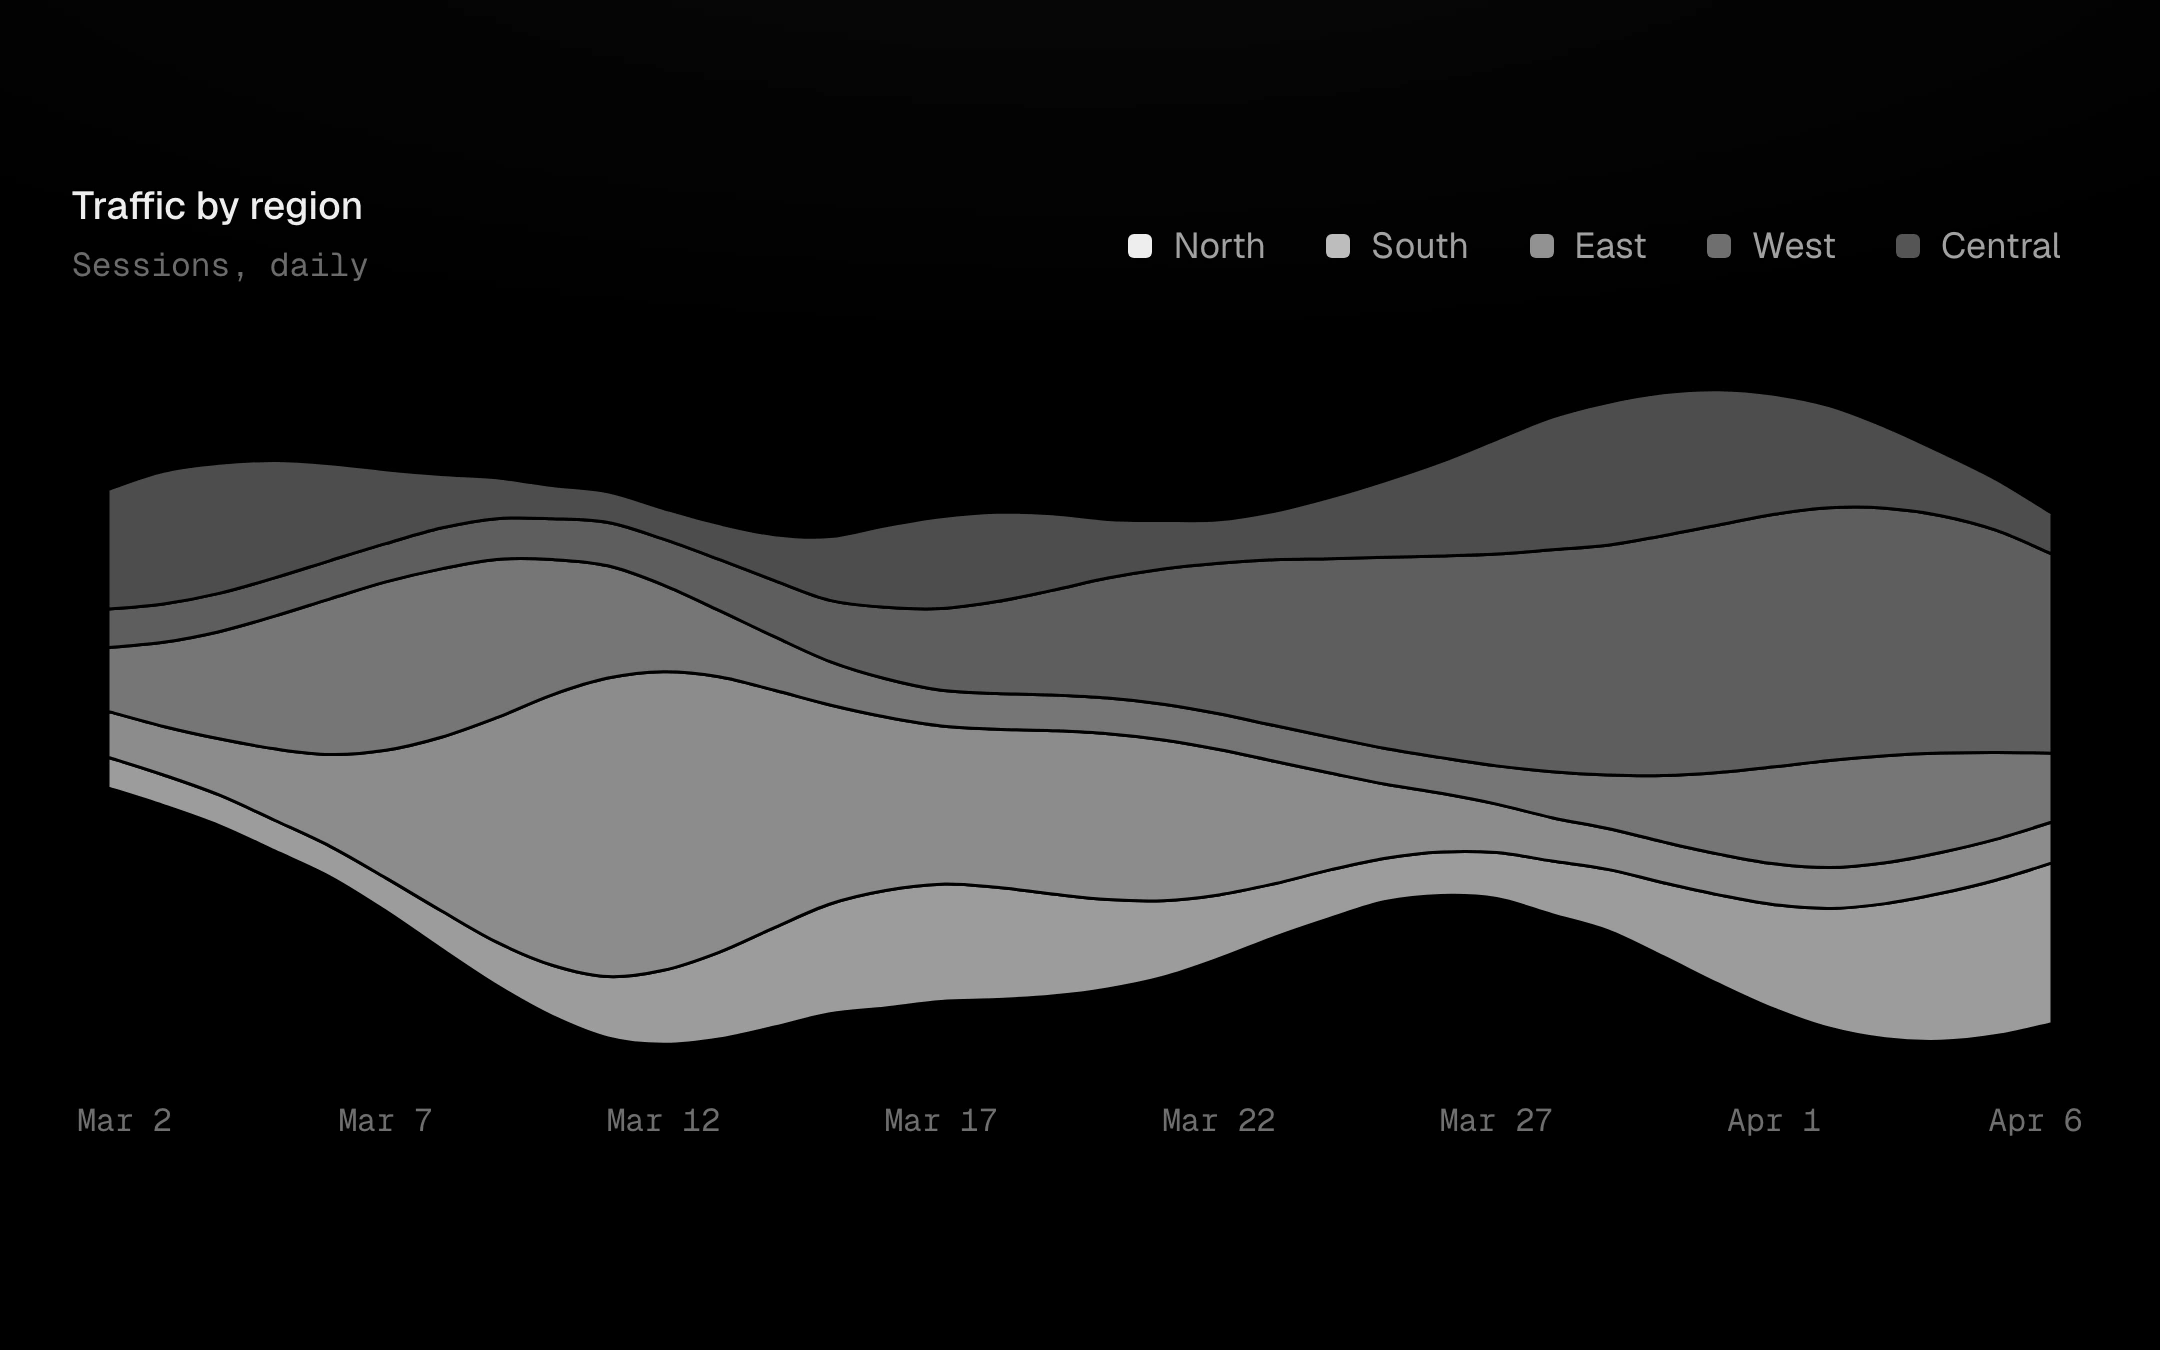
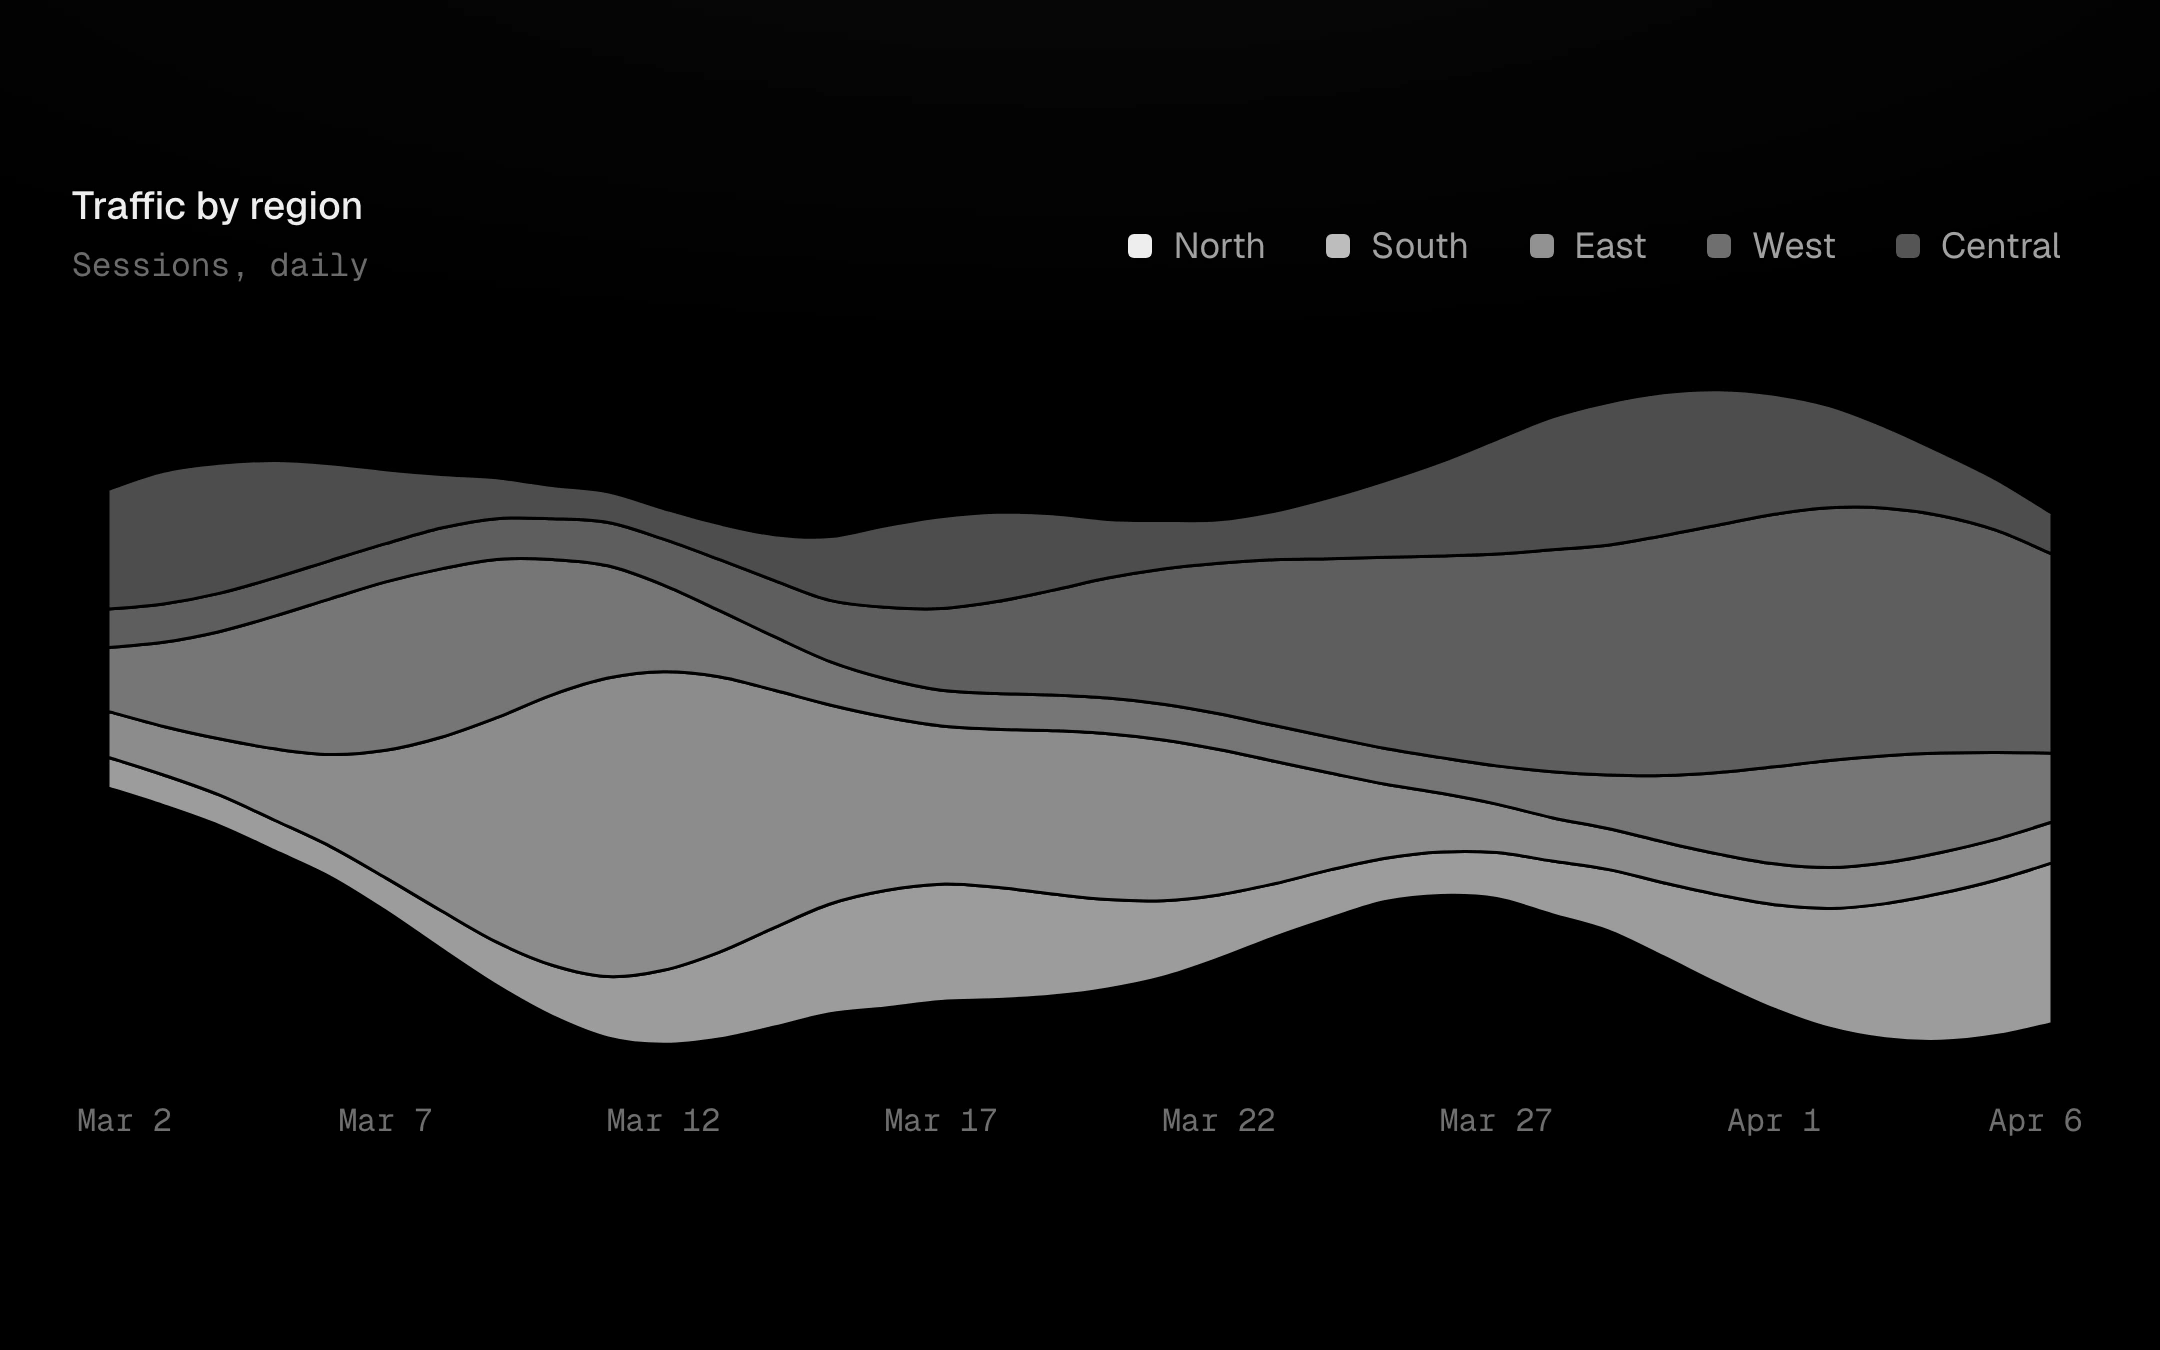
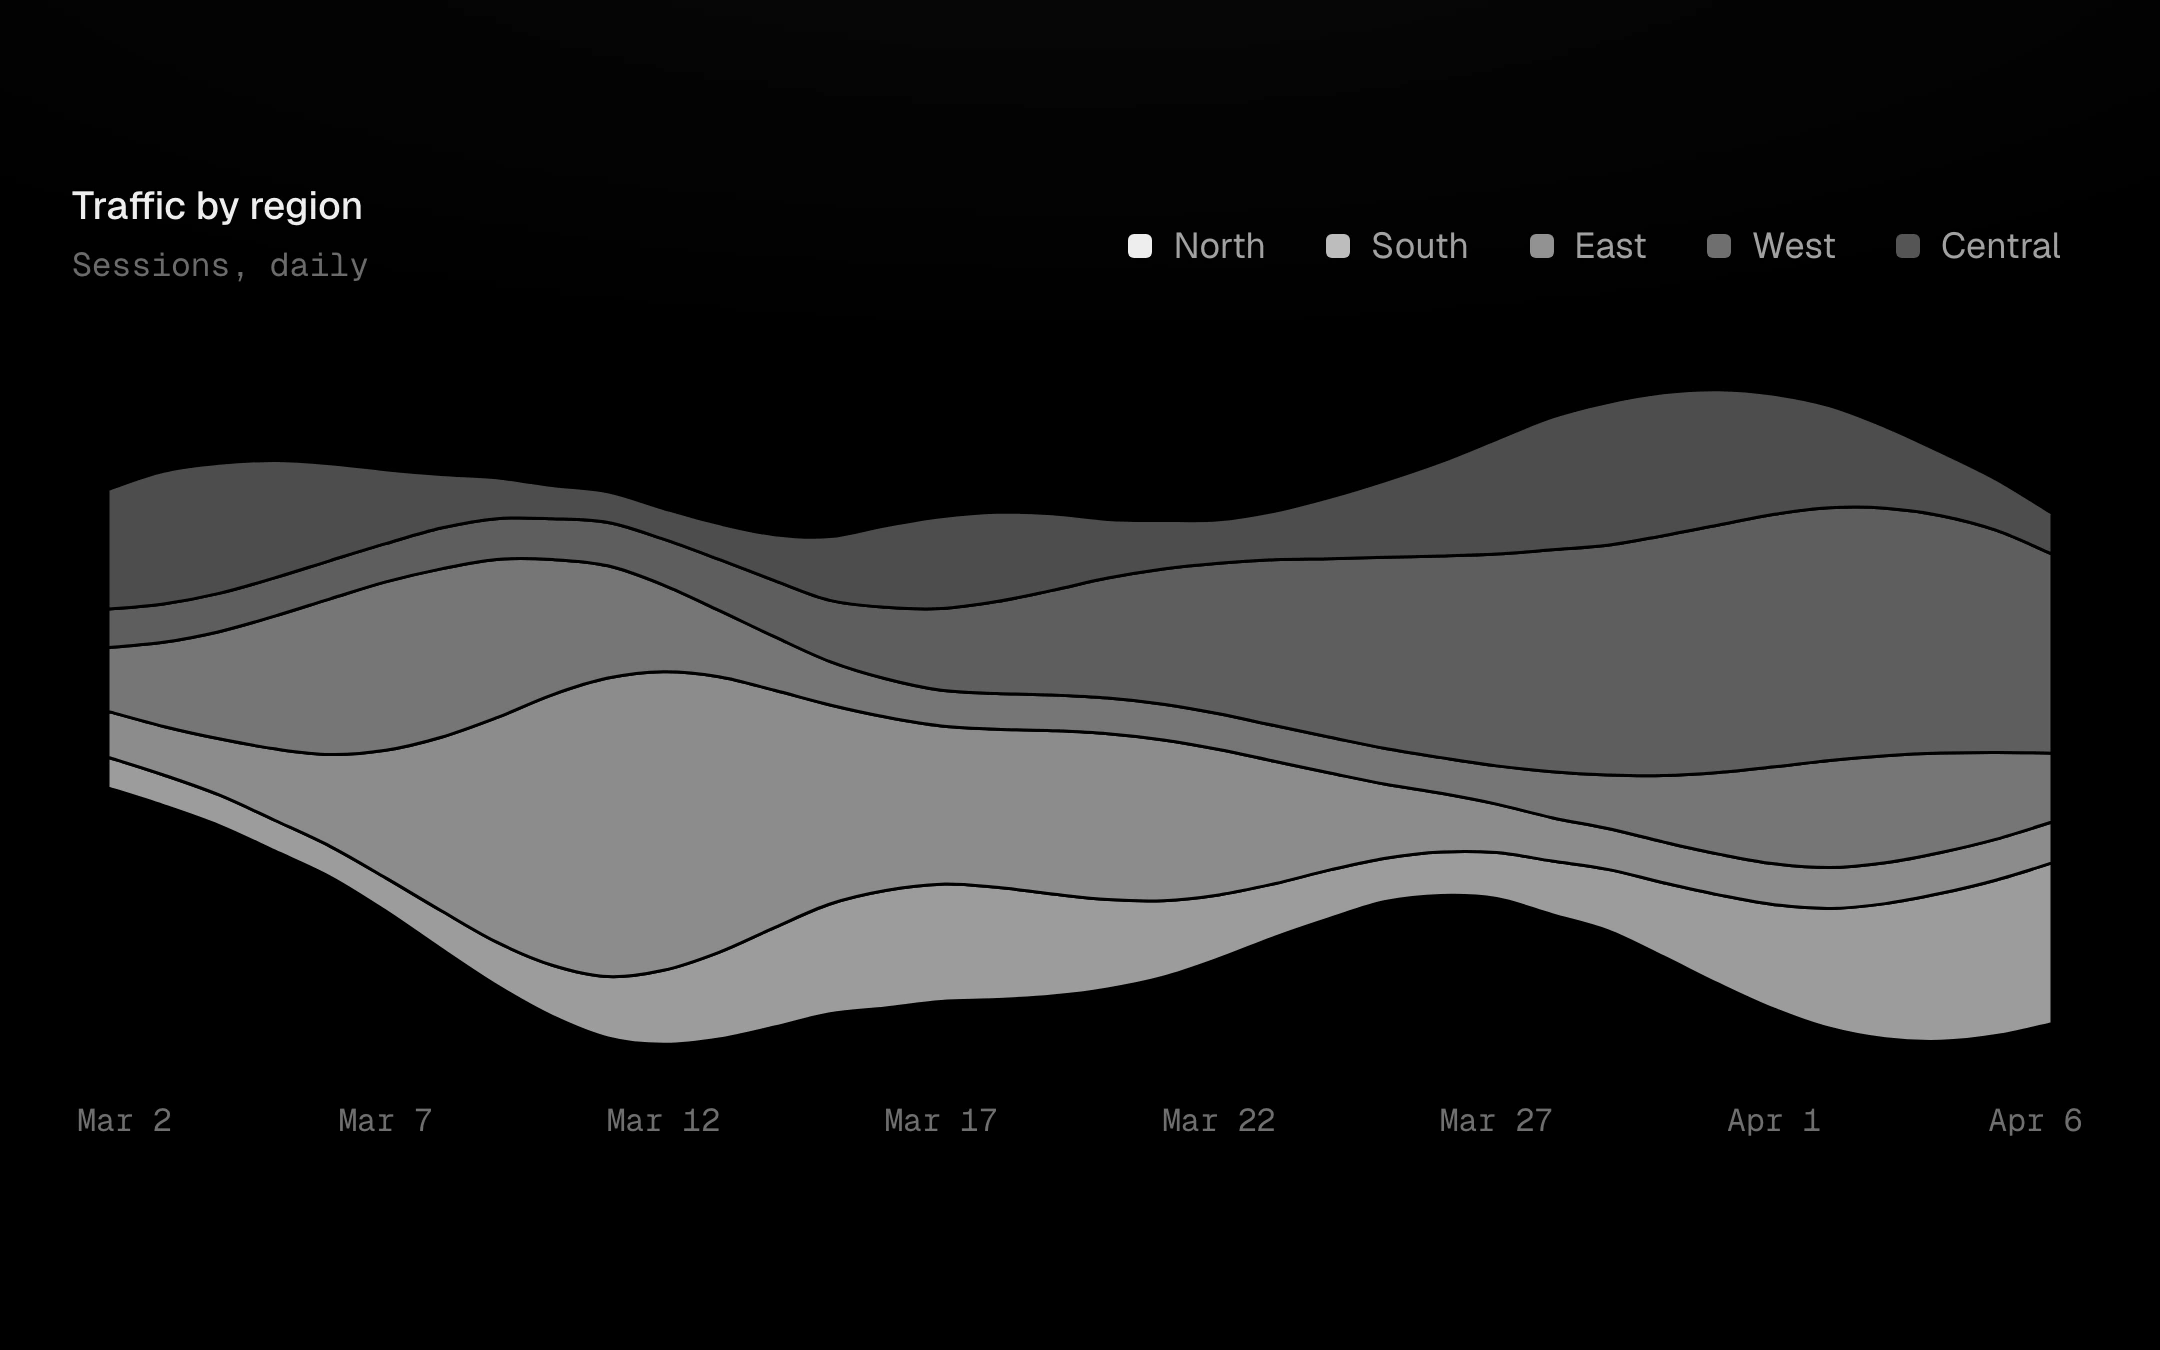
Smooth stacked streams around a moving centre (wiggle), a symmetric silhouette, a zero baseline or shares of 100%.
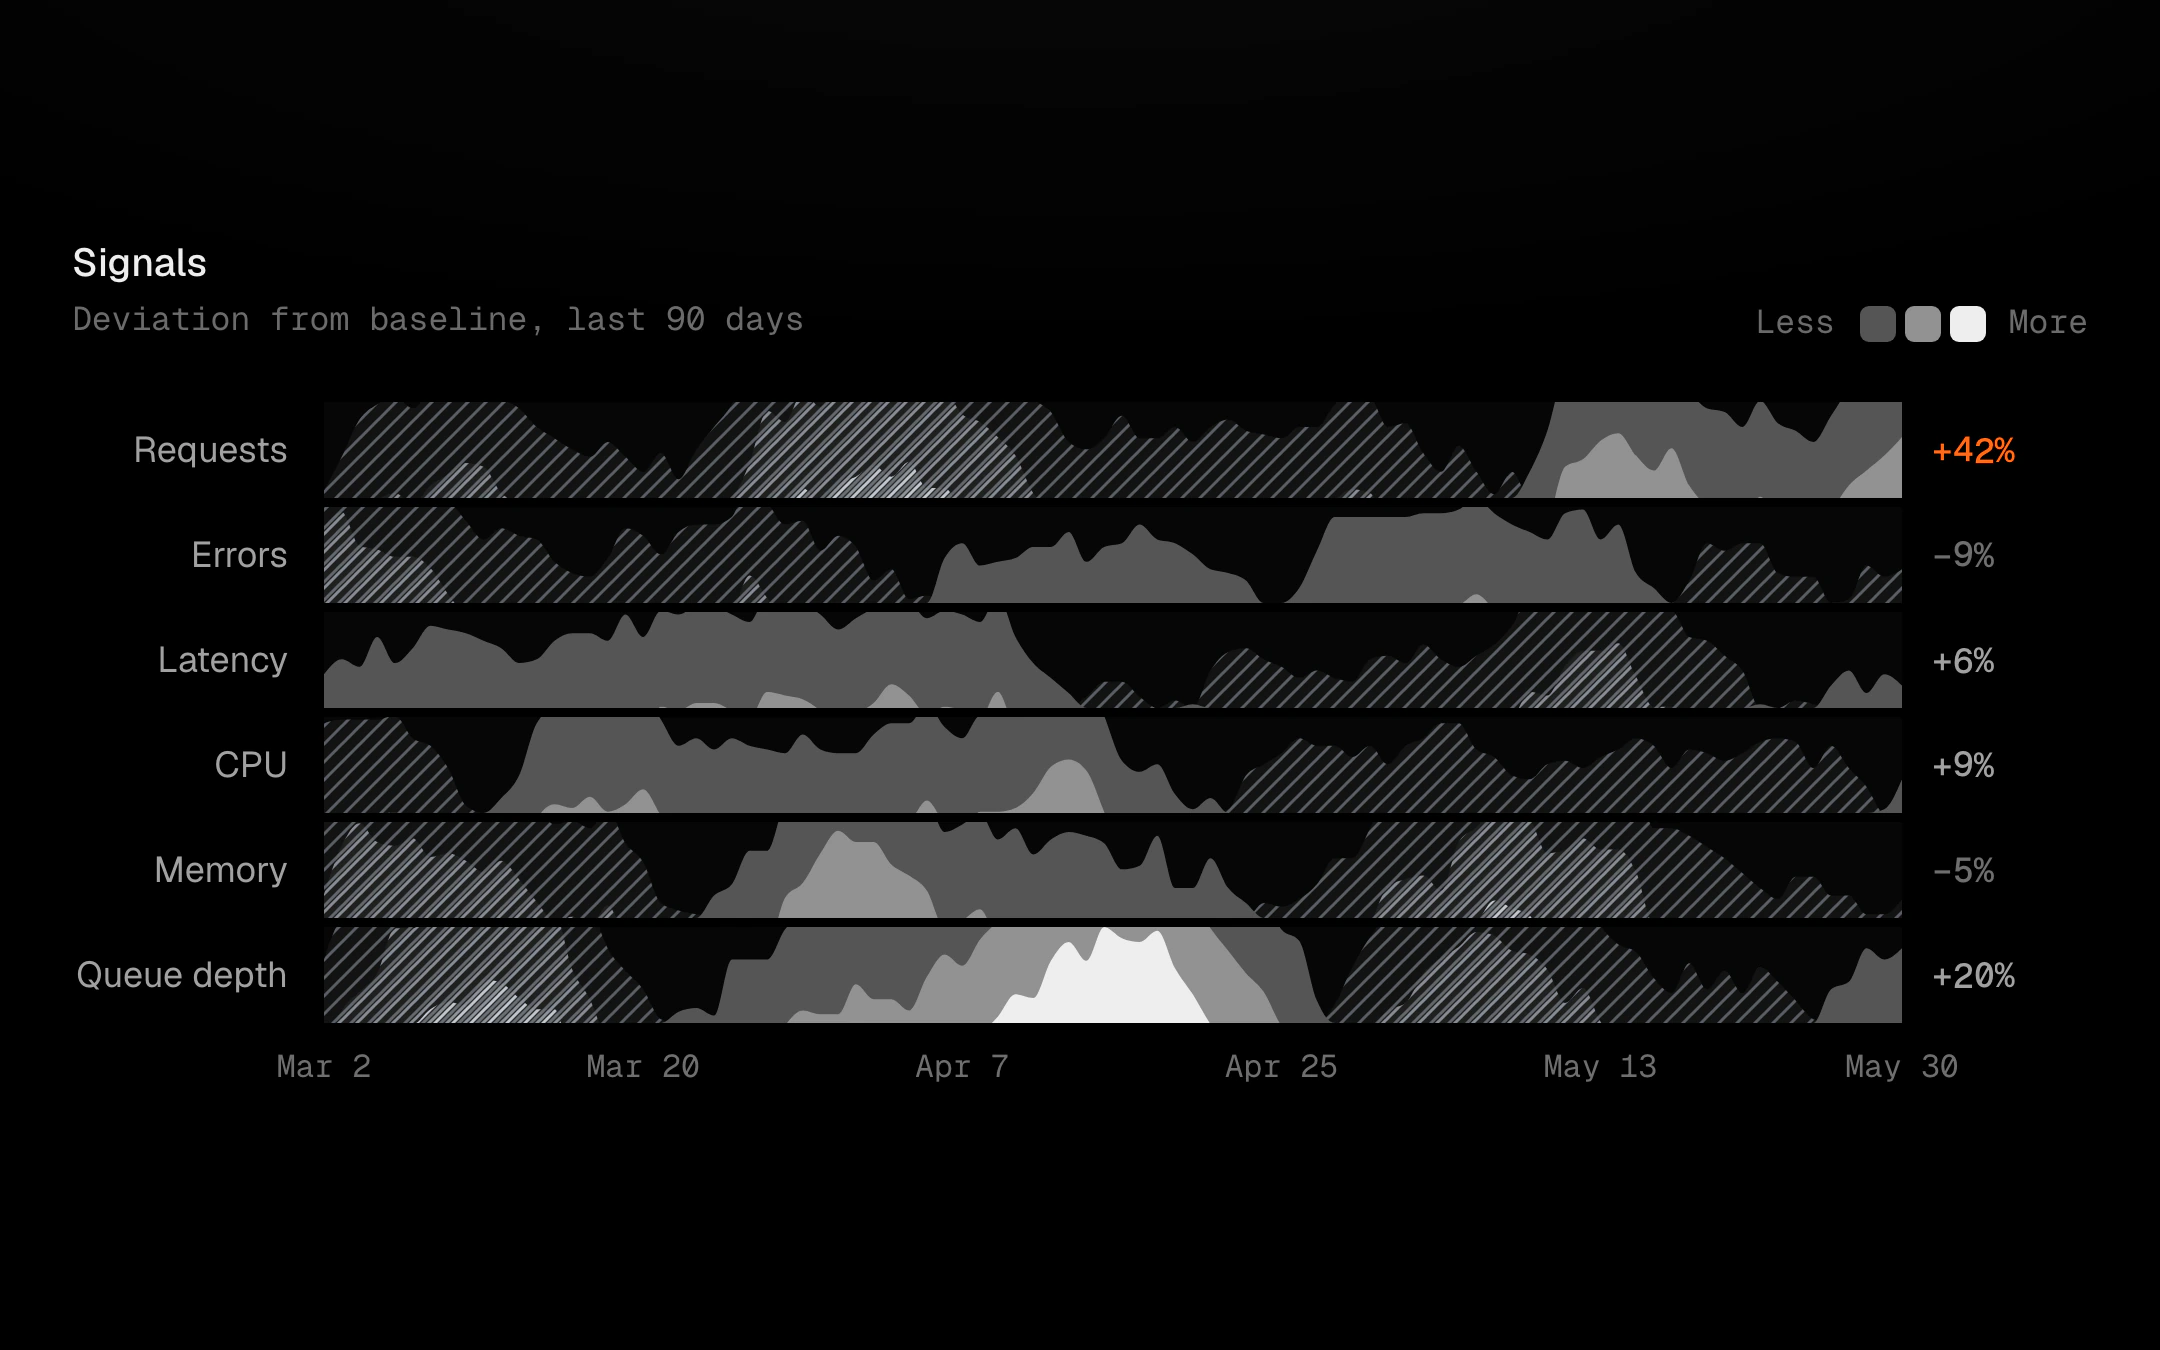
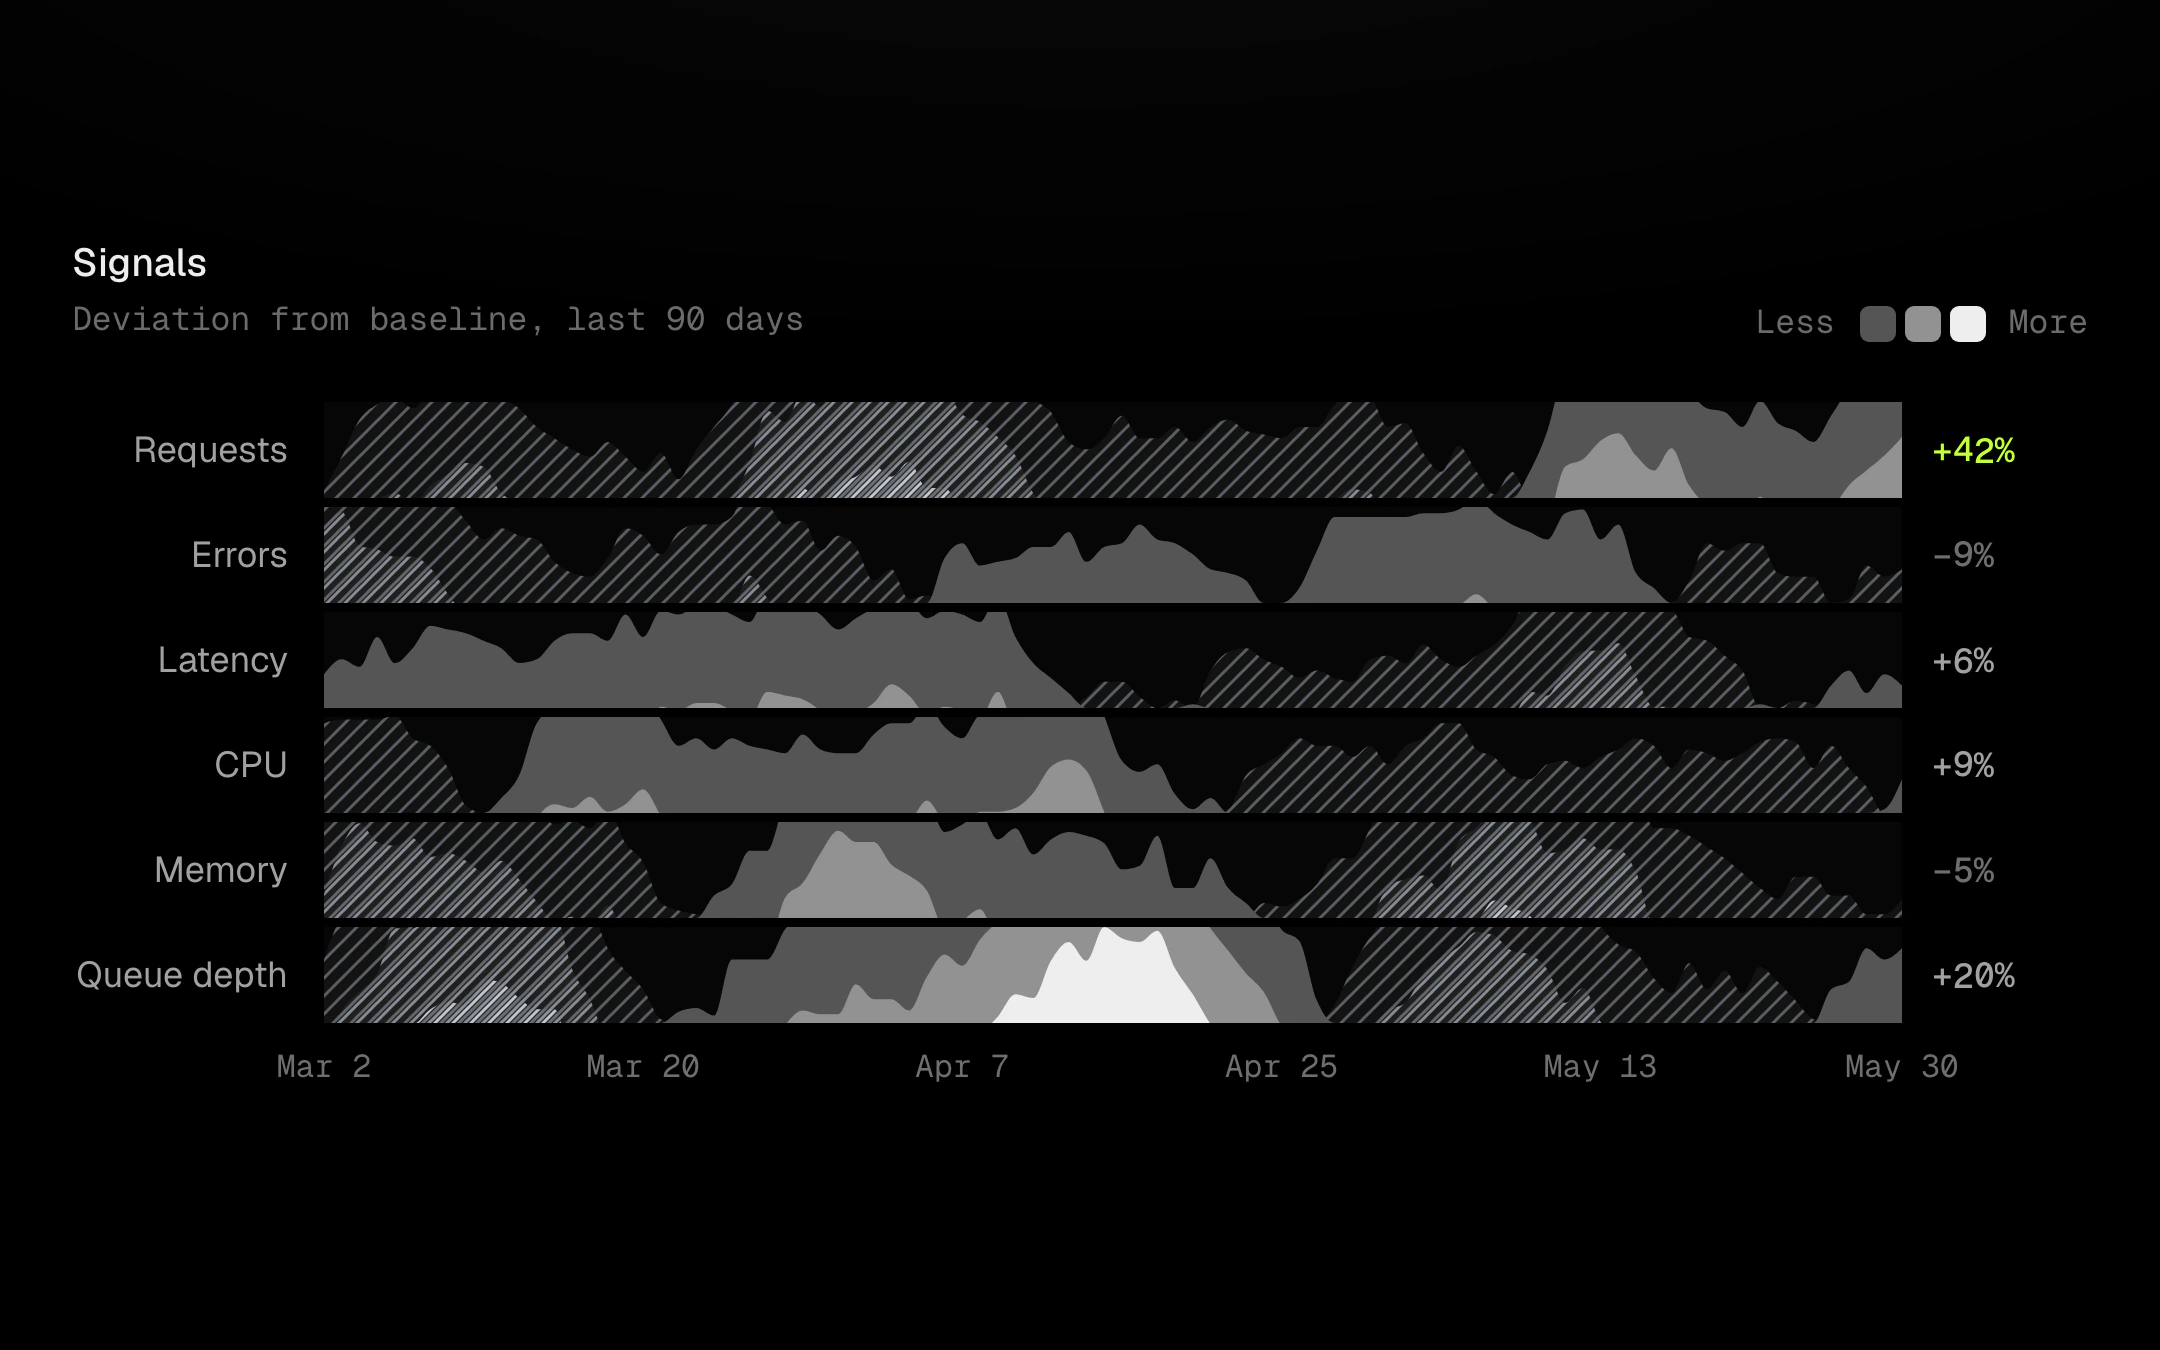
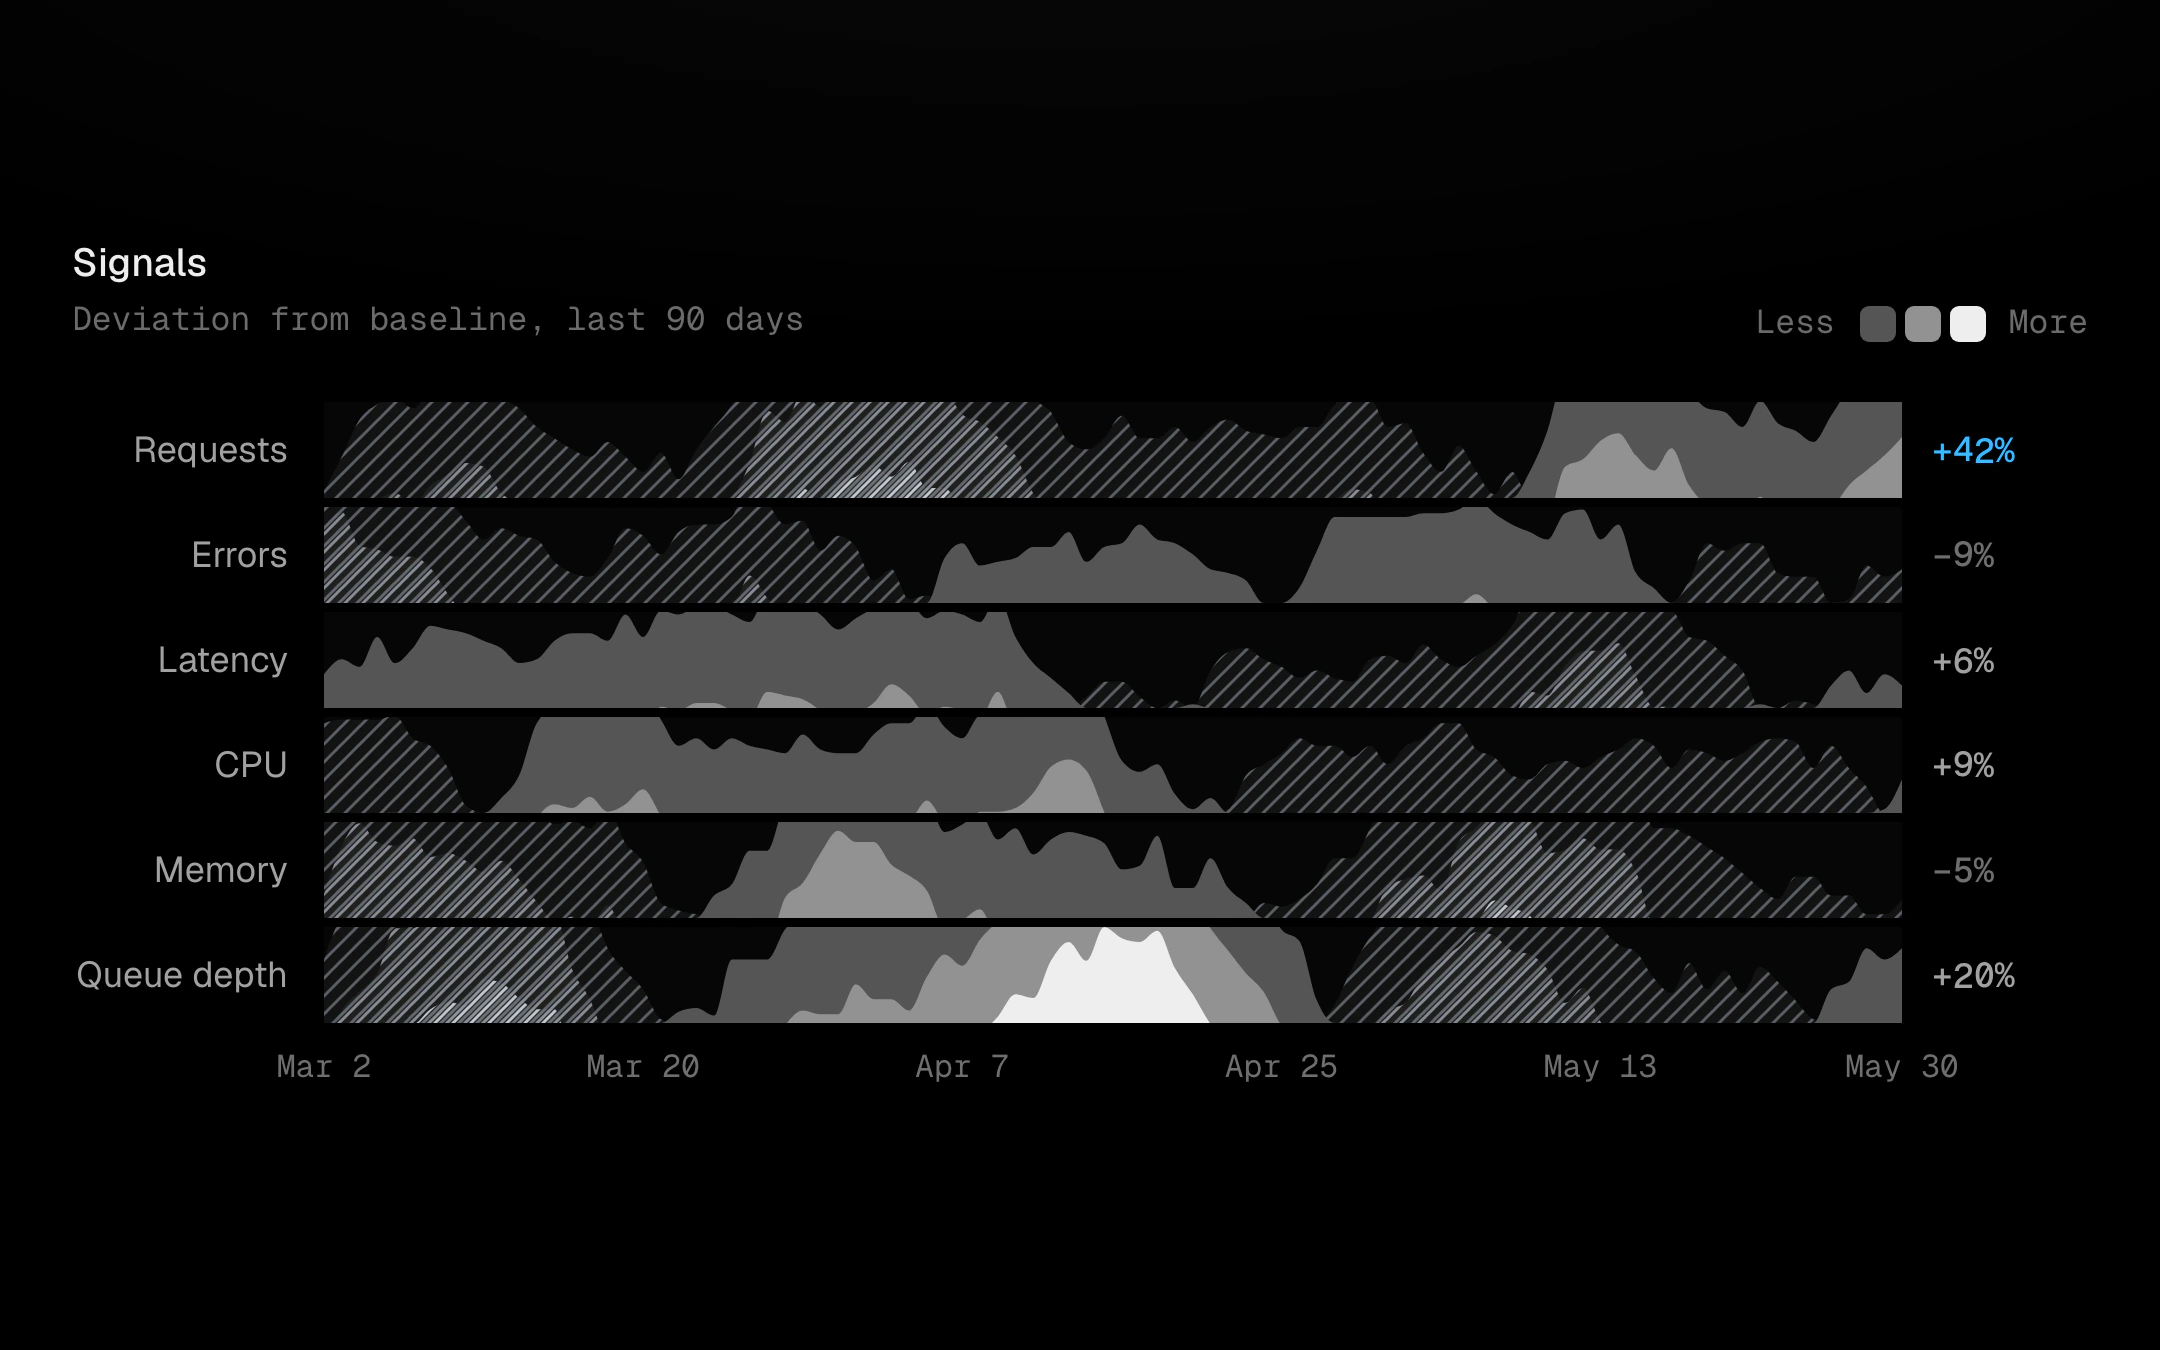
Many series in very little height.
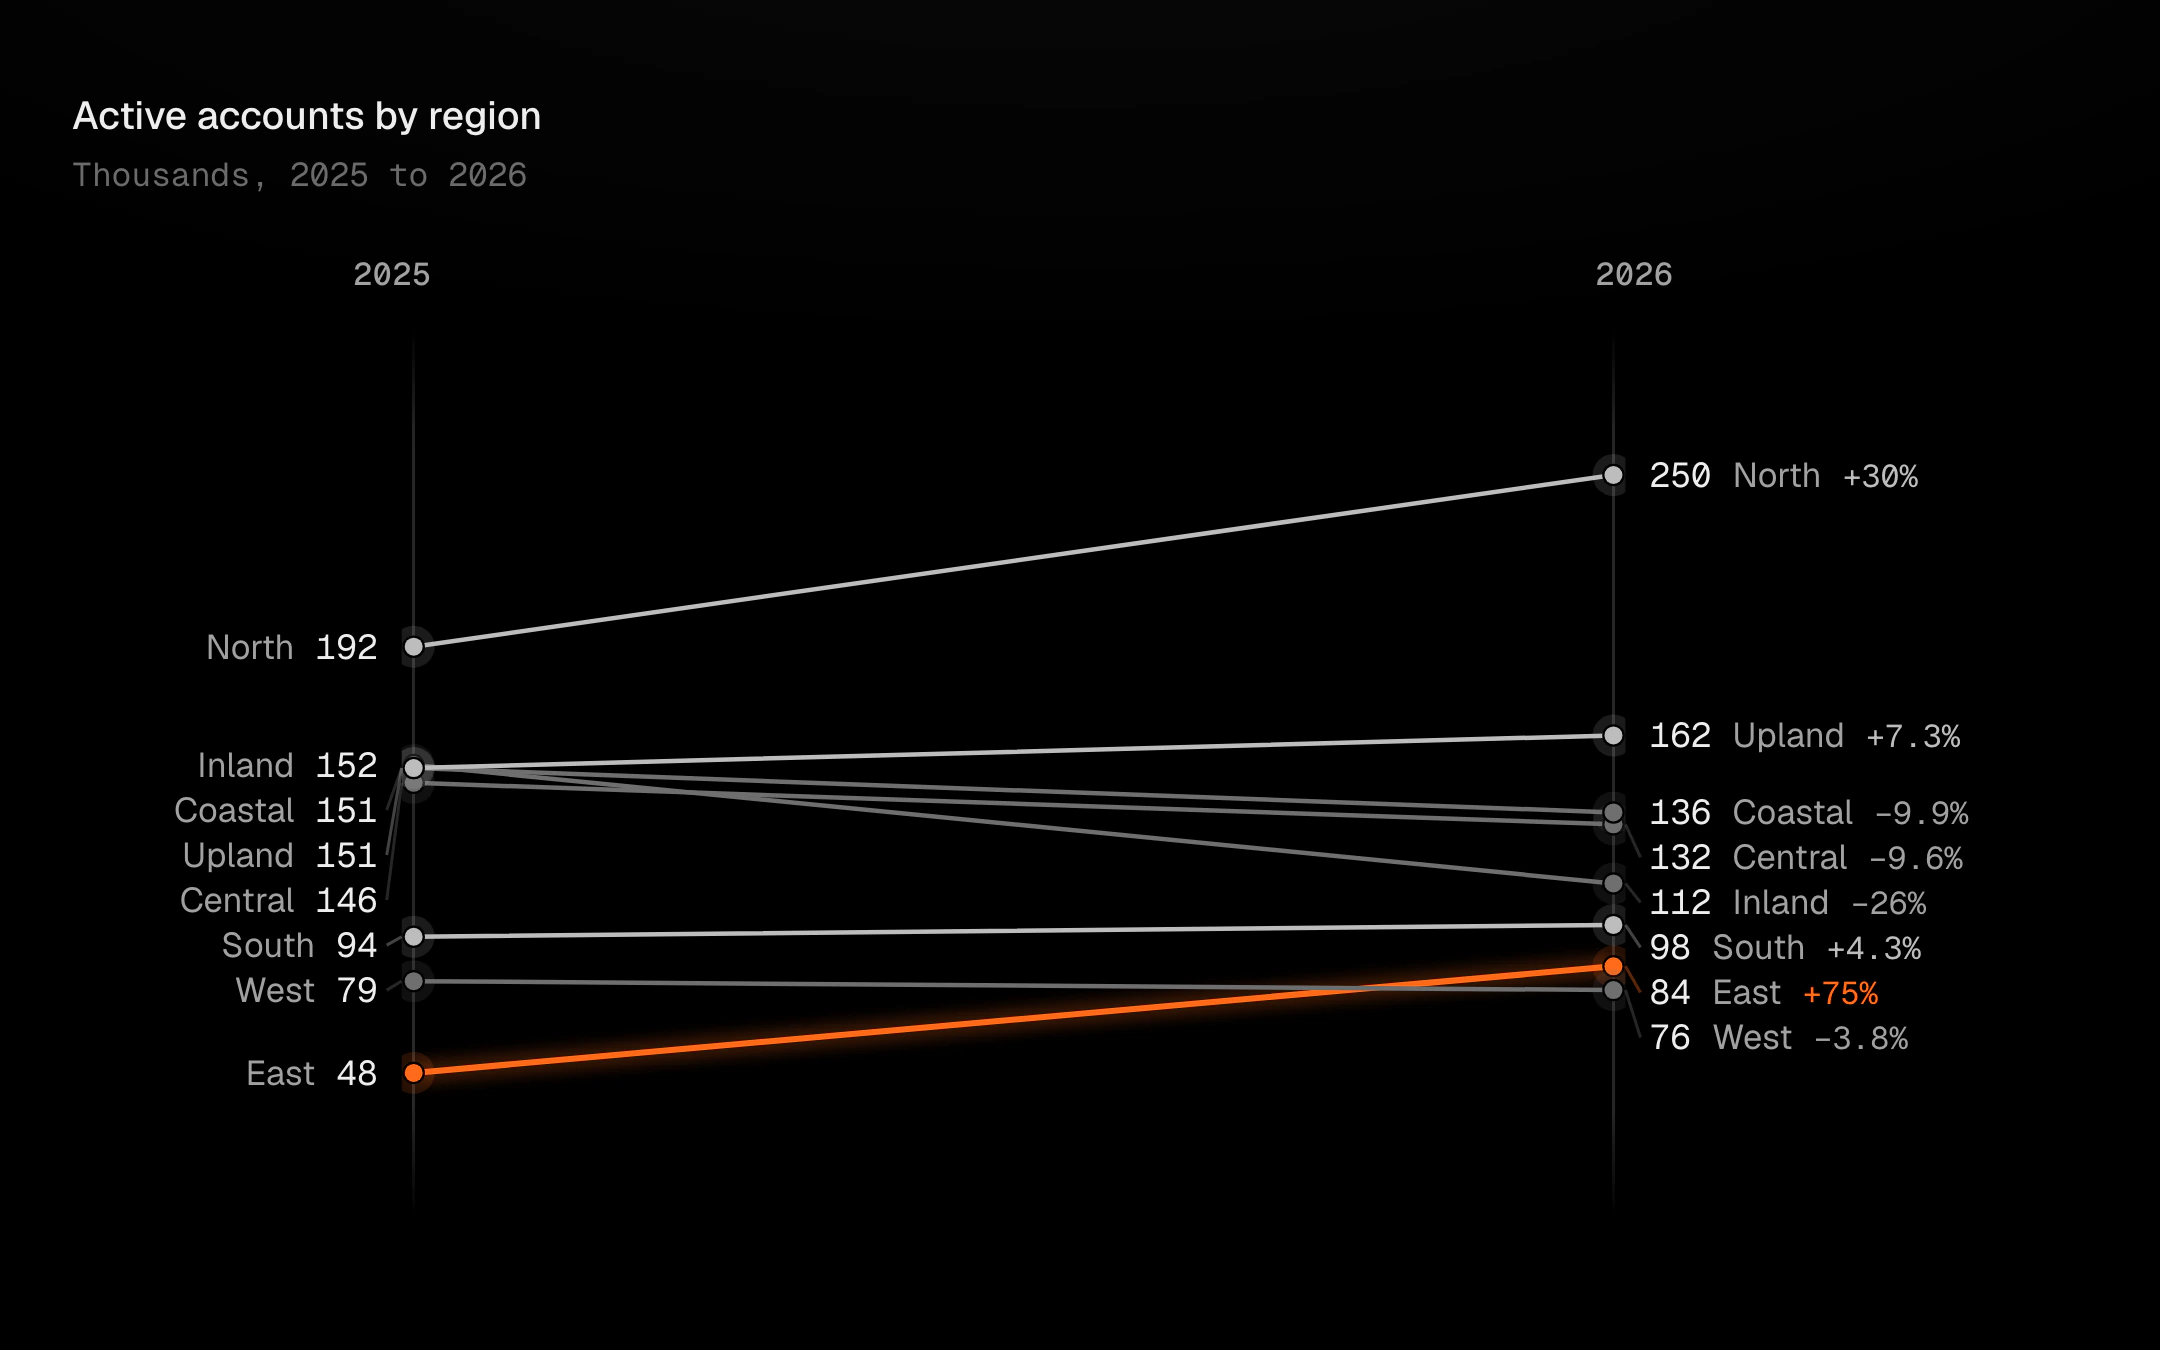
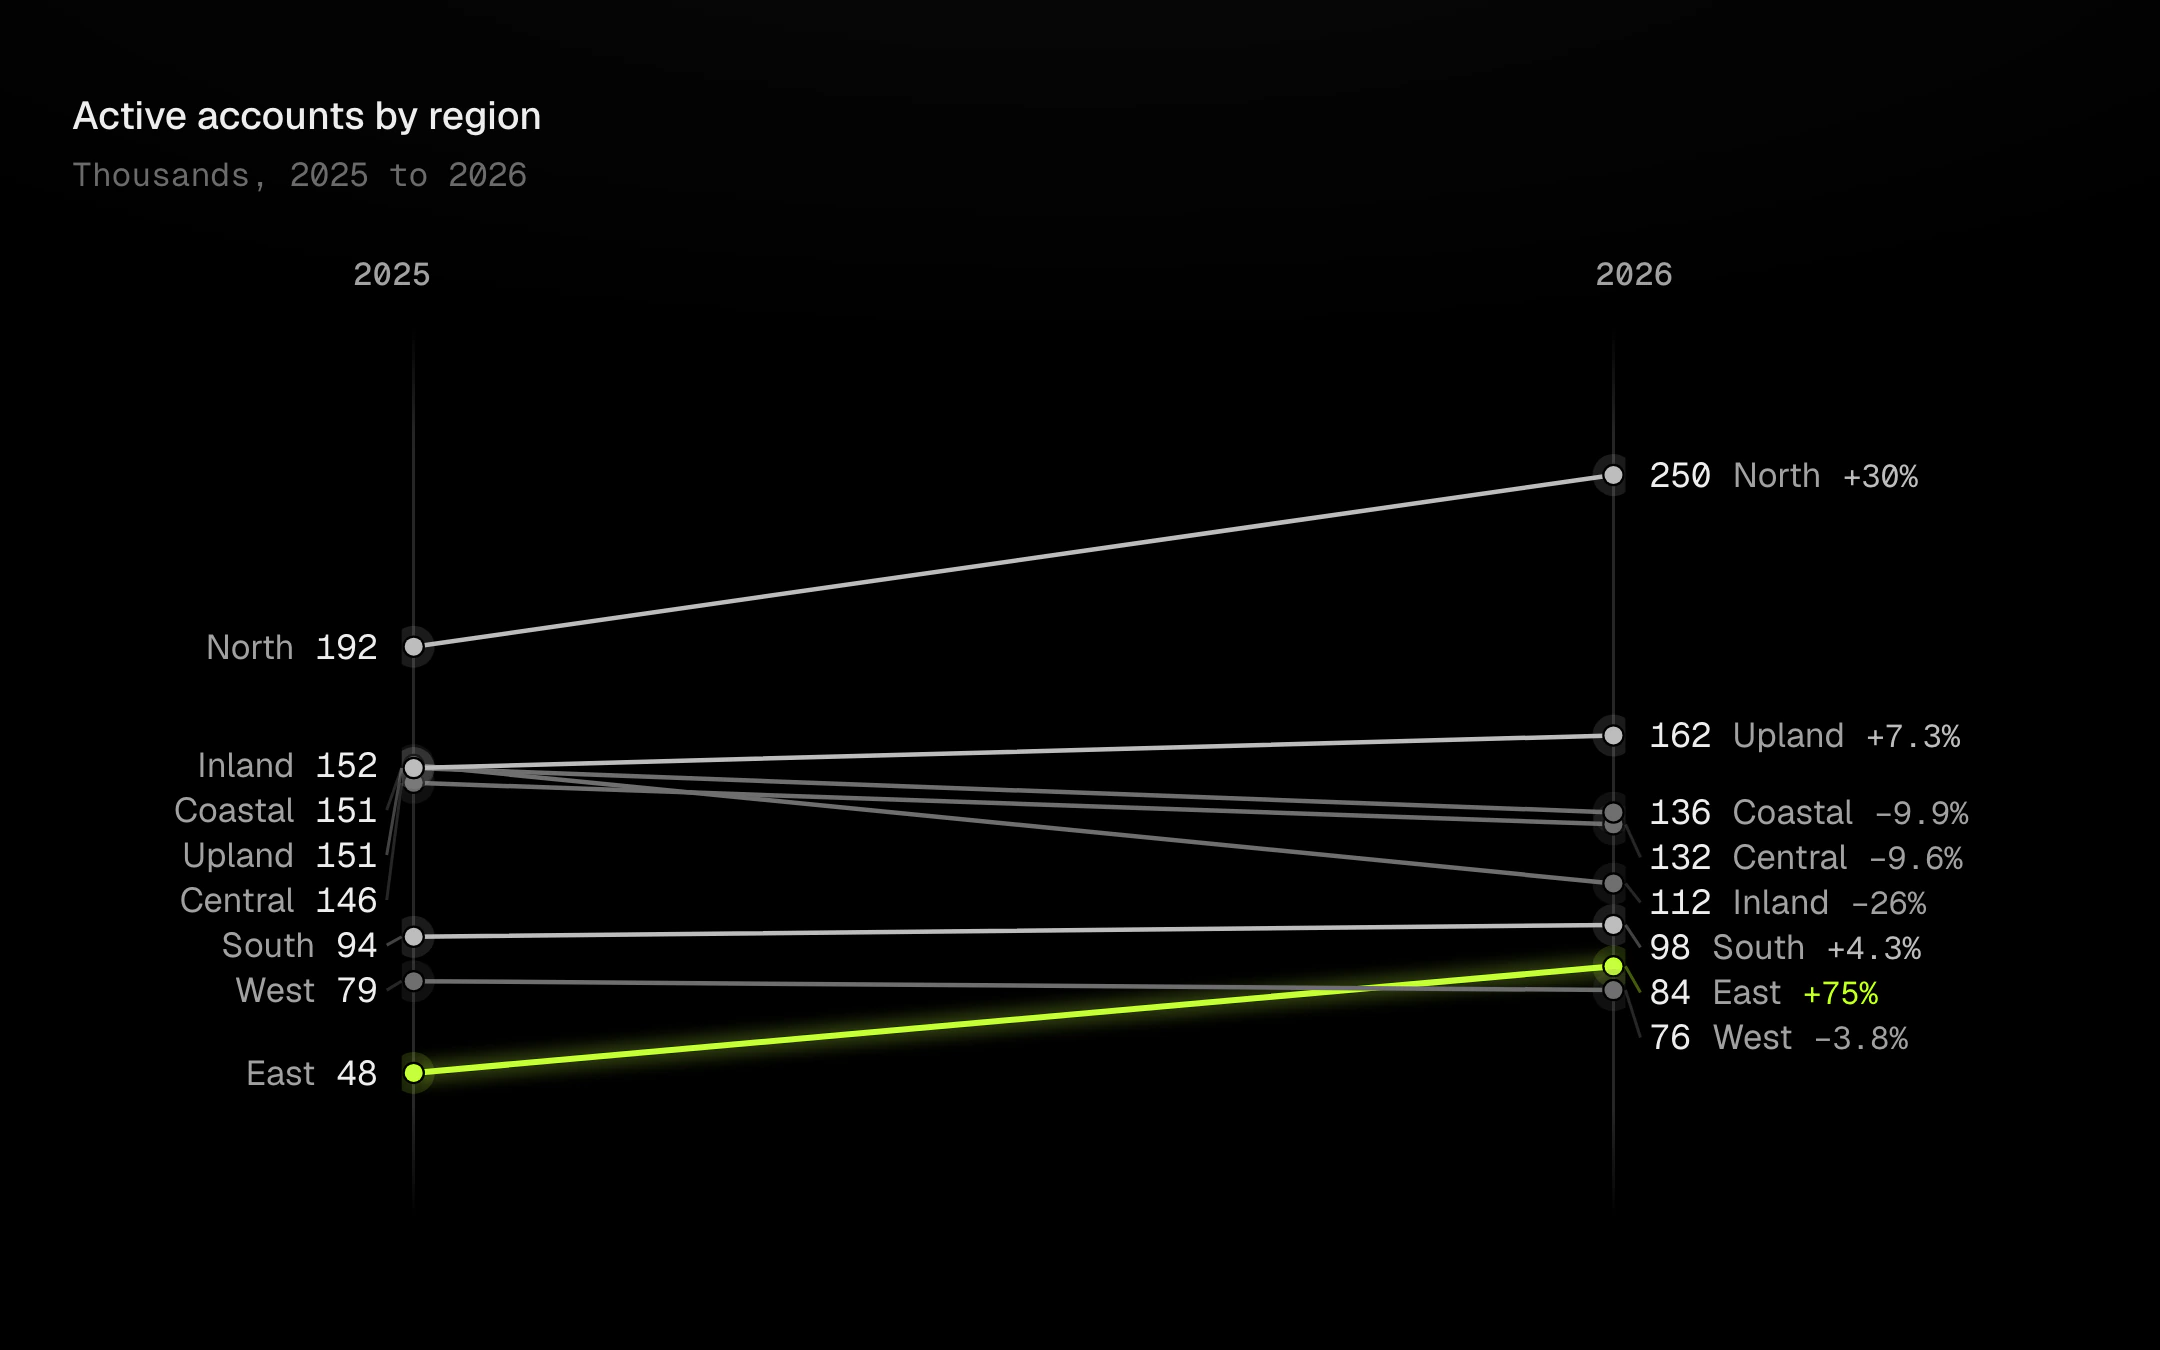
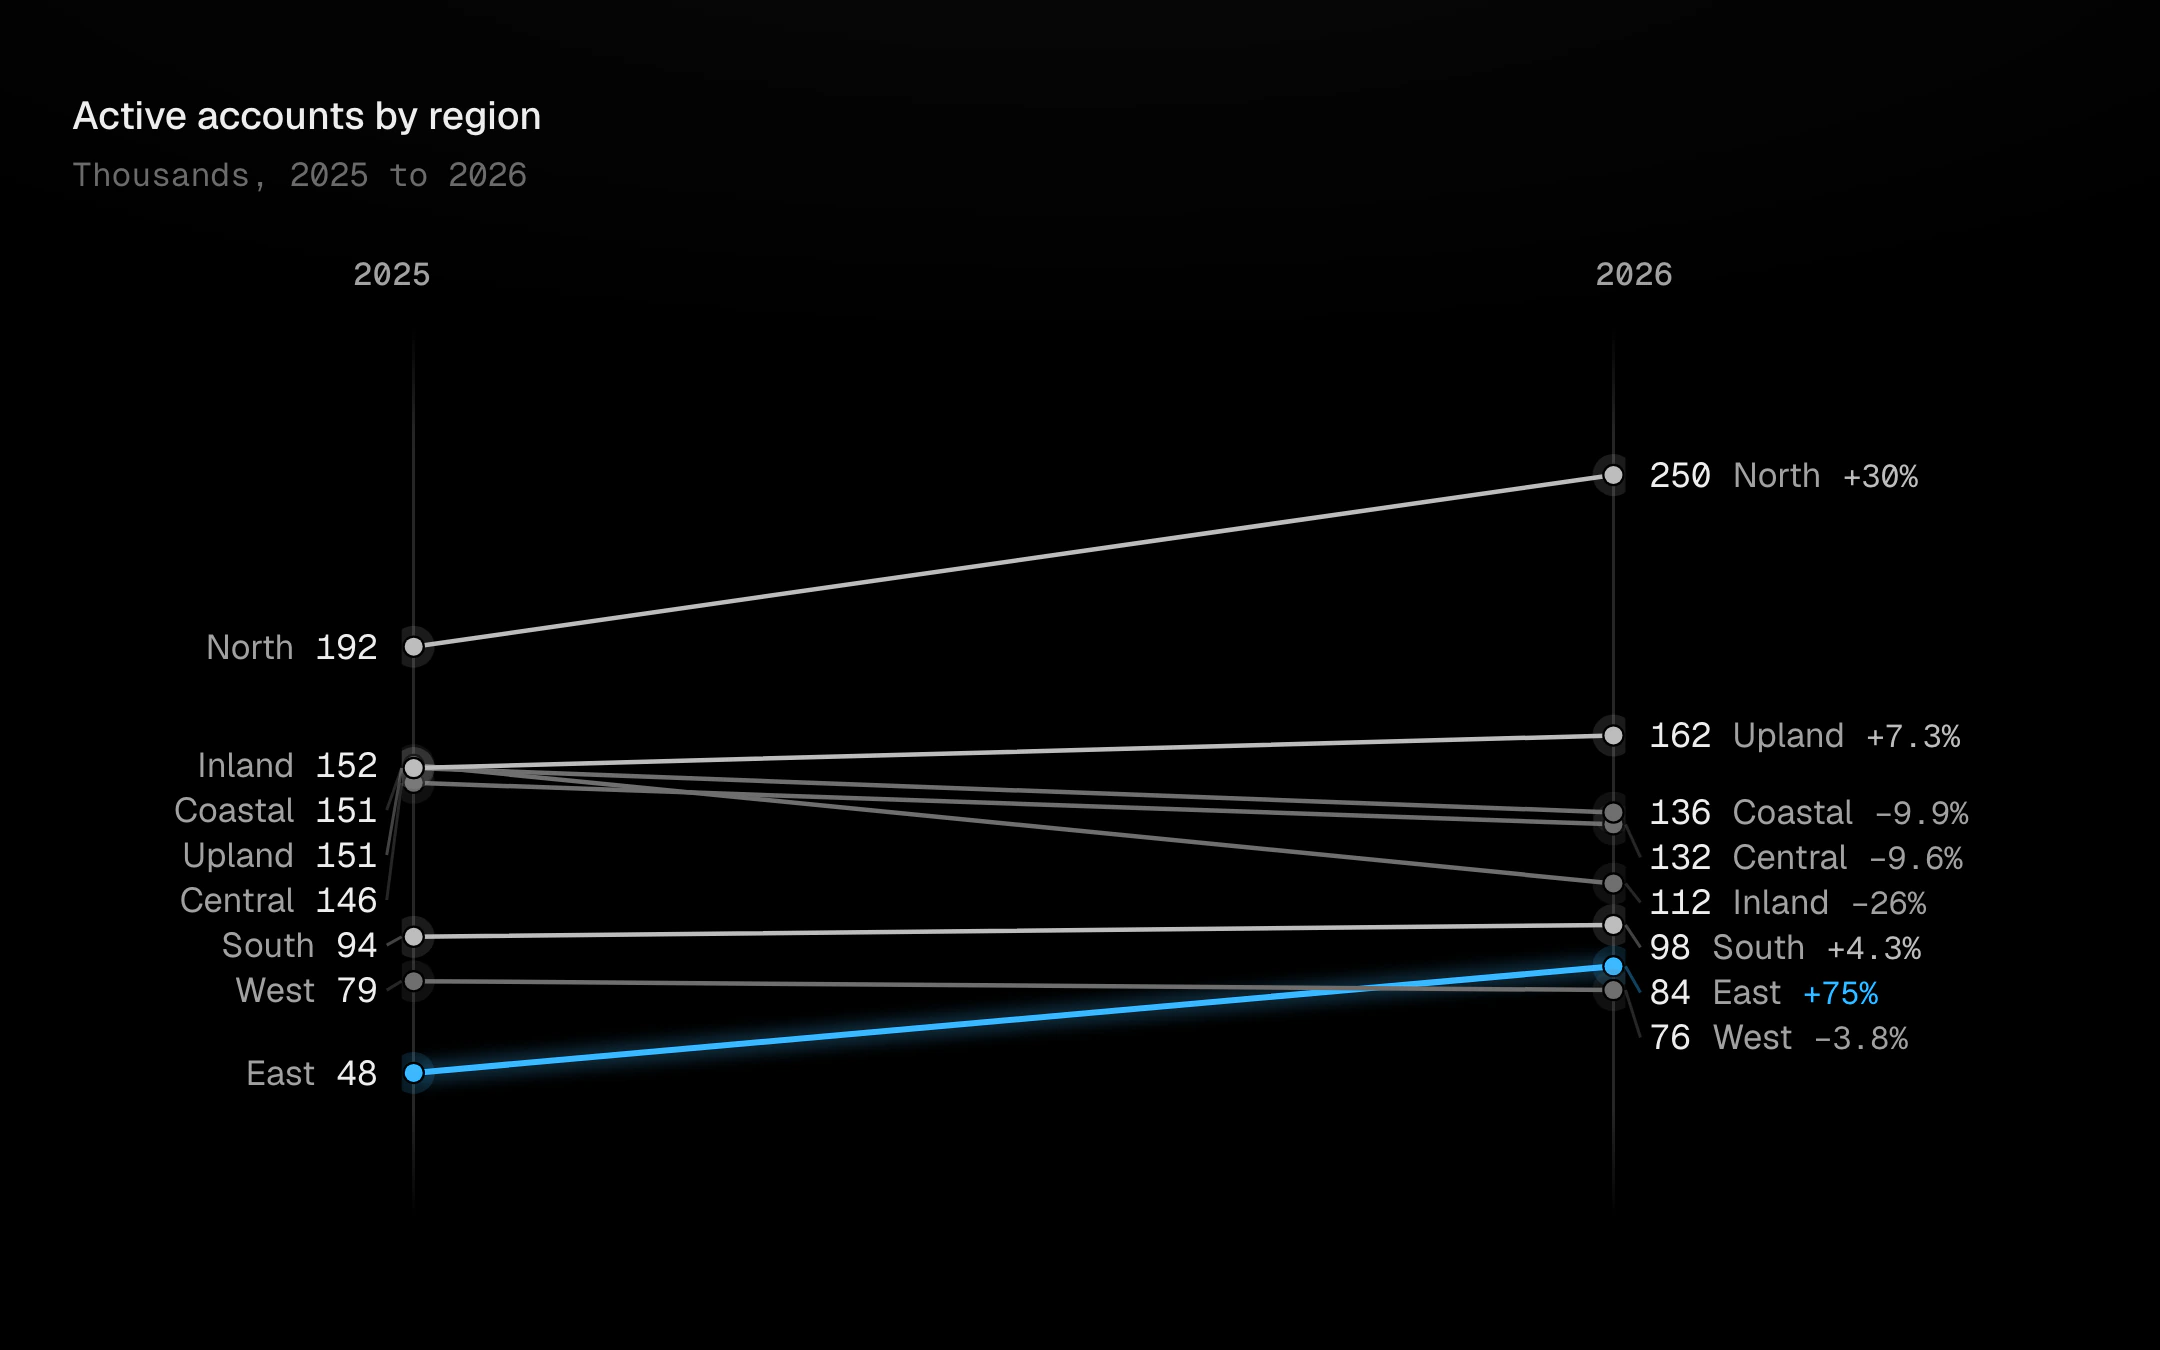
Two or three periods joined by straight lines, one per category.
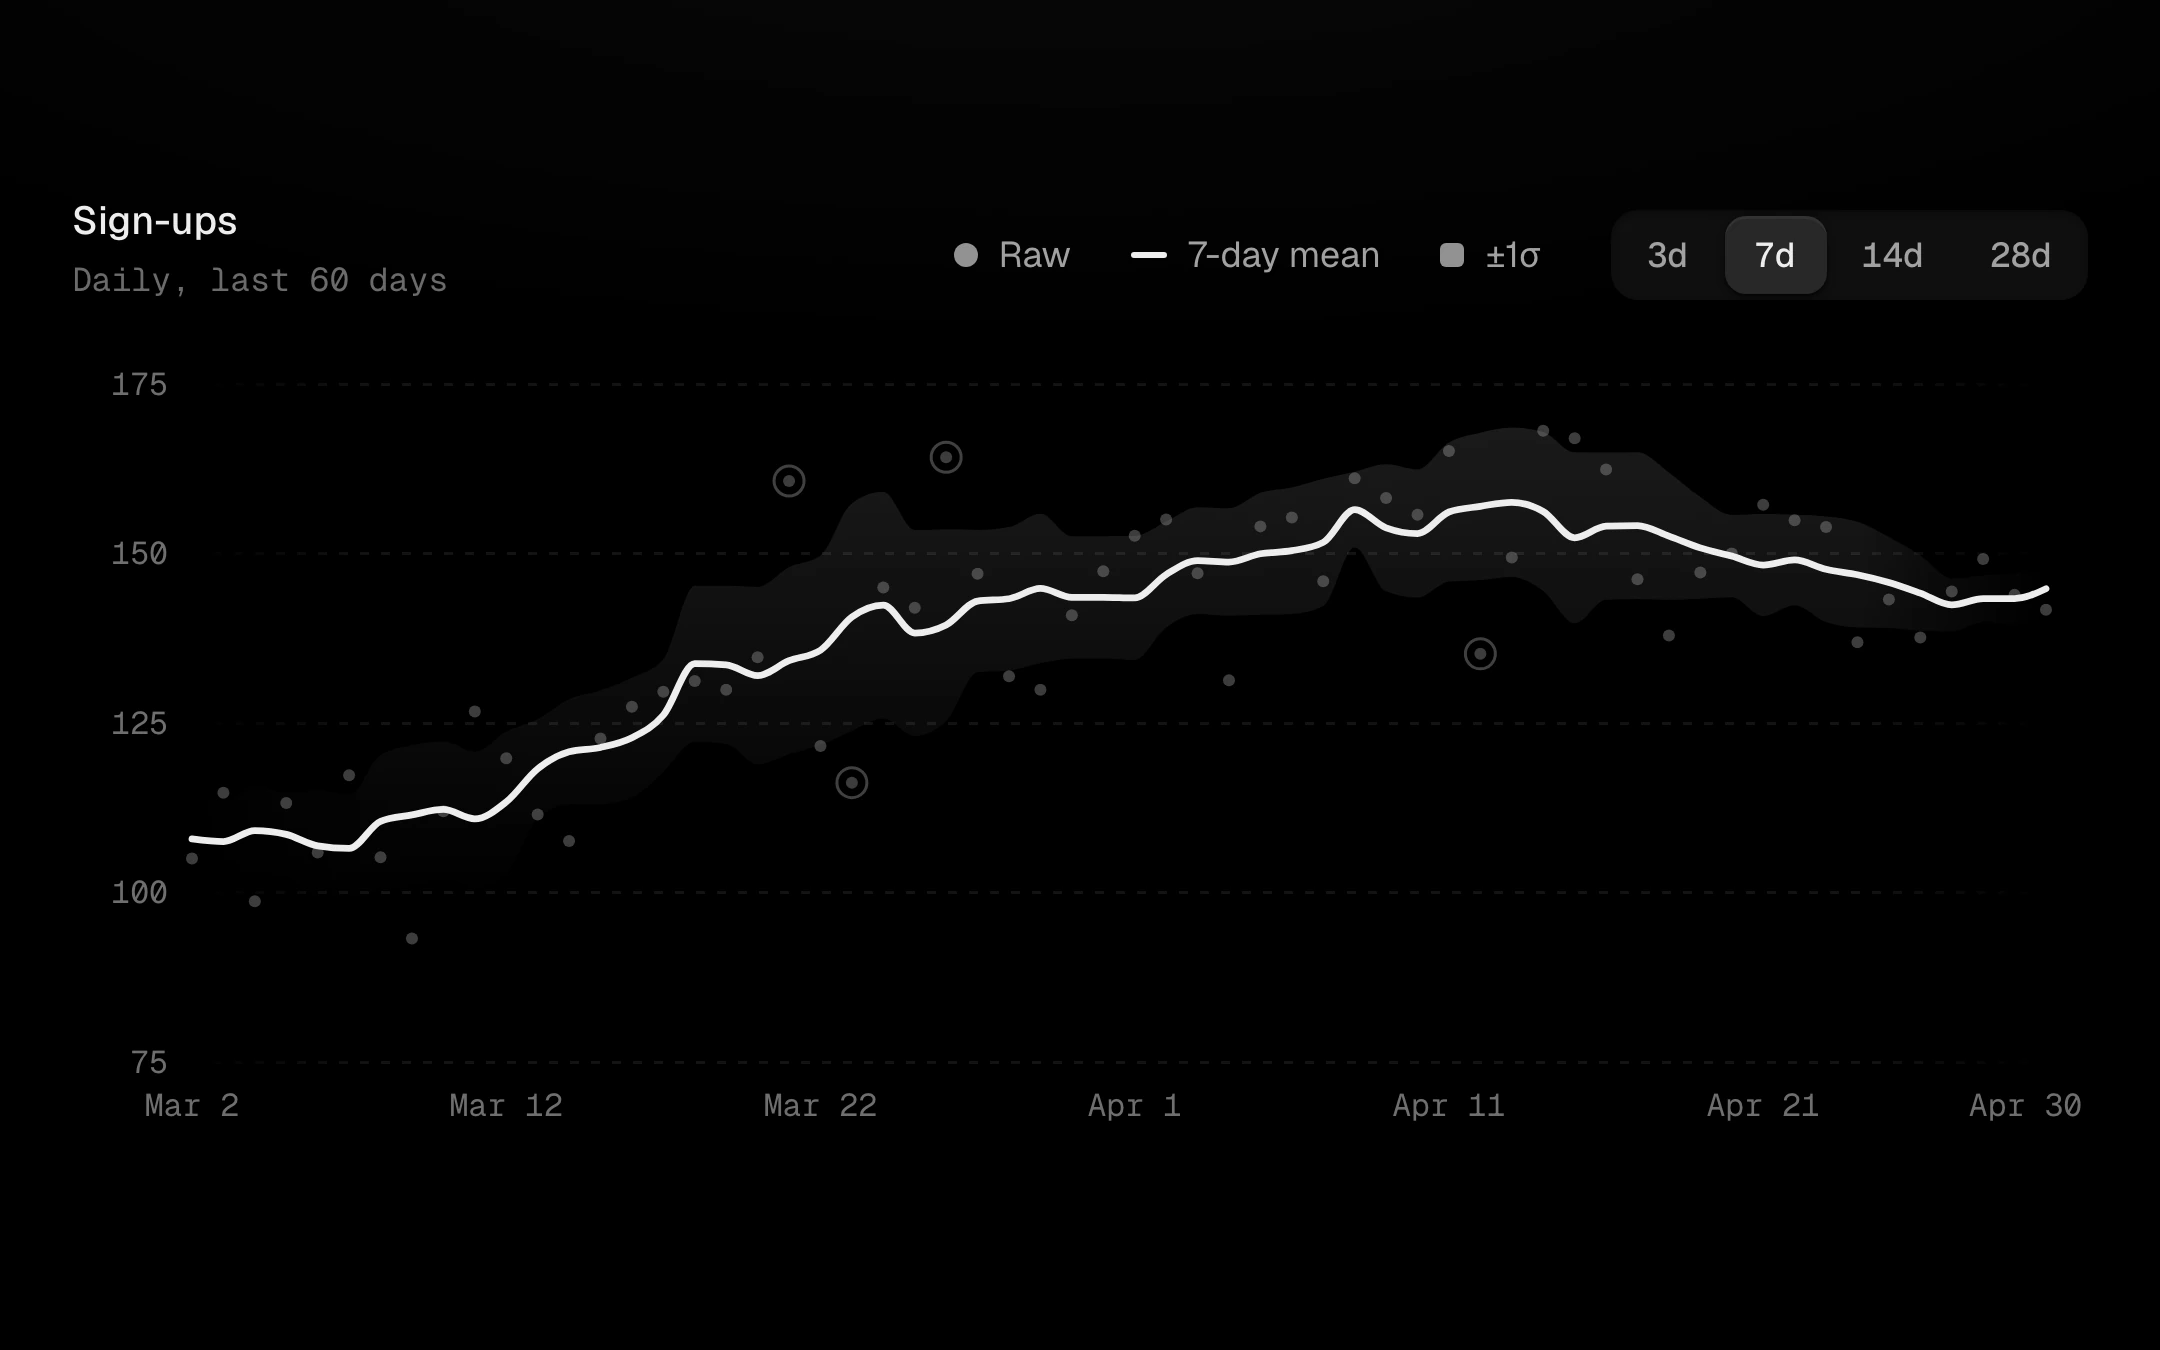
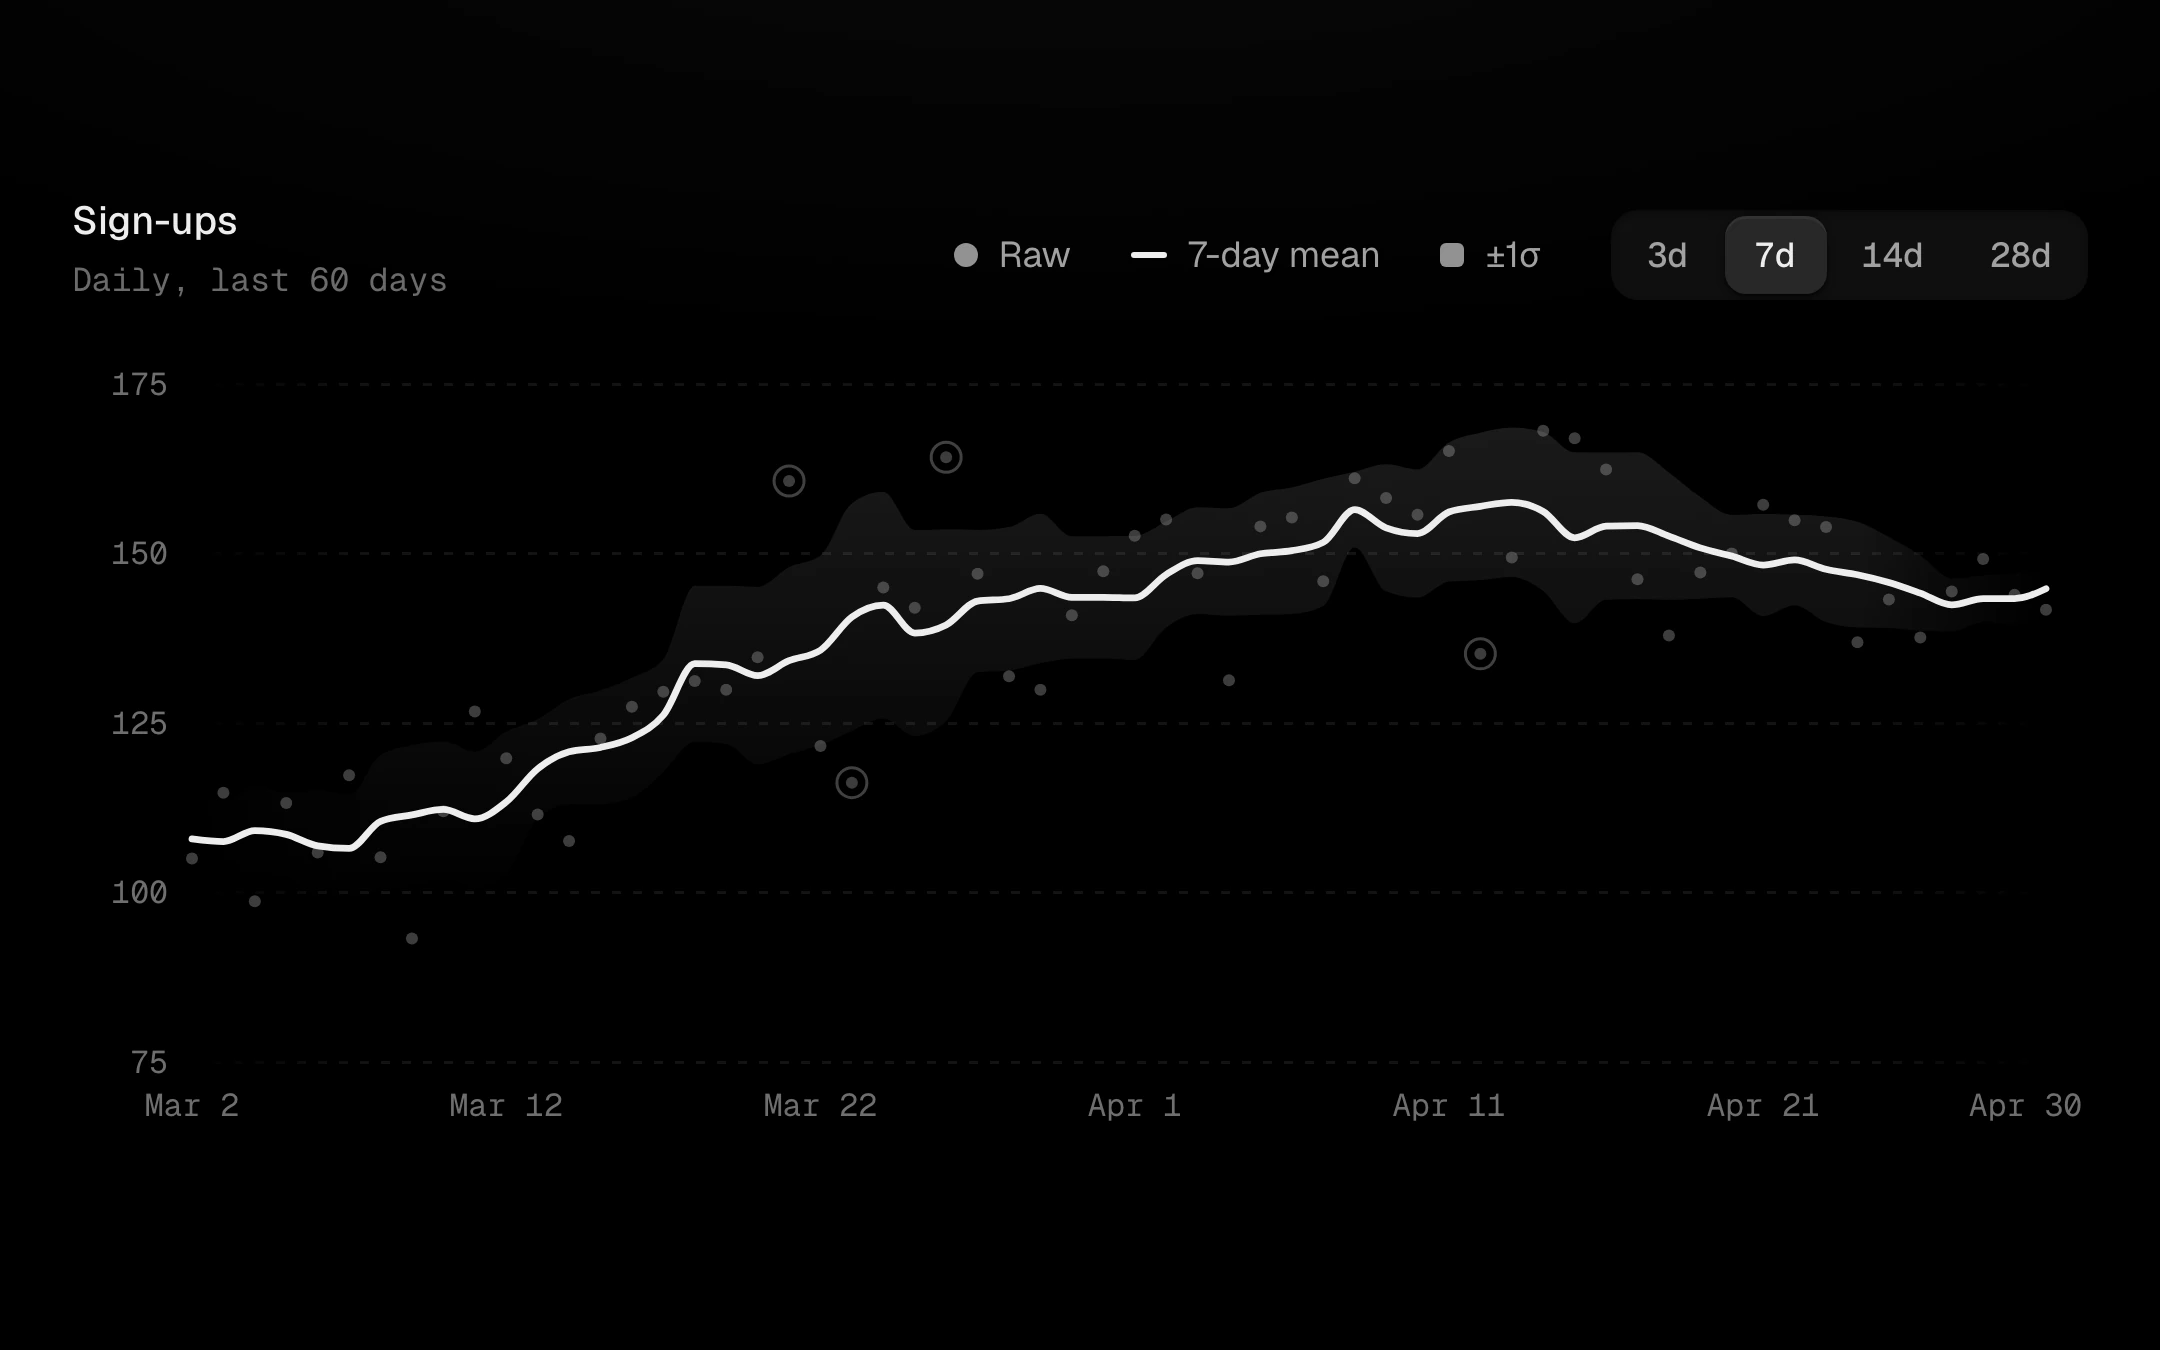
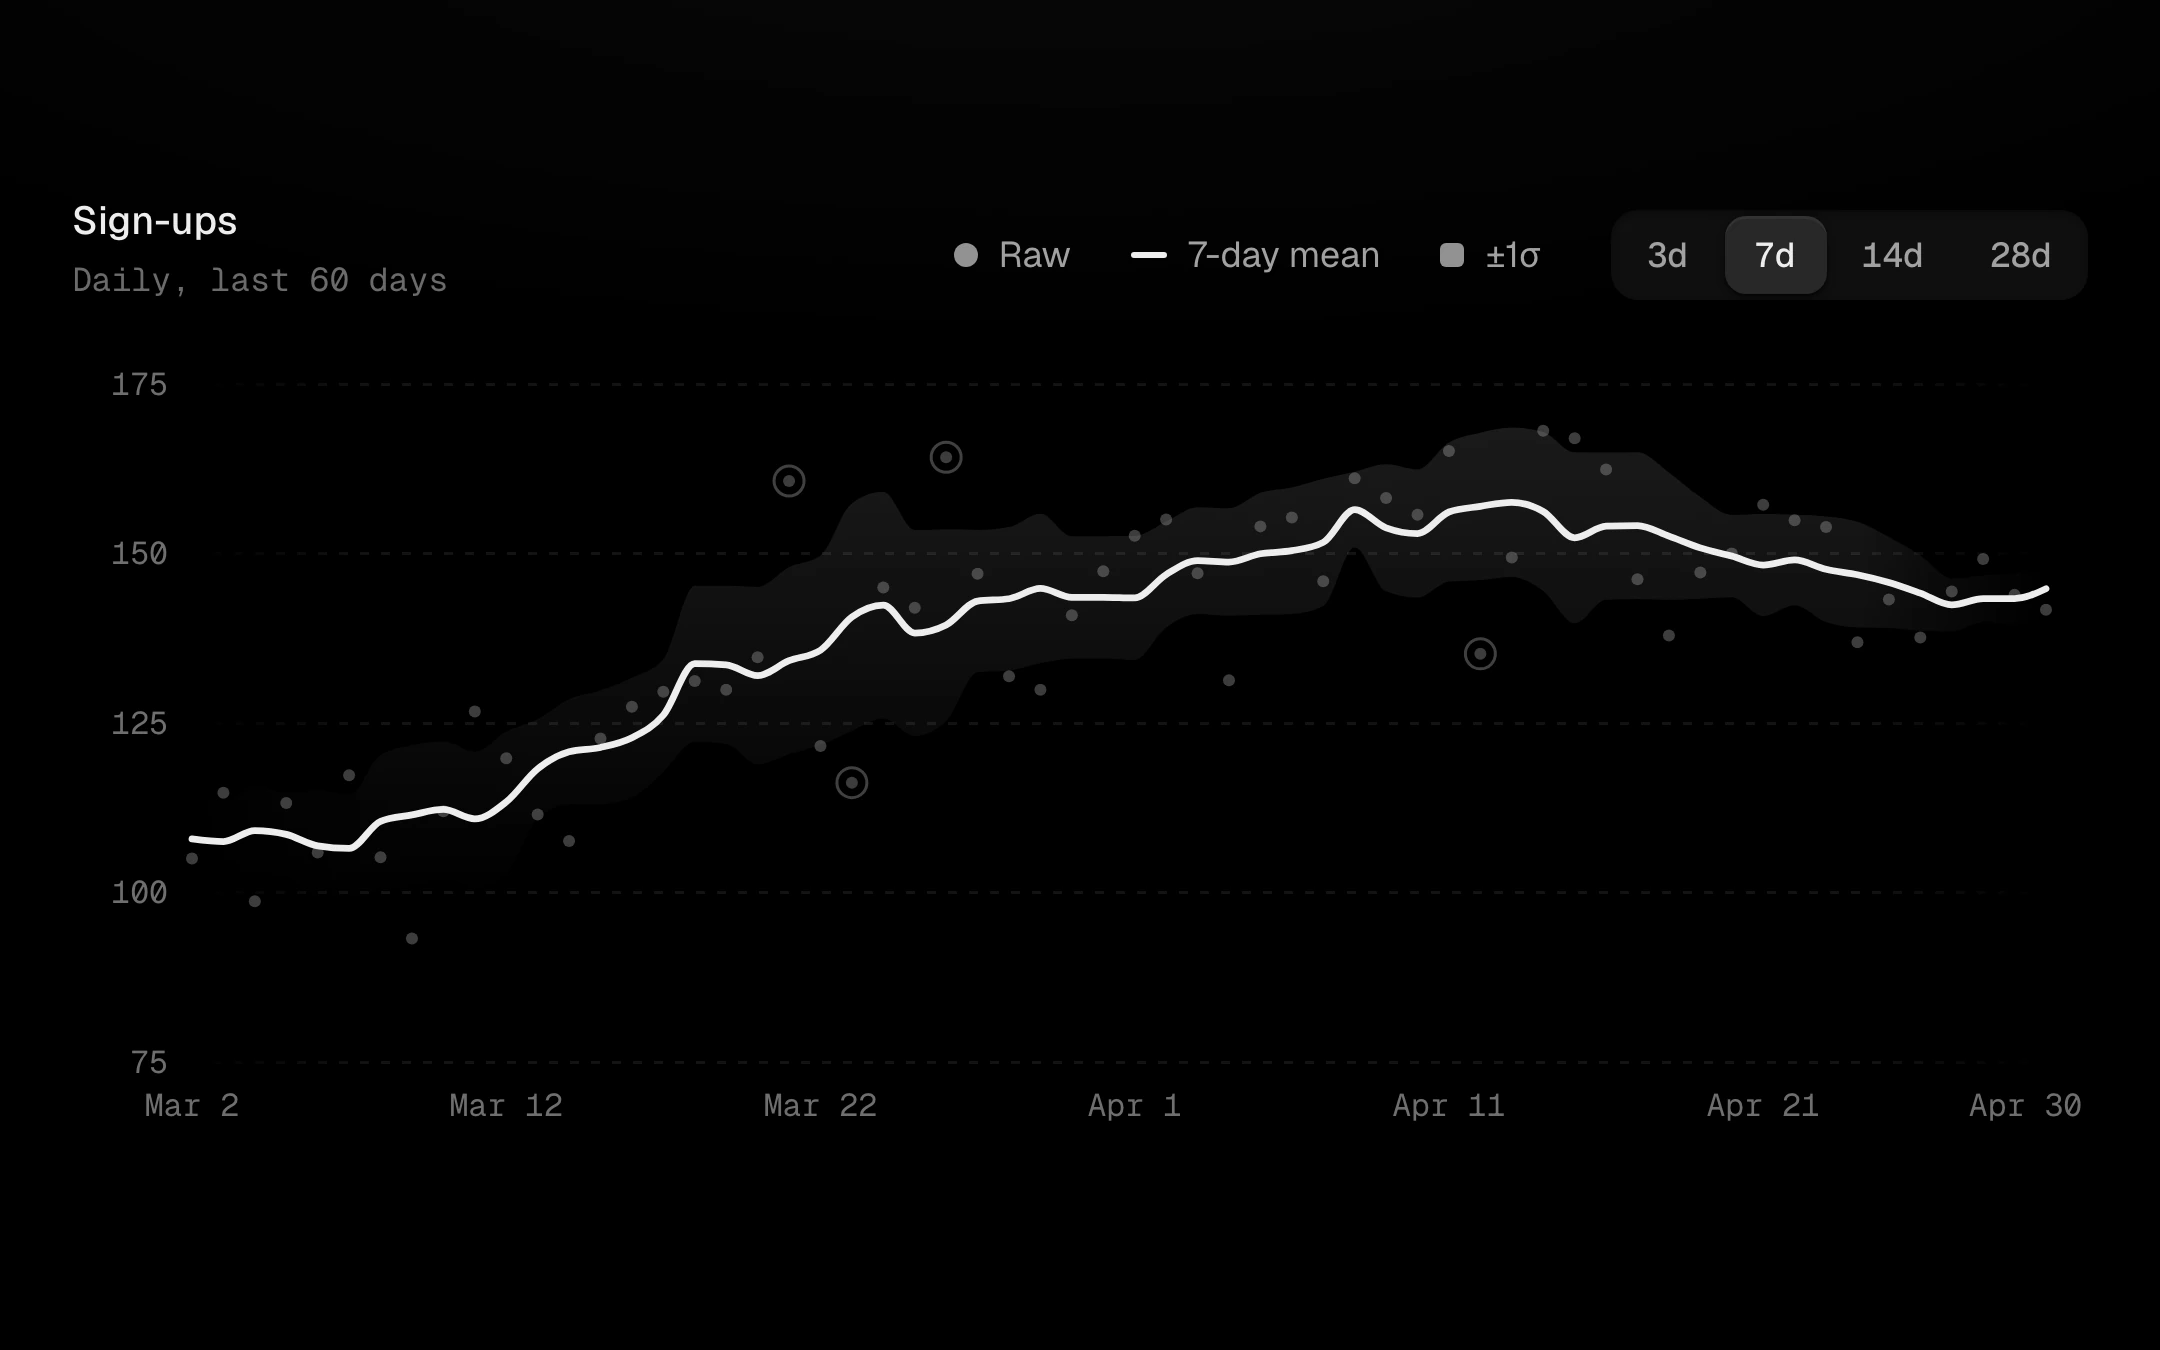
Raw readings as faint dots and a bold rolling average drawn through them, with an optional ±kσ band.
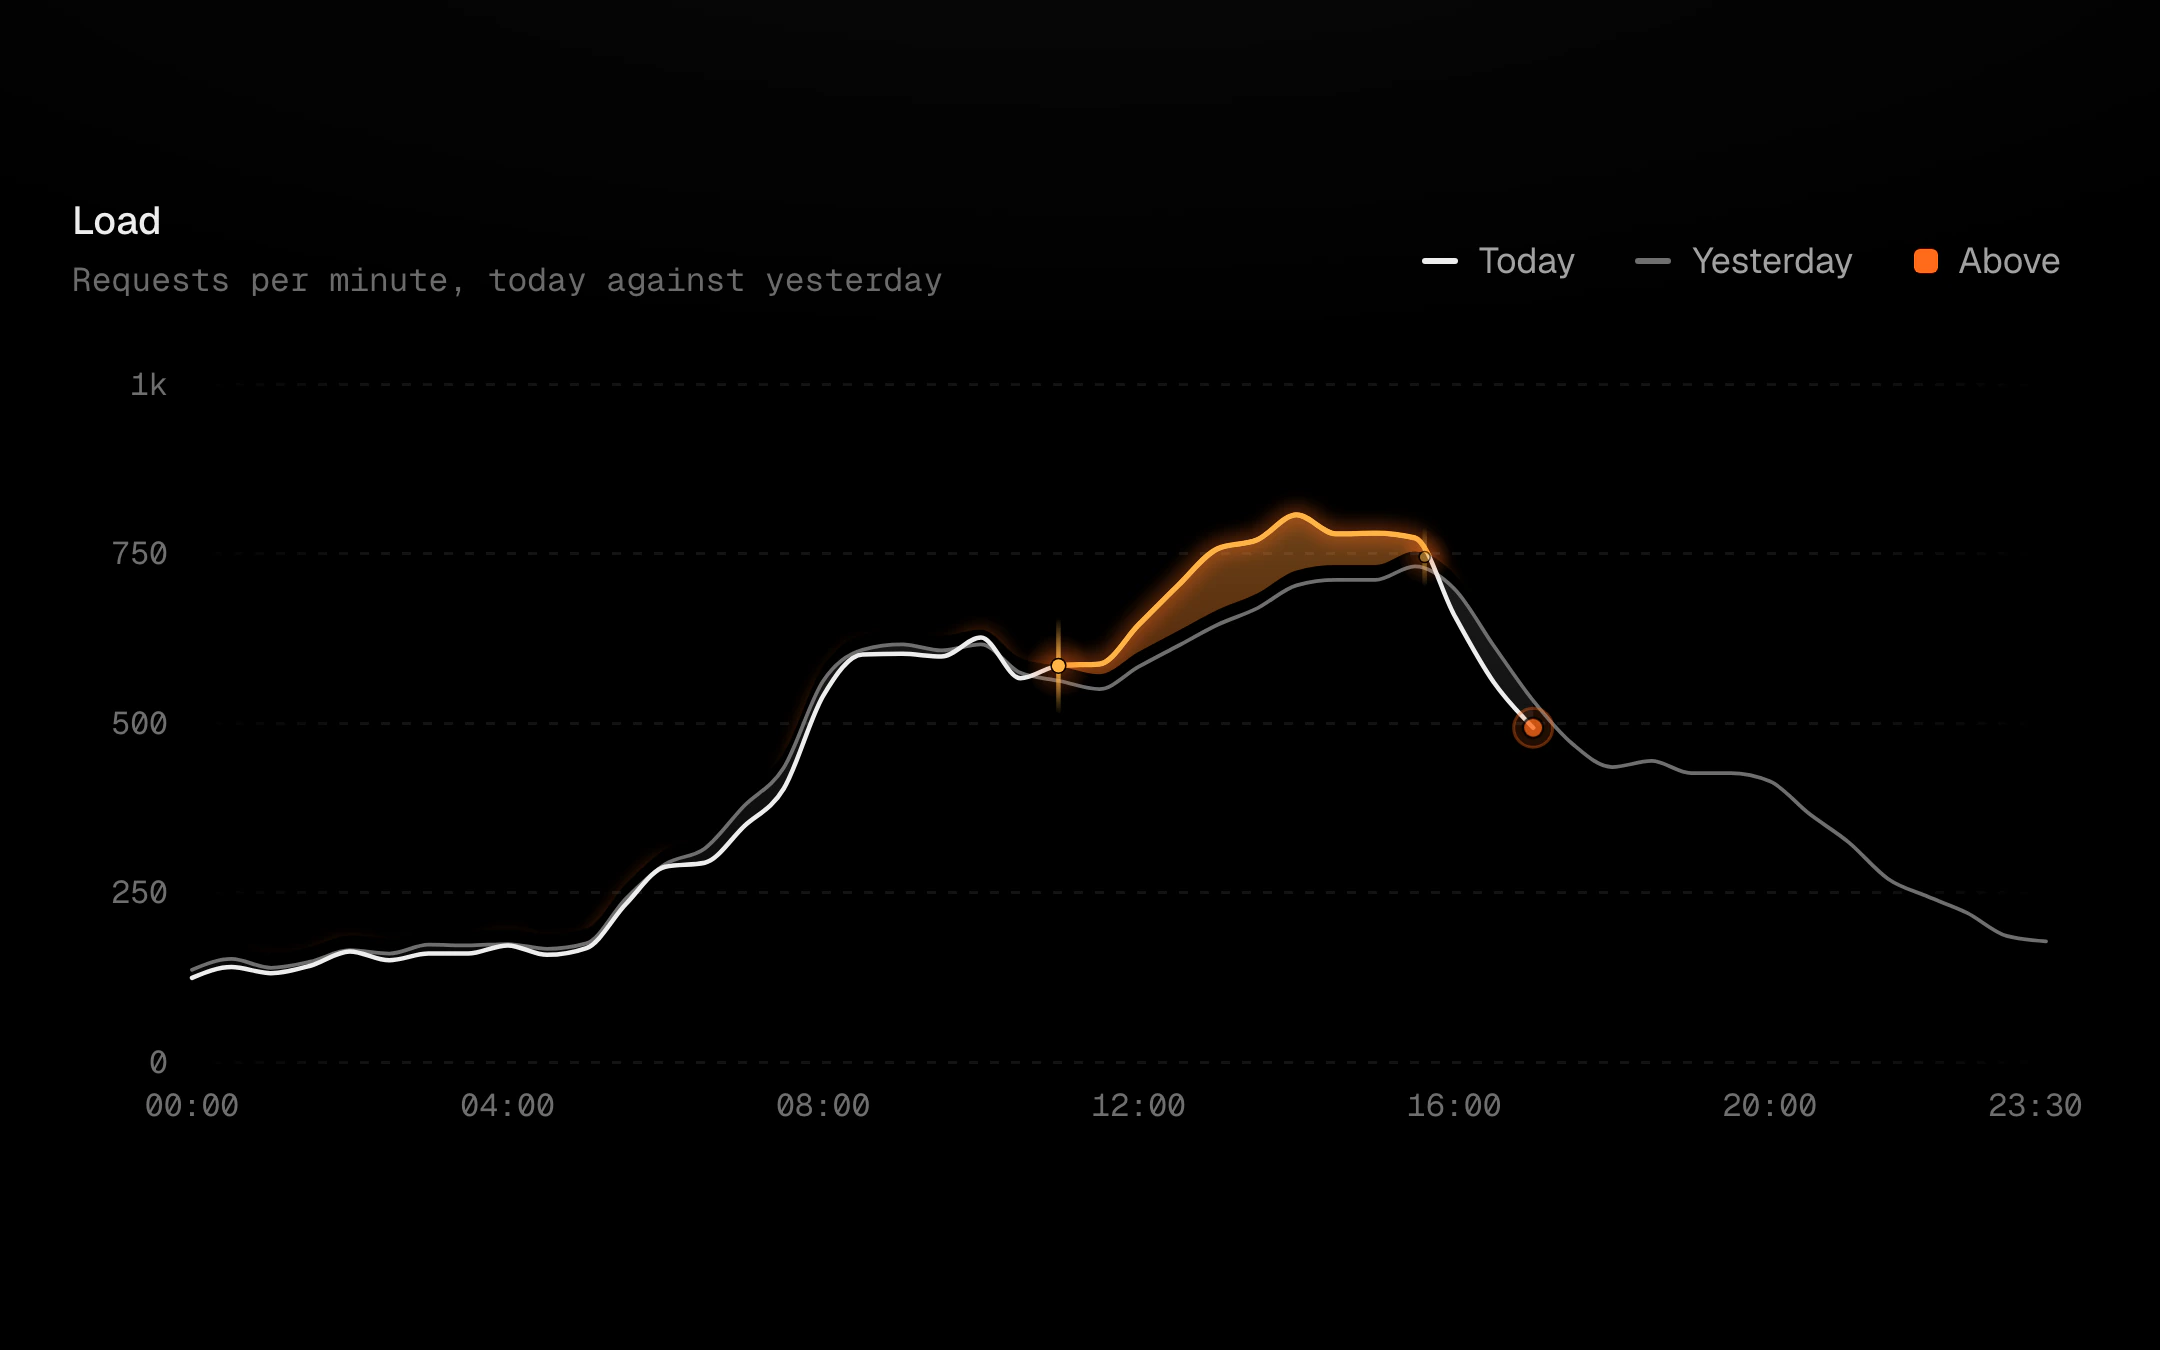
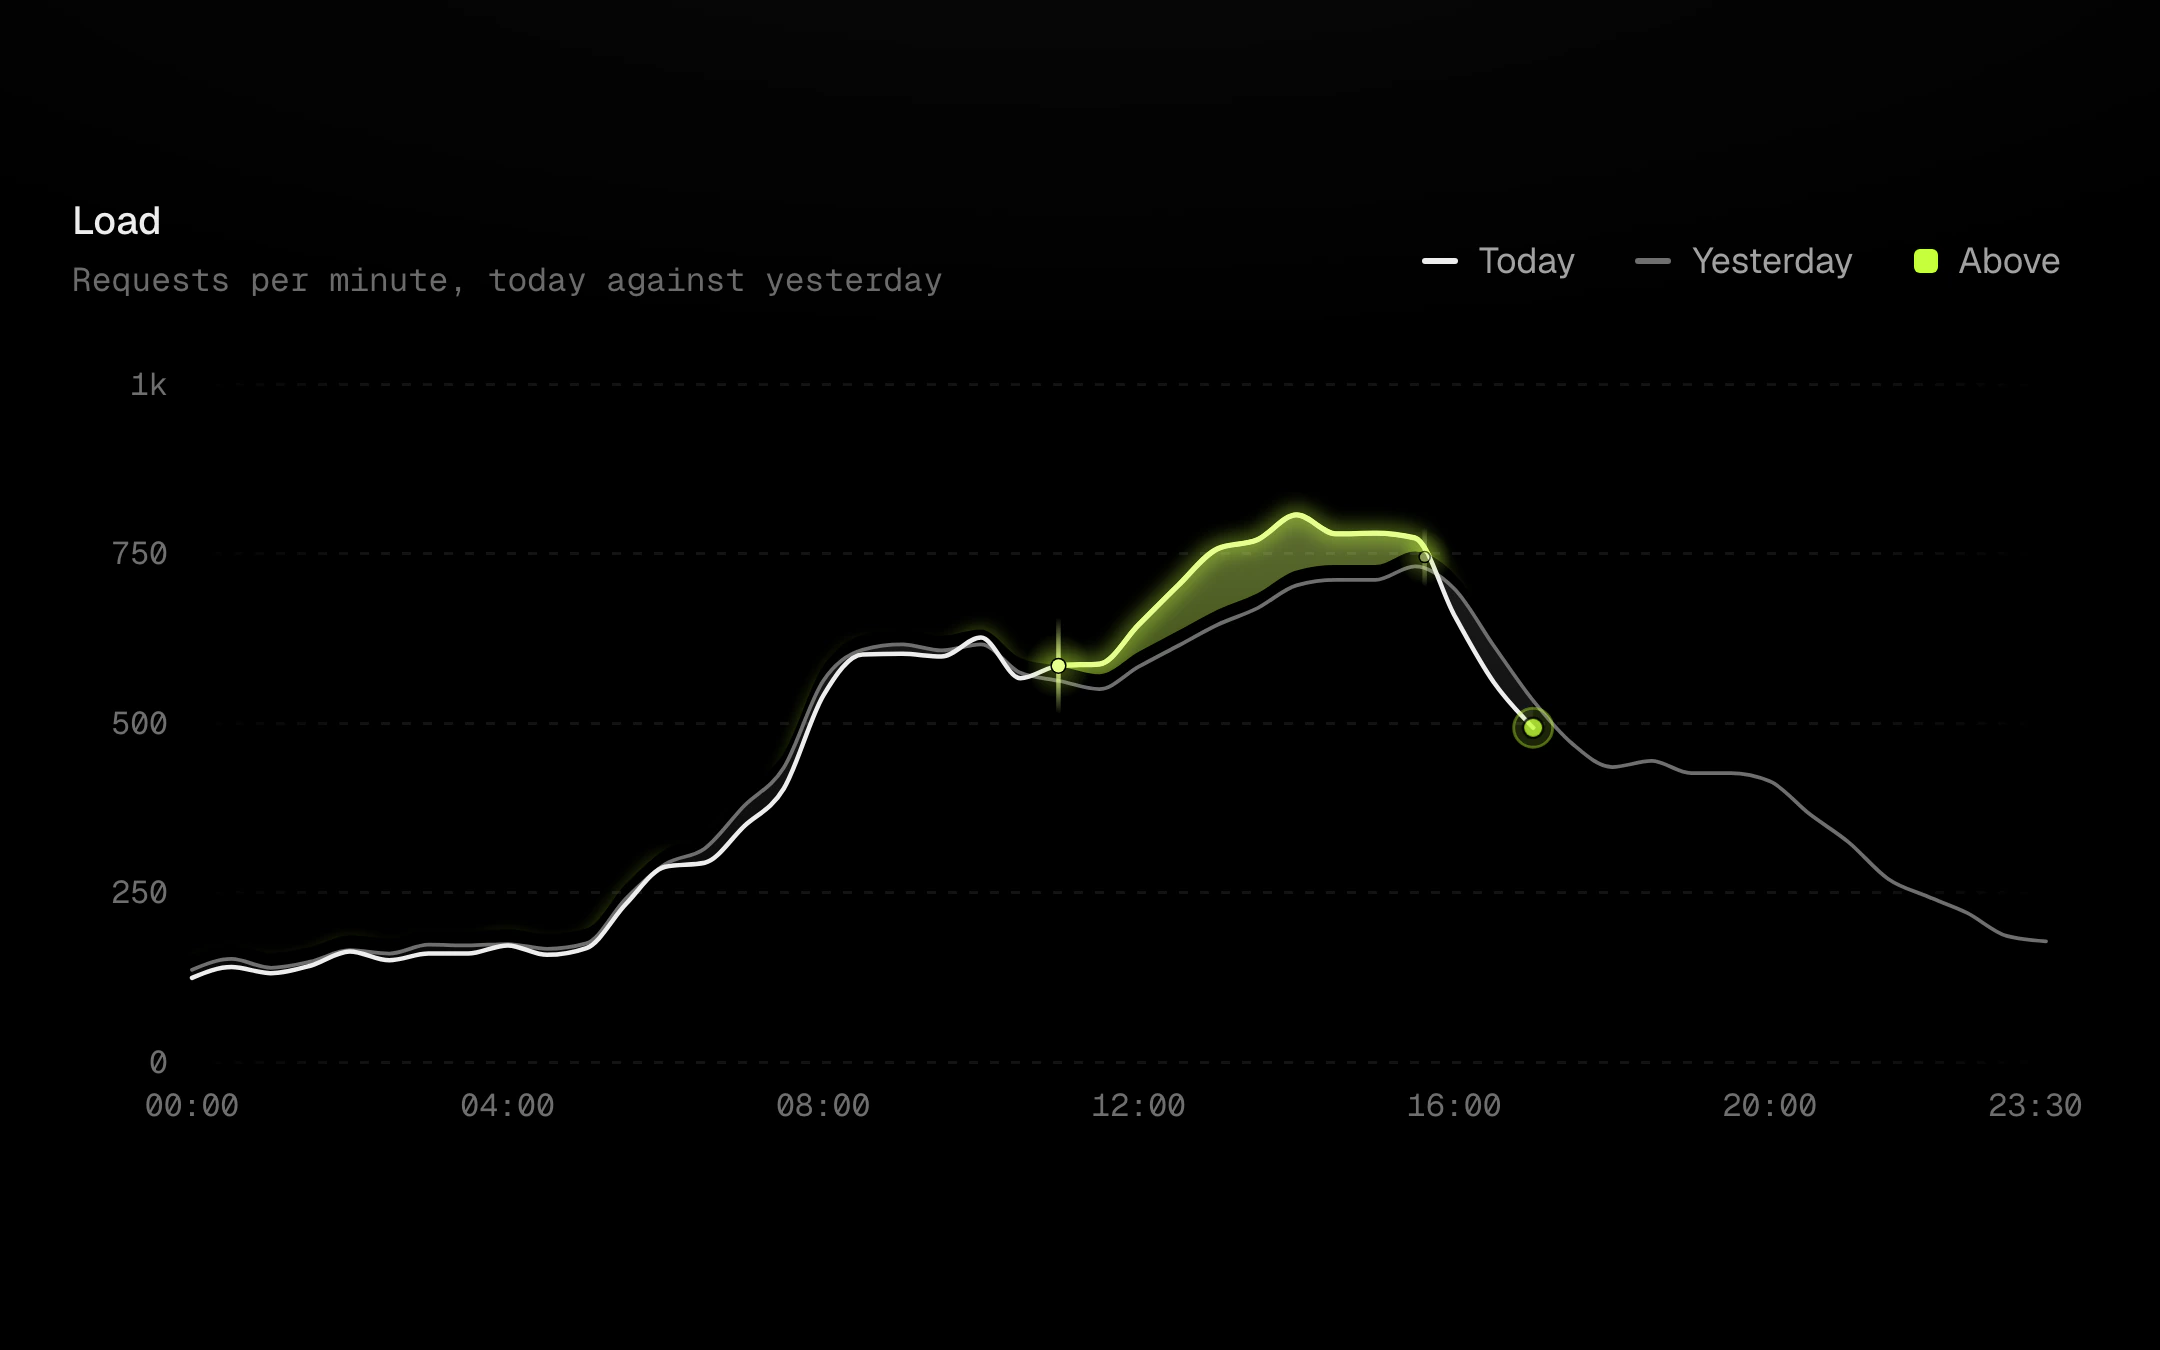
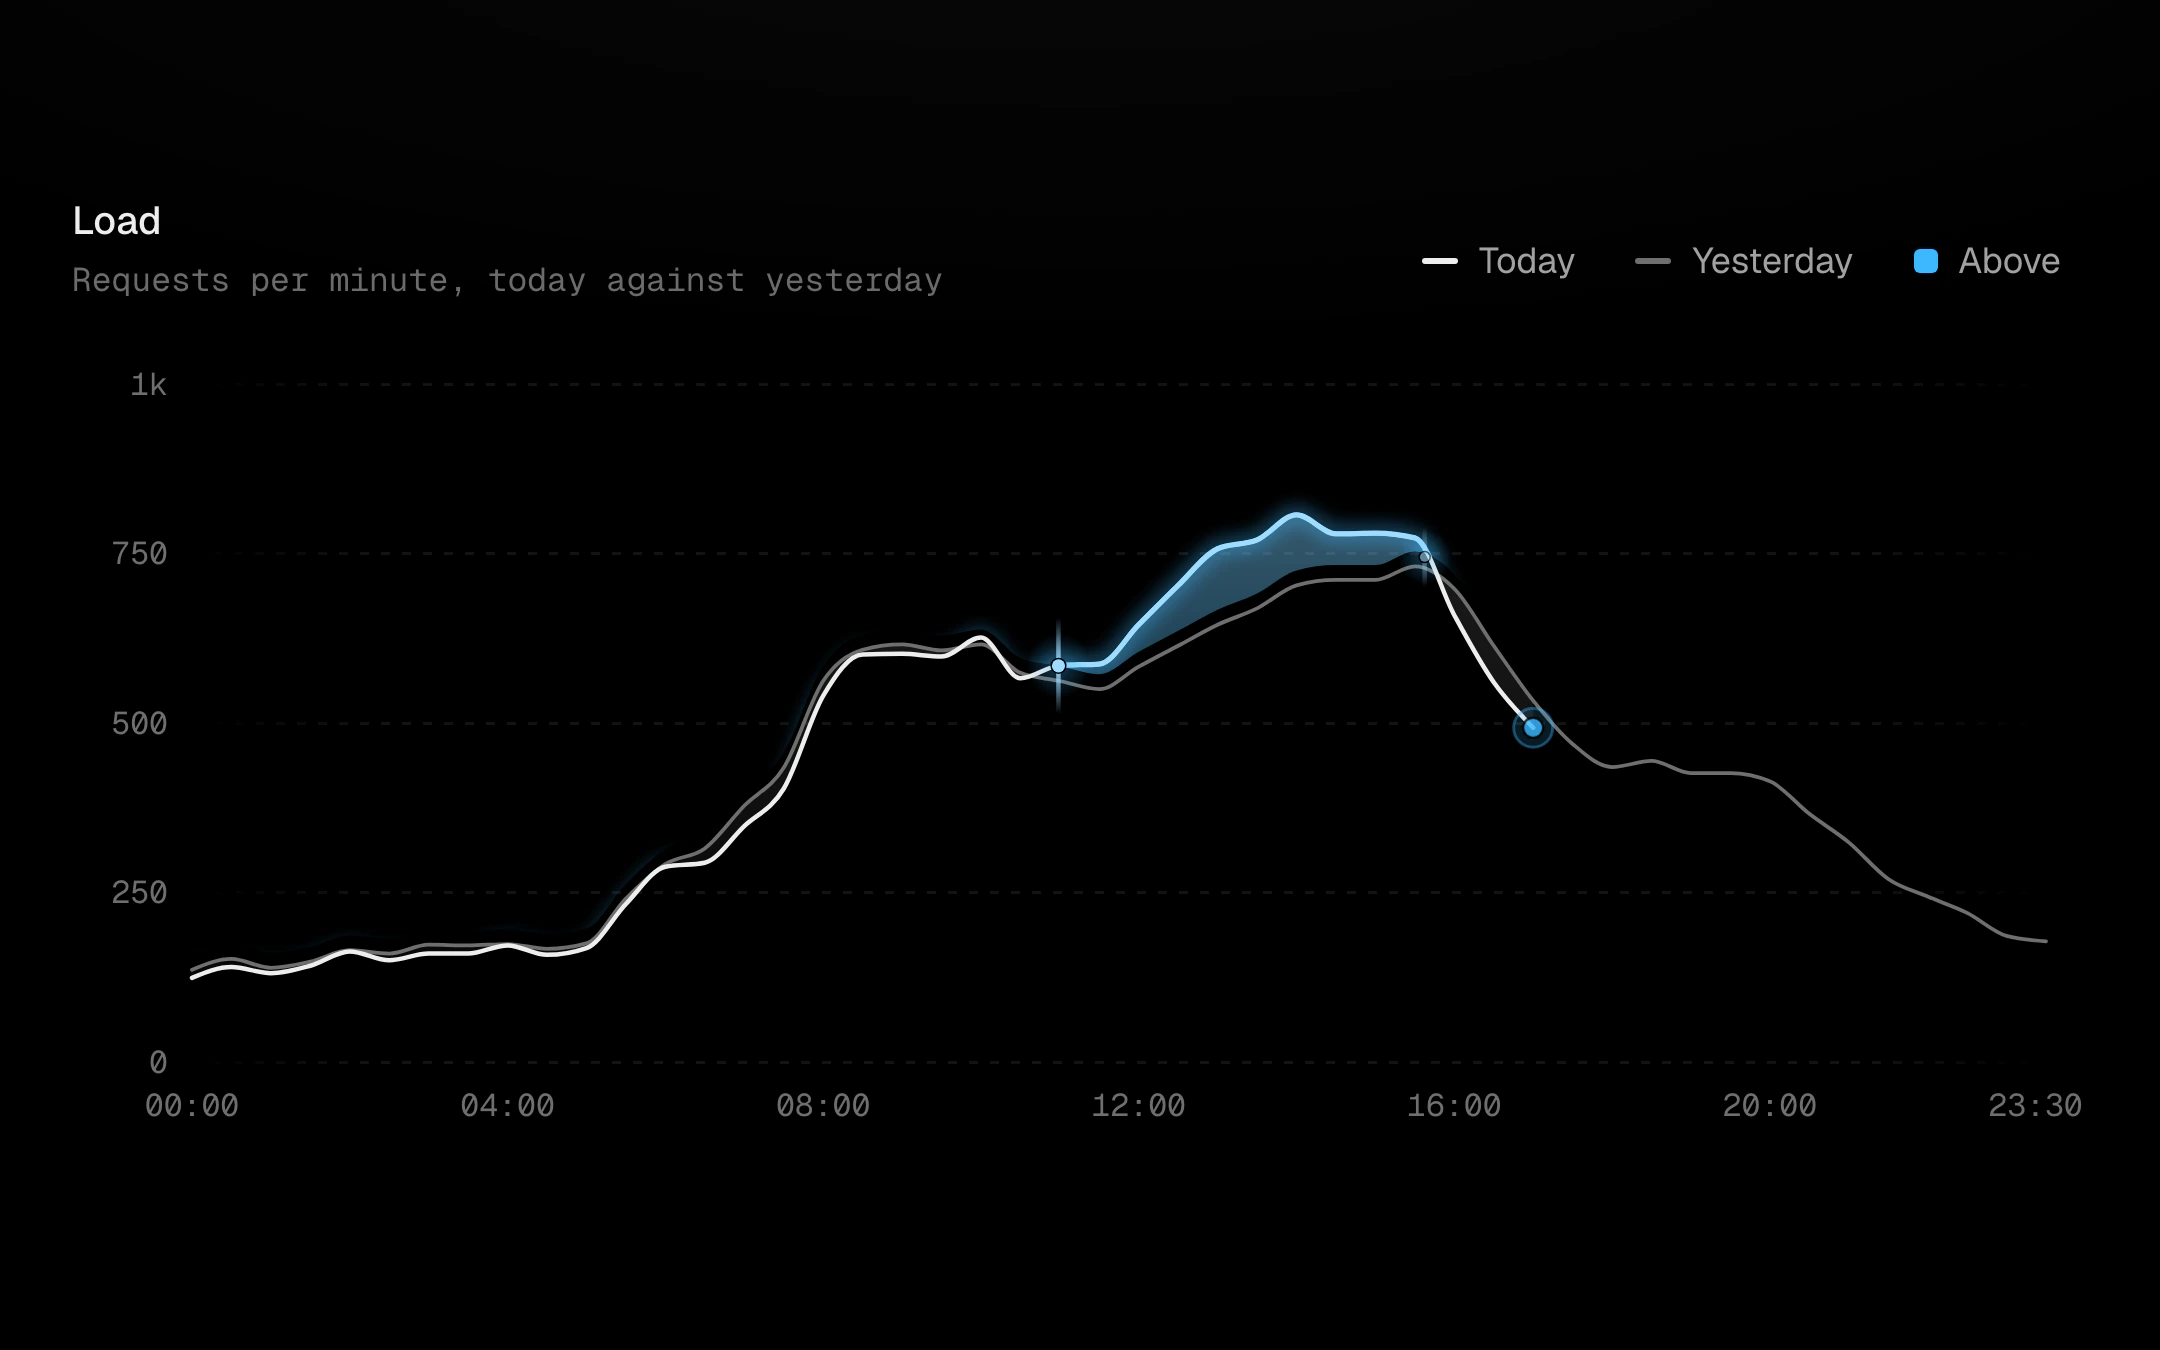
Today against yesterday.
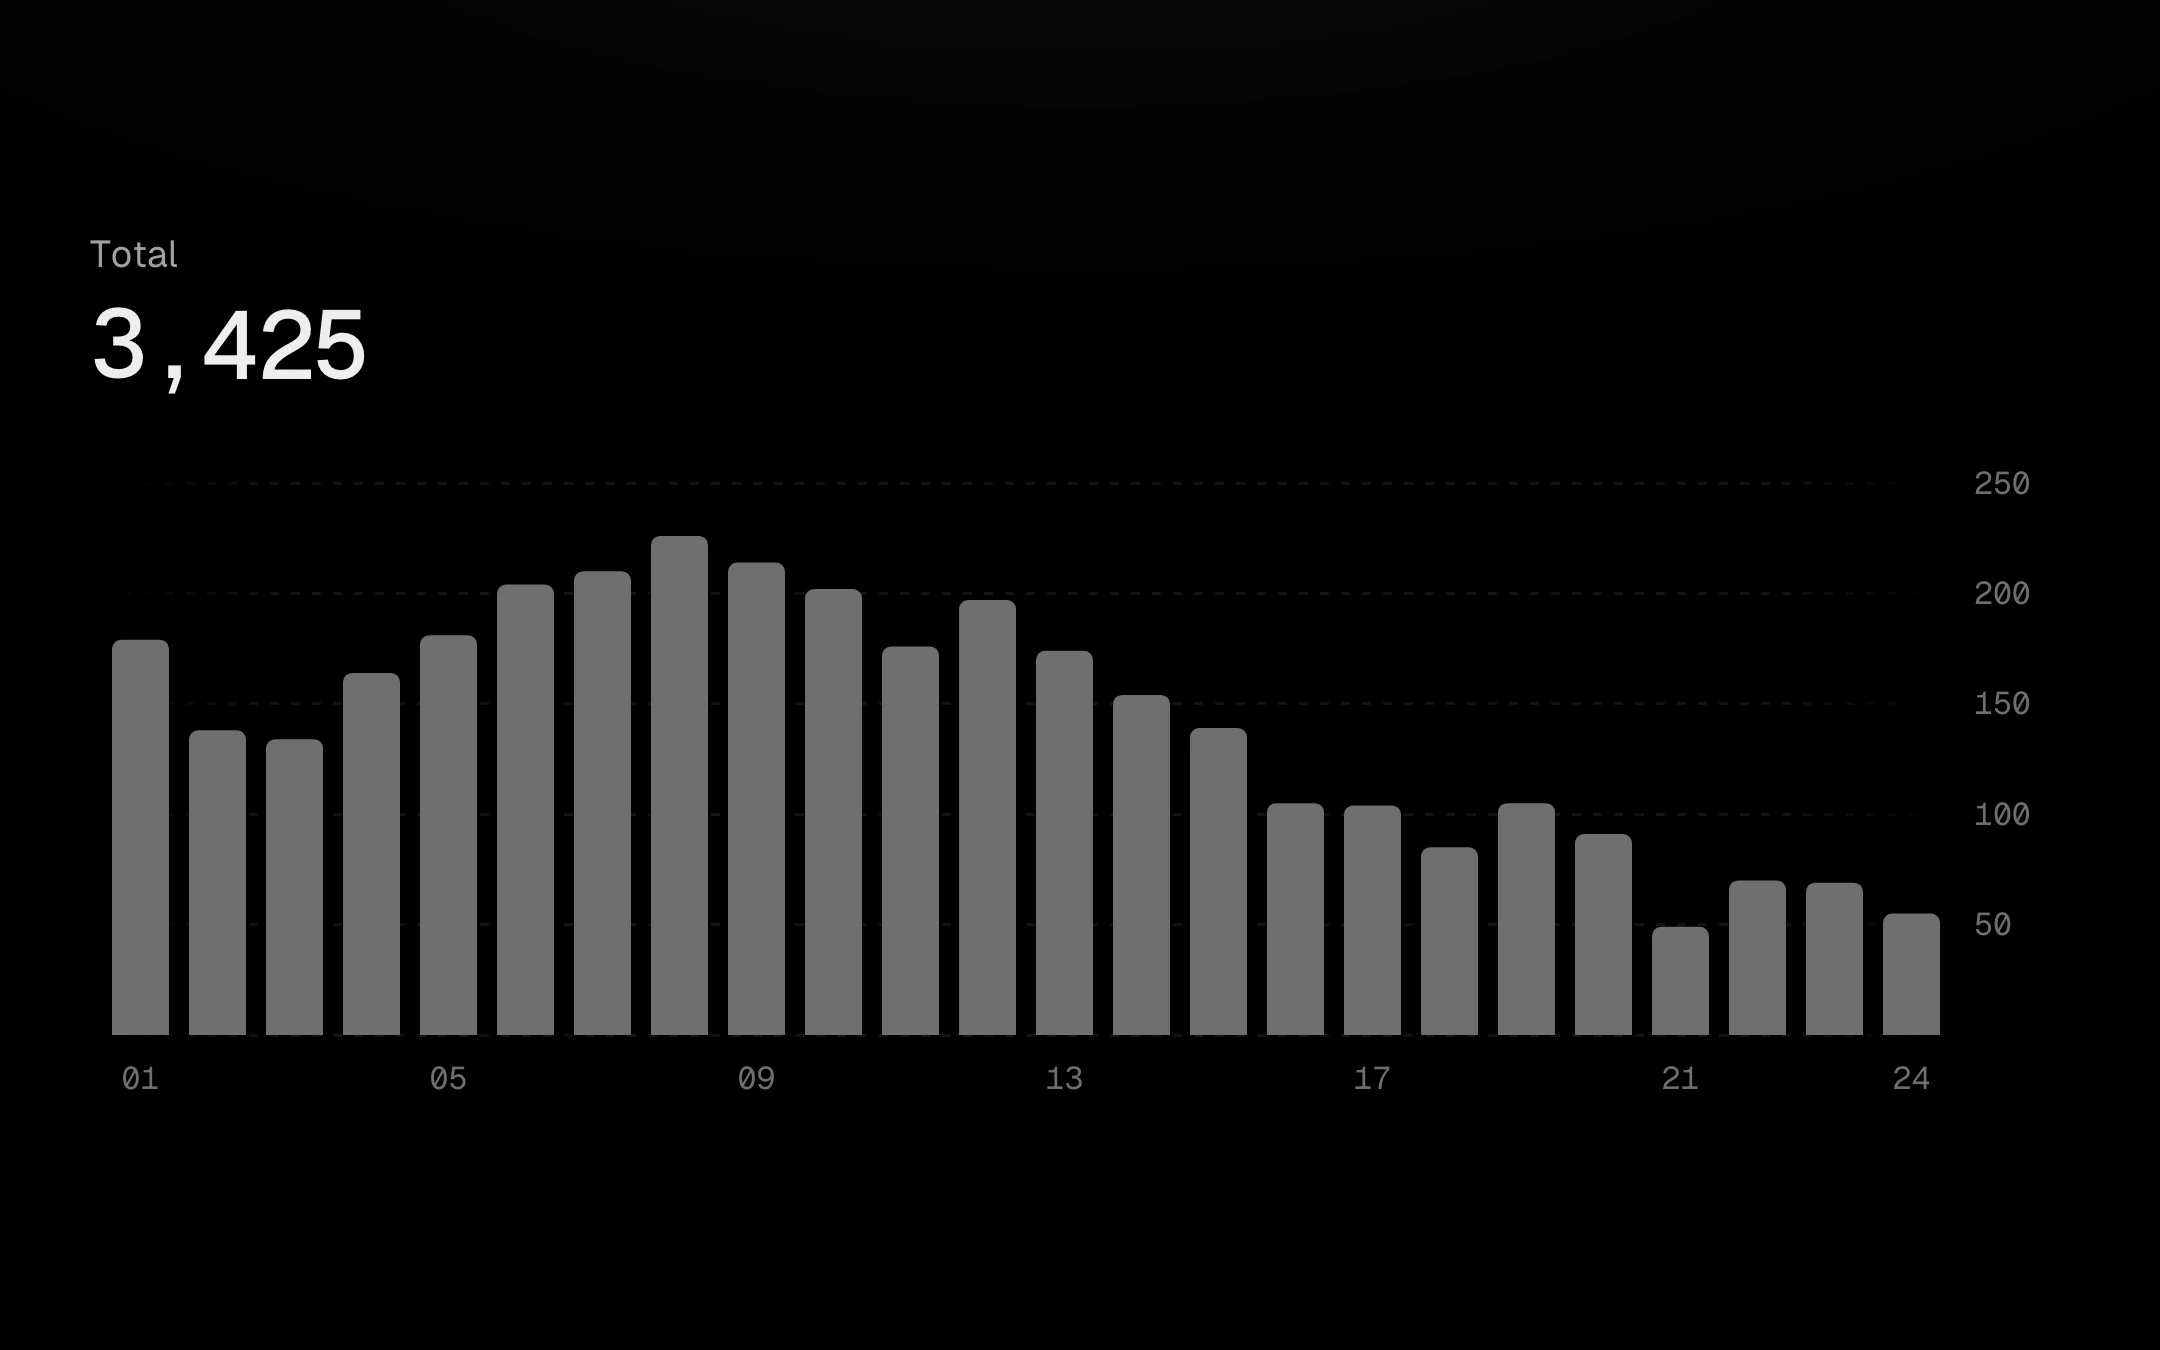
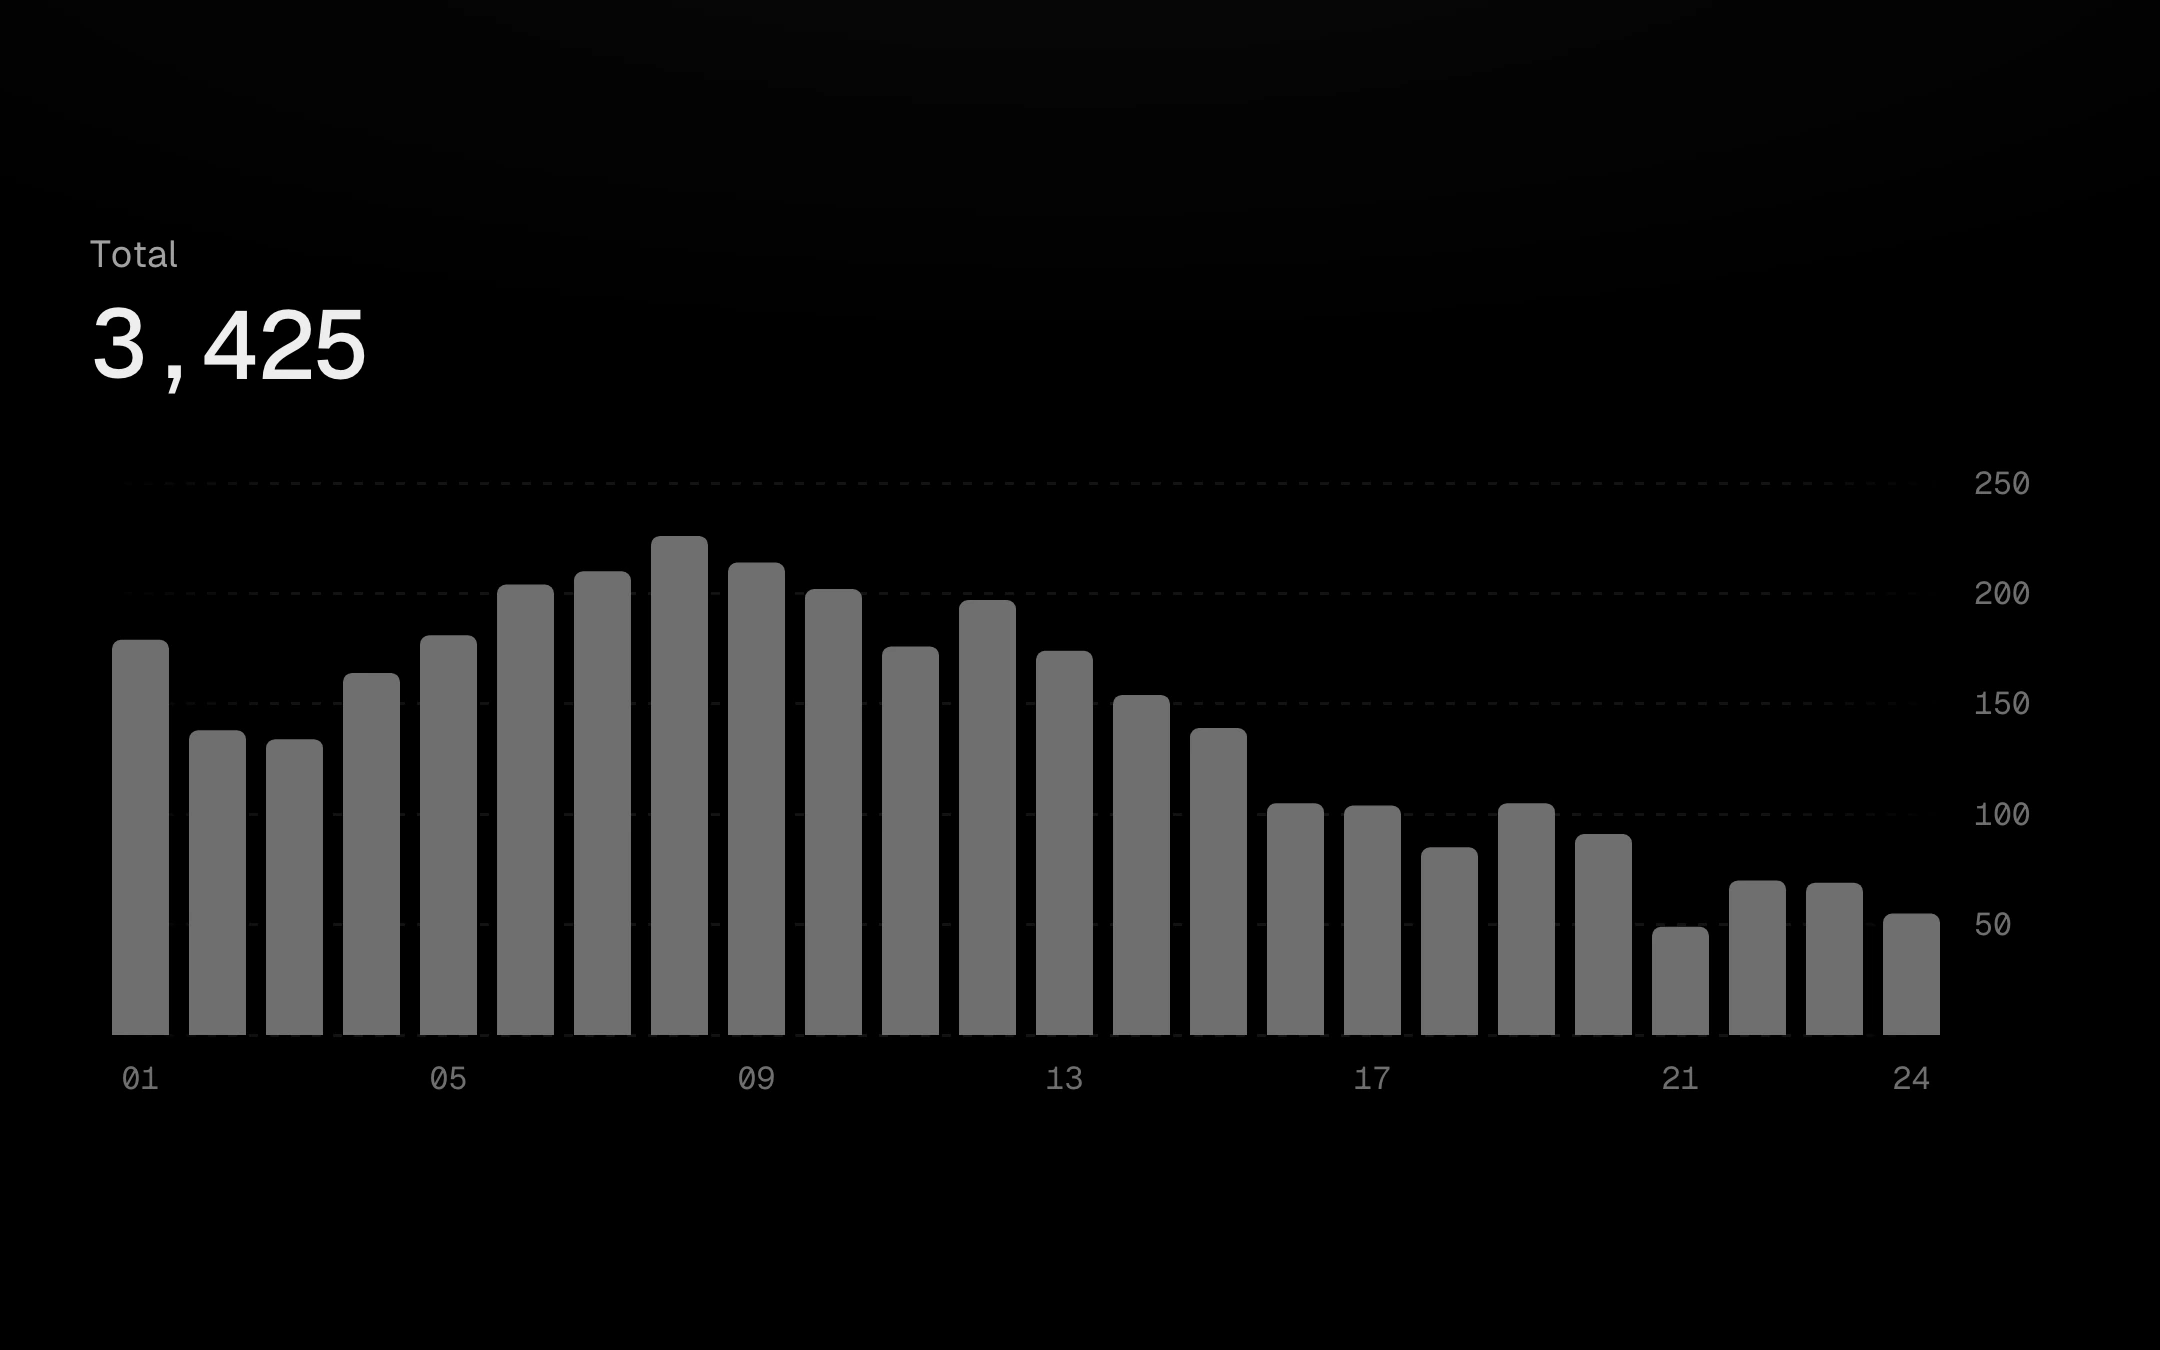
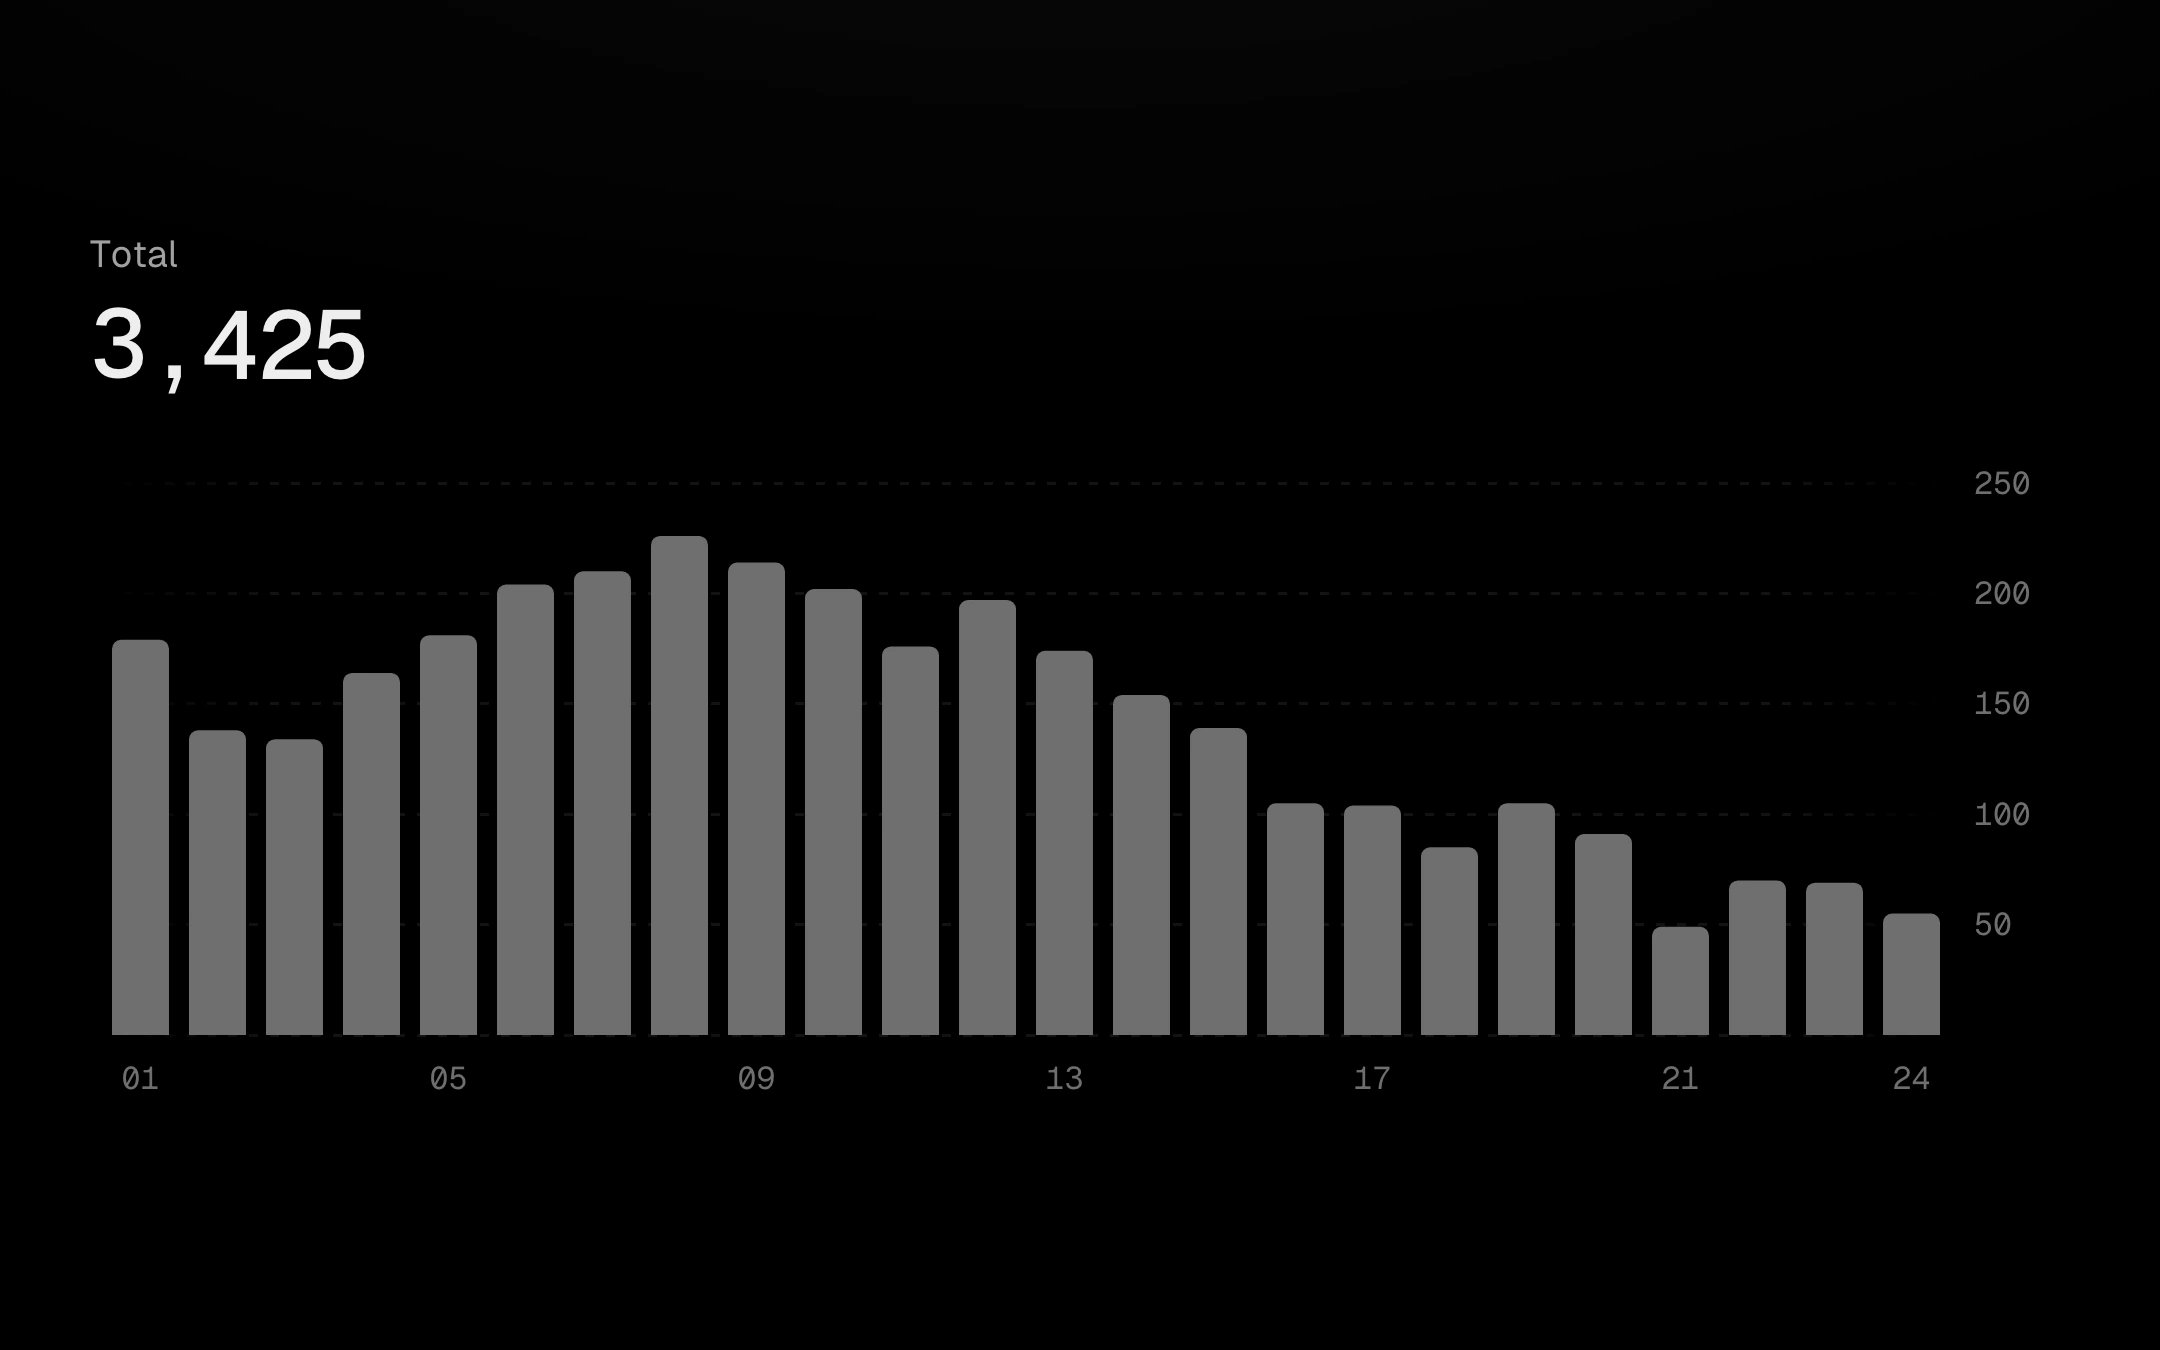
A bar chart you read by dragging across it.
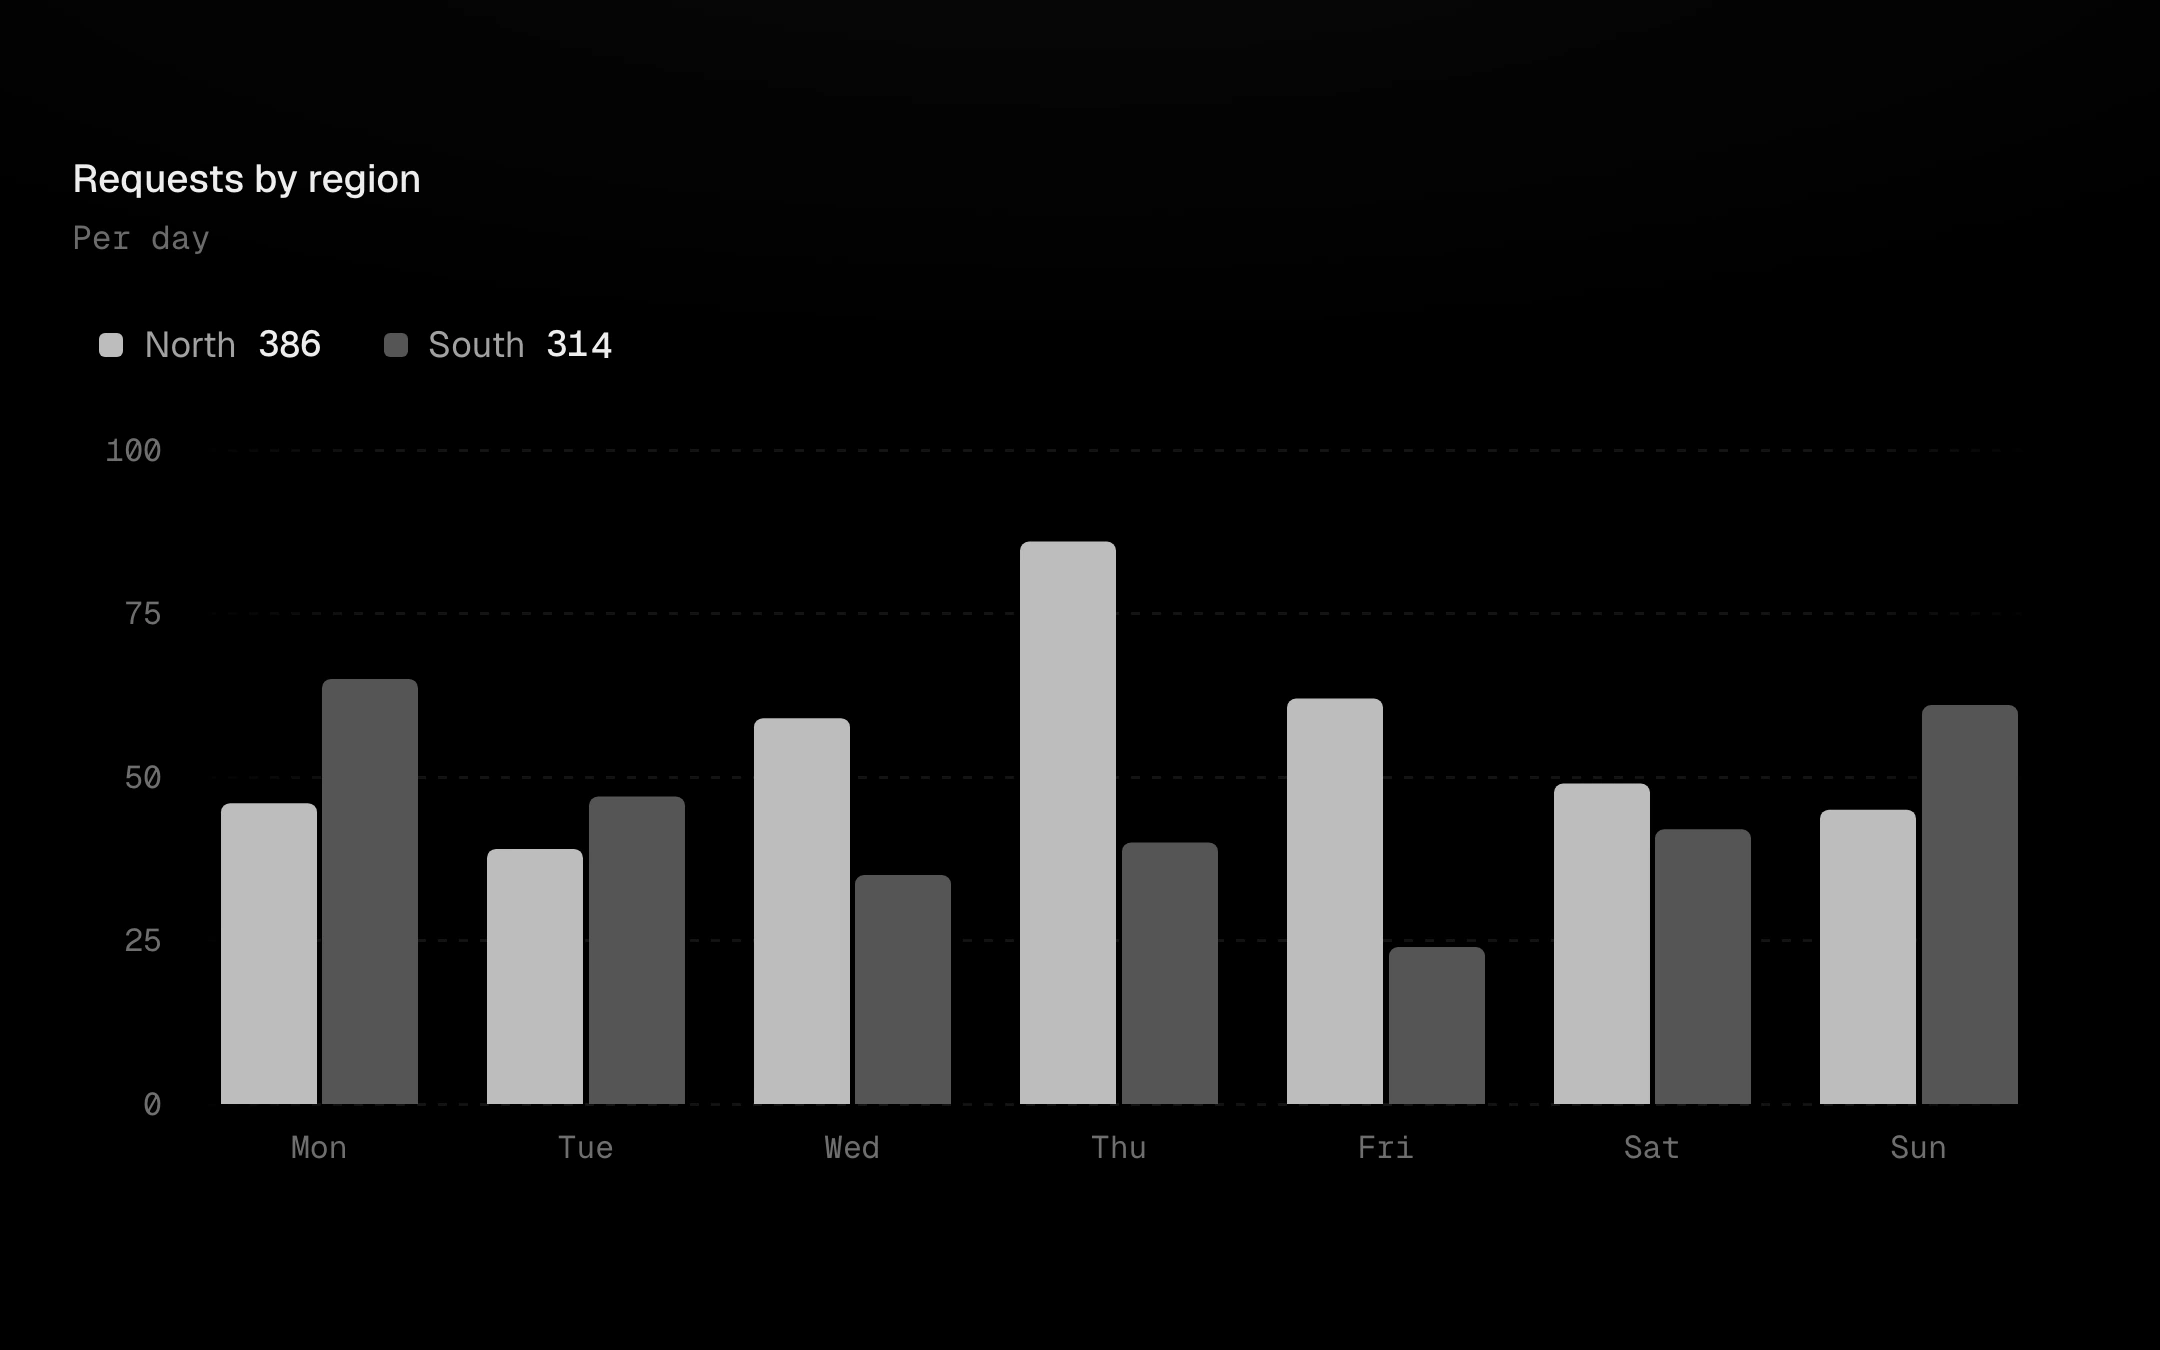
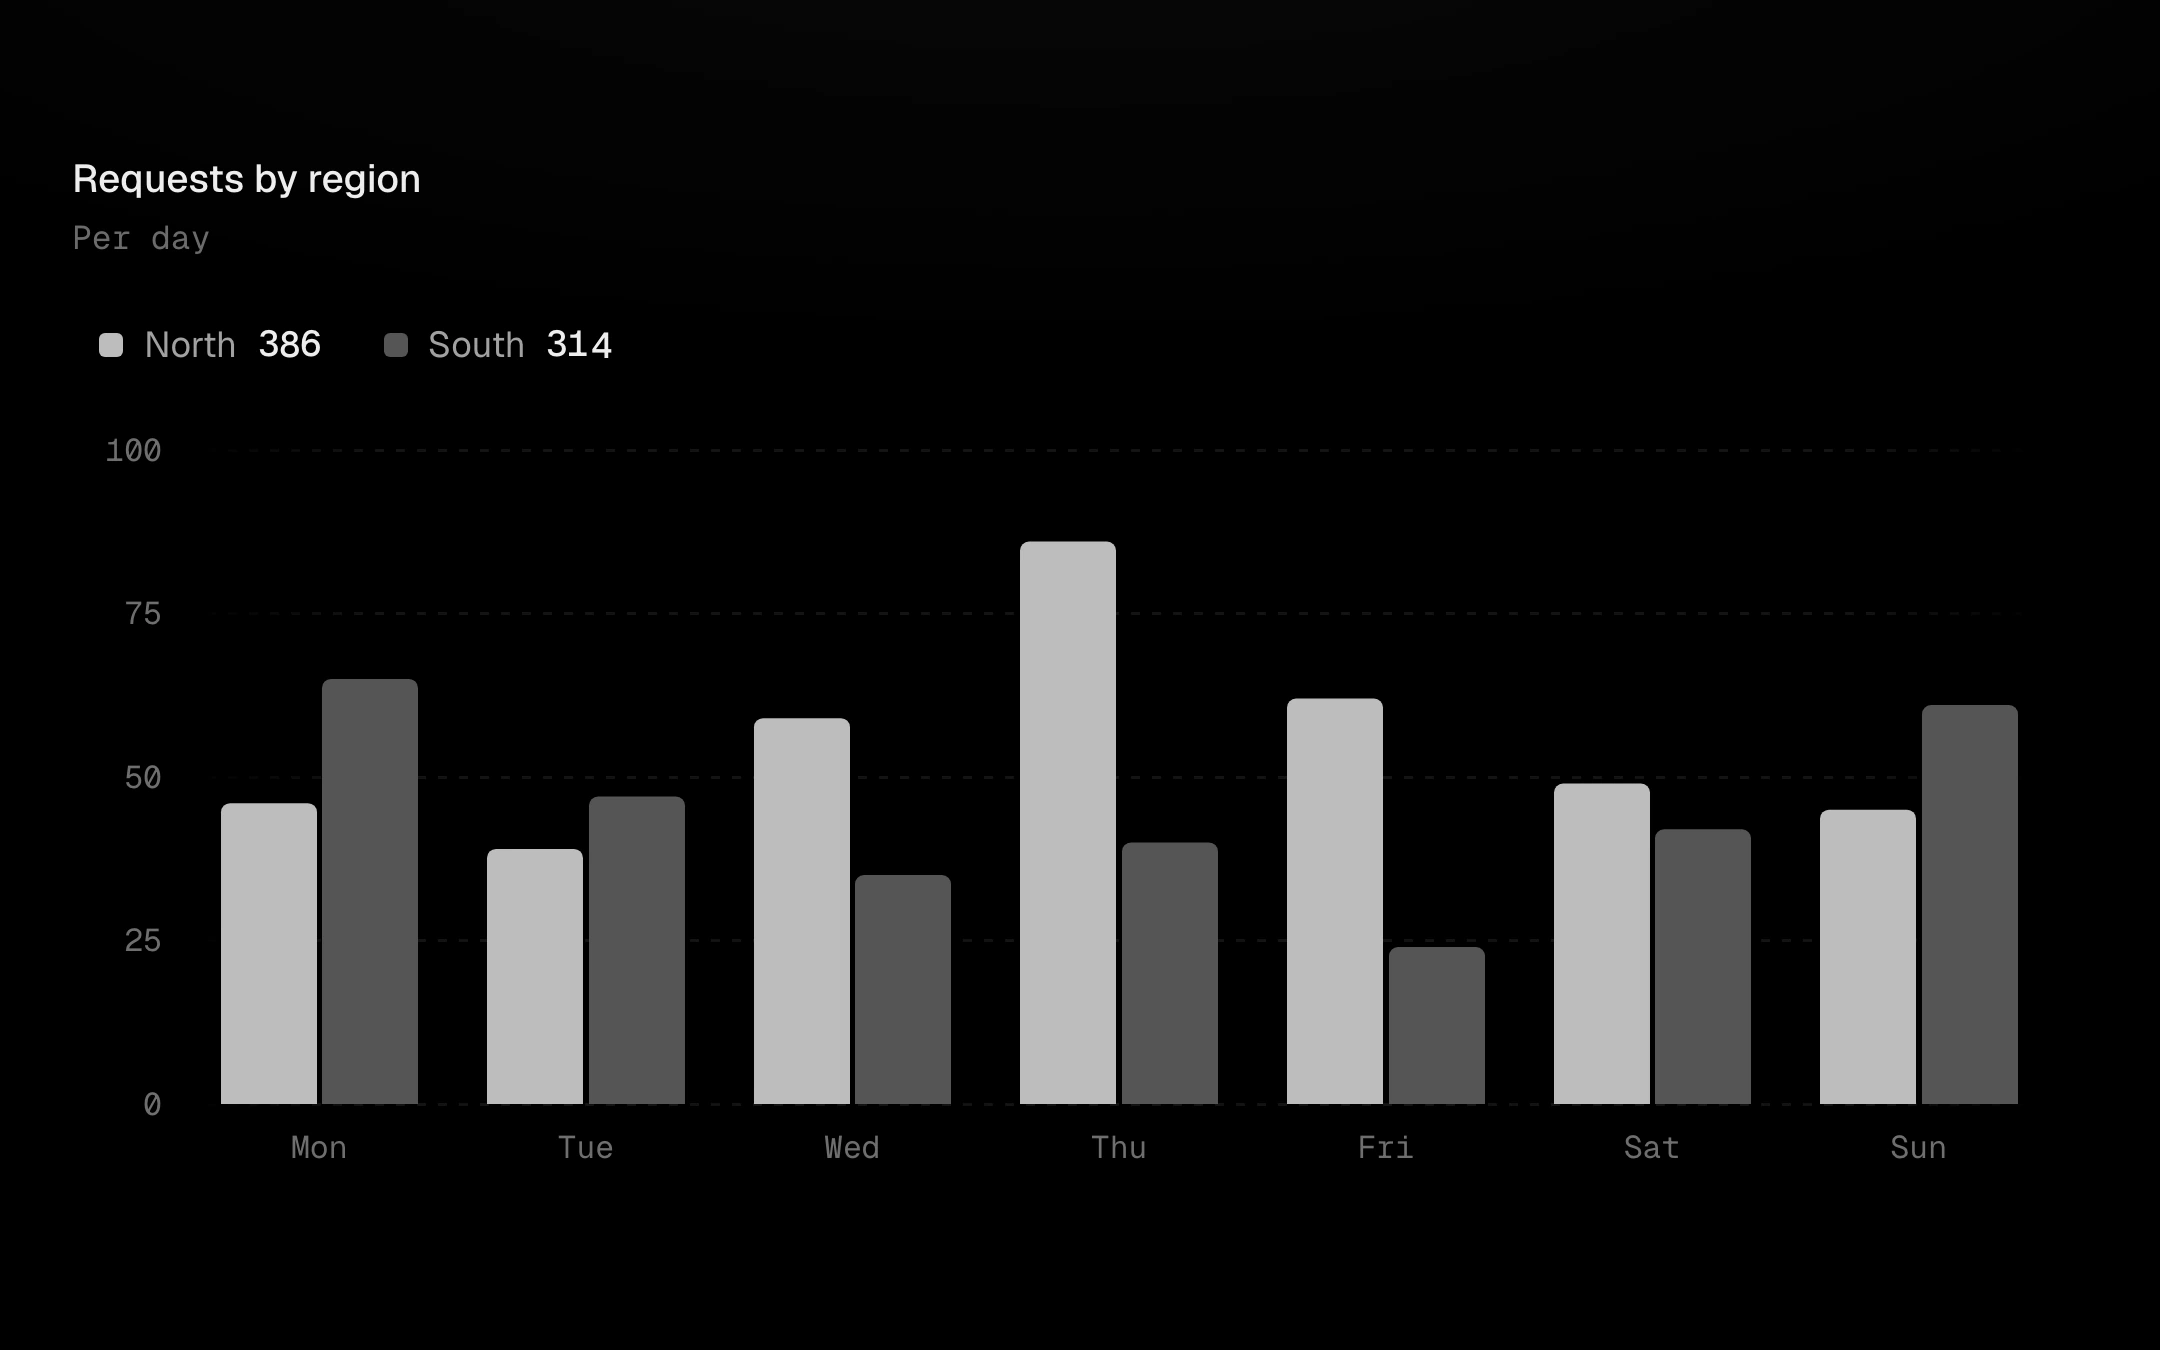
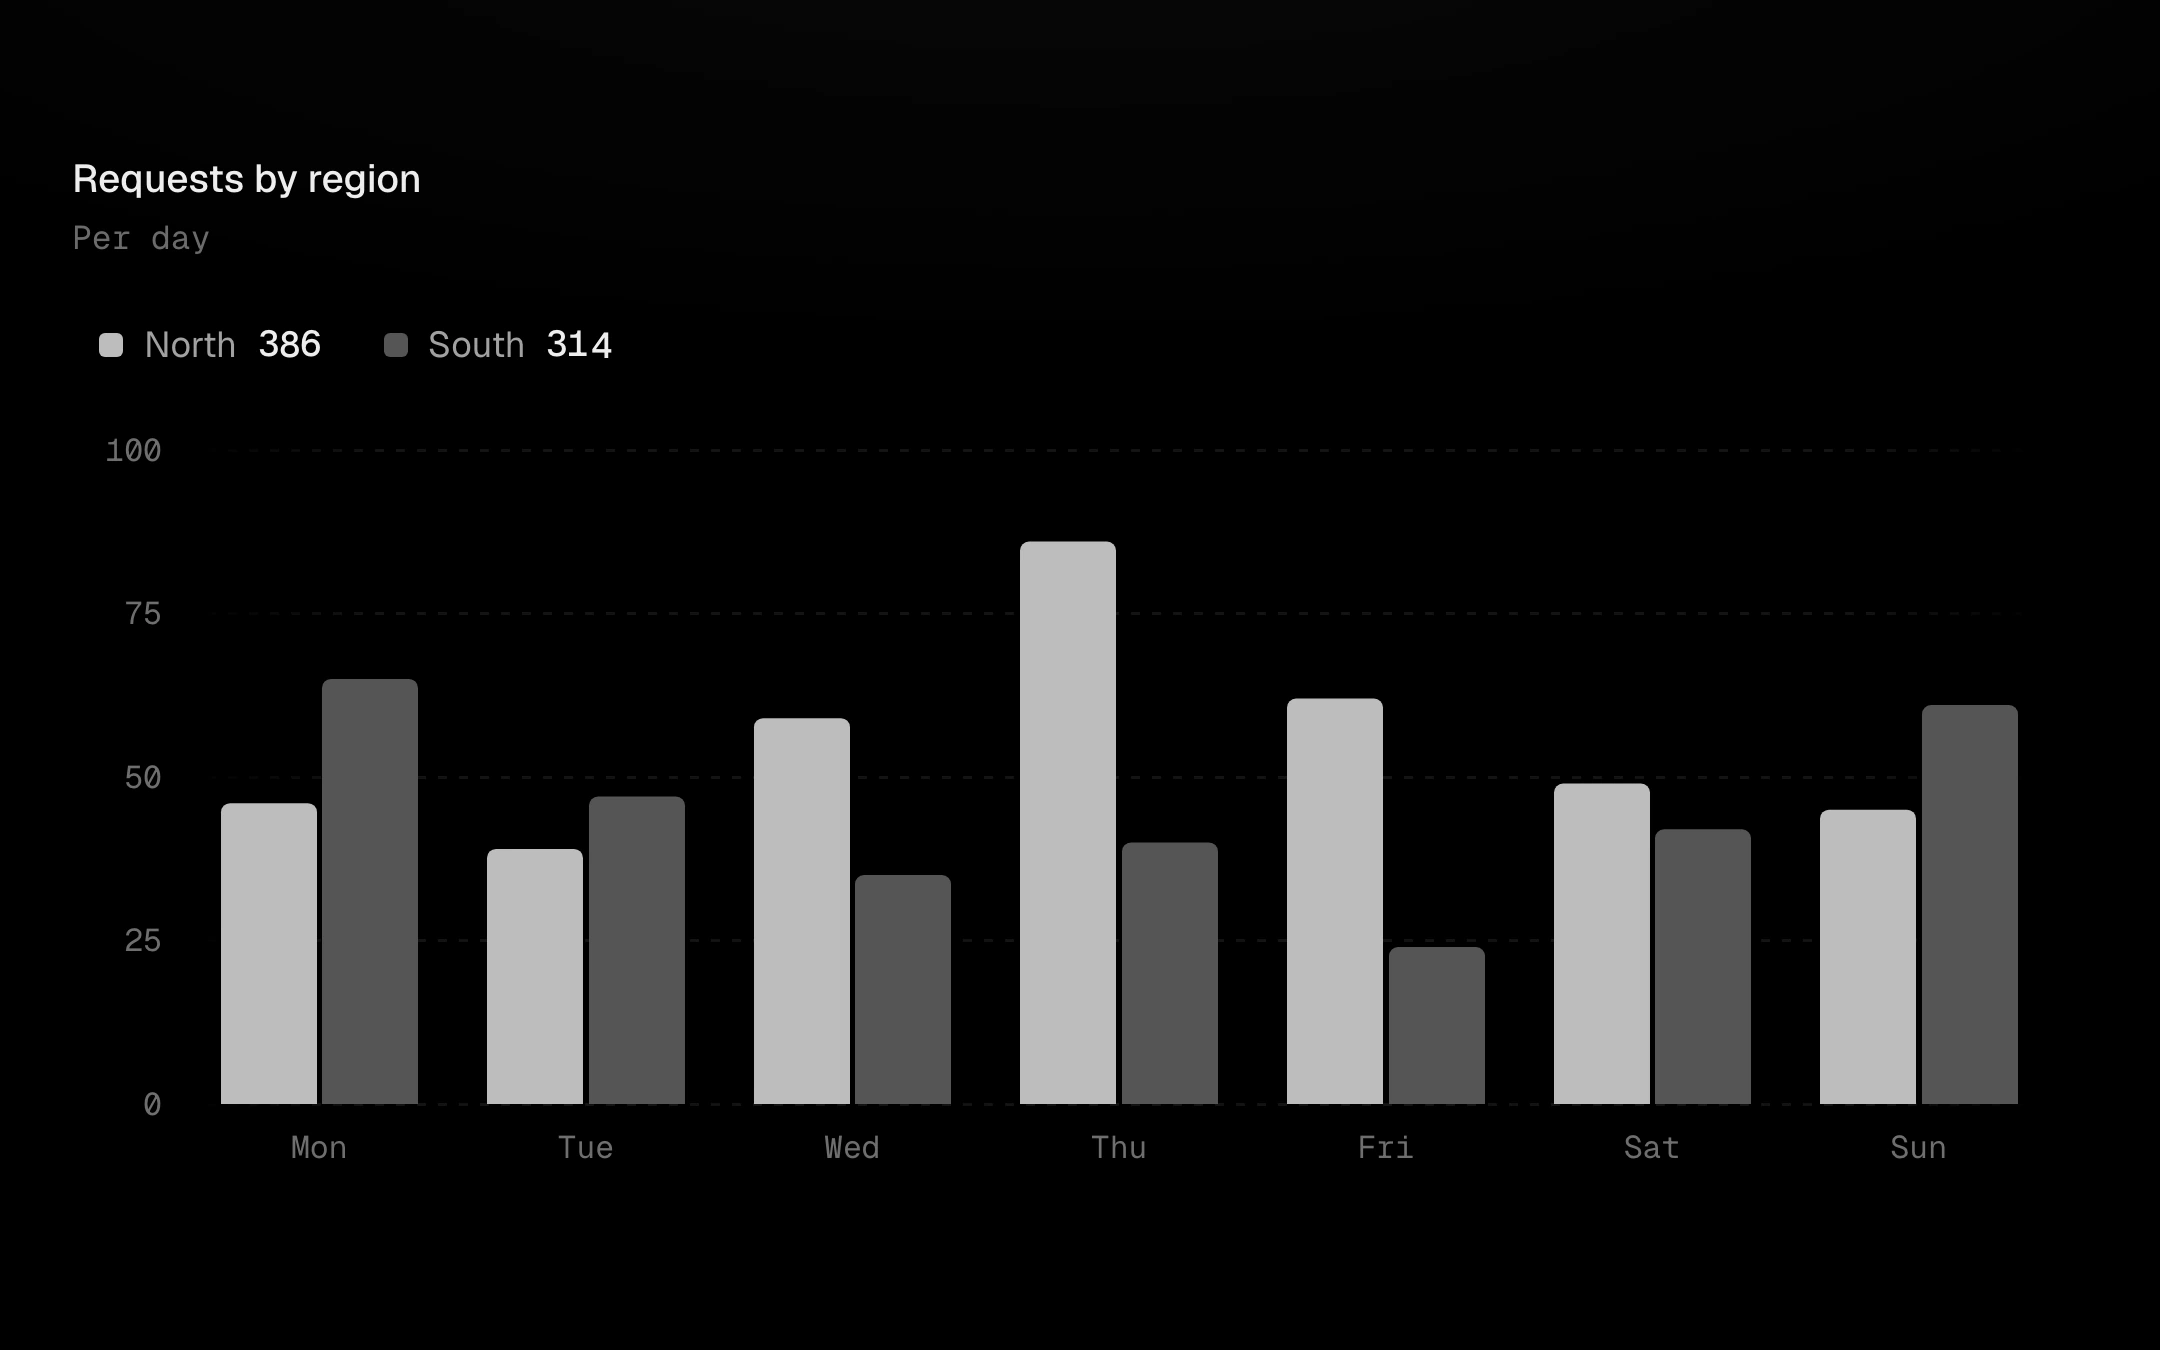
Vertical bars on the viz-kit chart: single, grouped or stacked, morphing between layouts bar by bar on staggered springs.
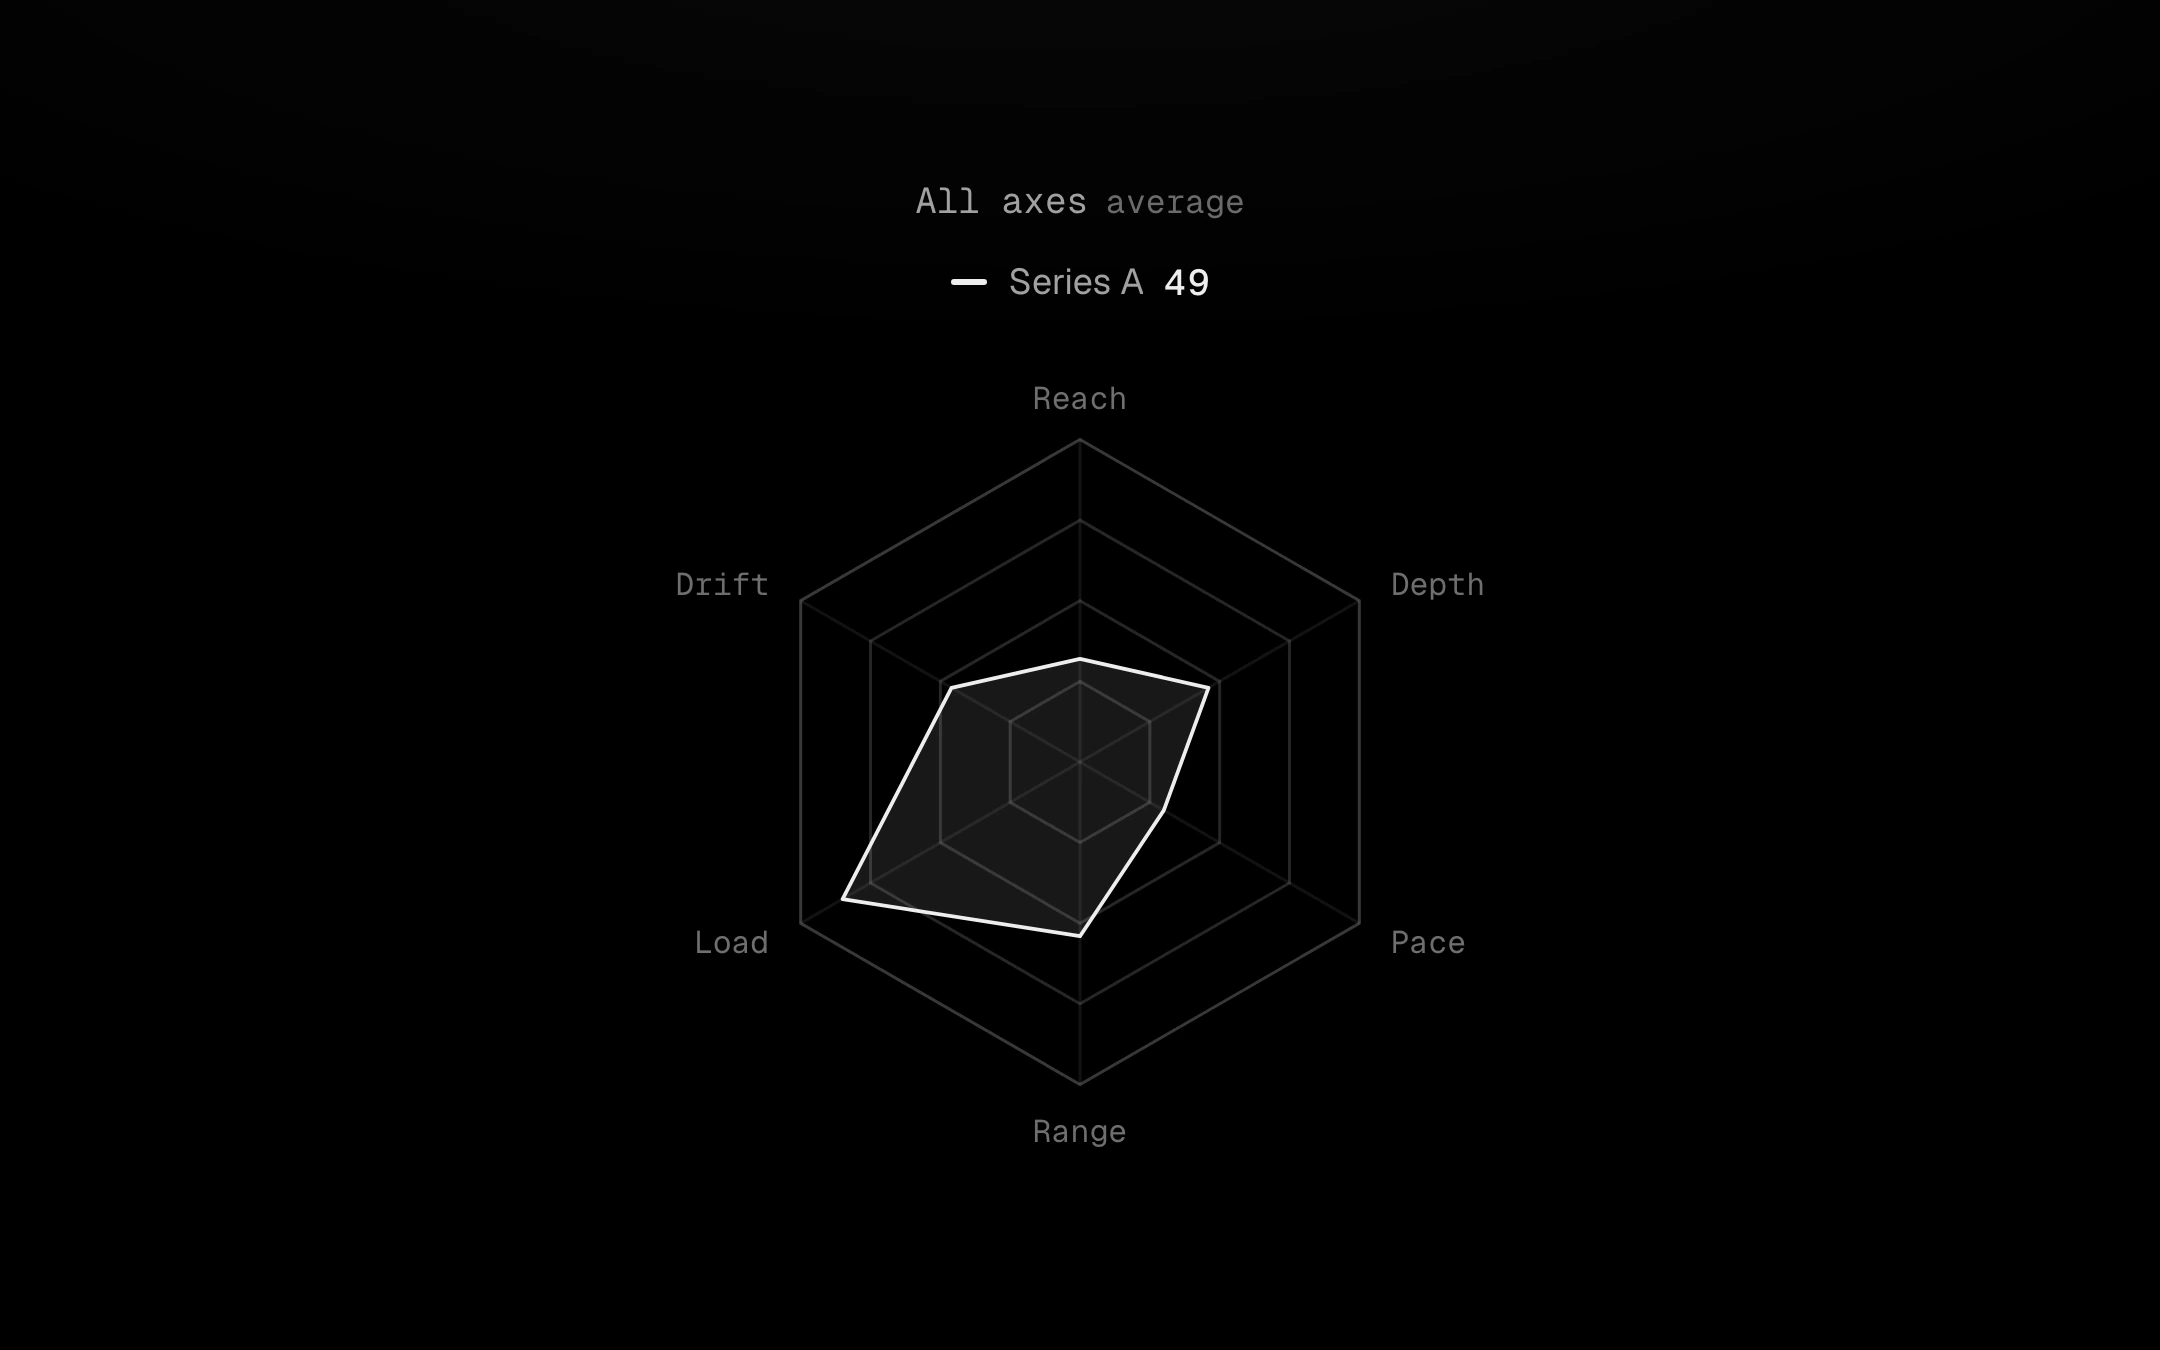
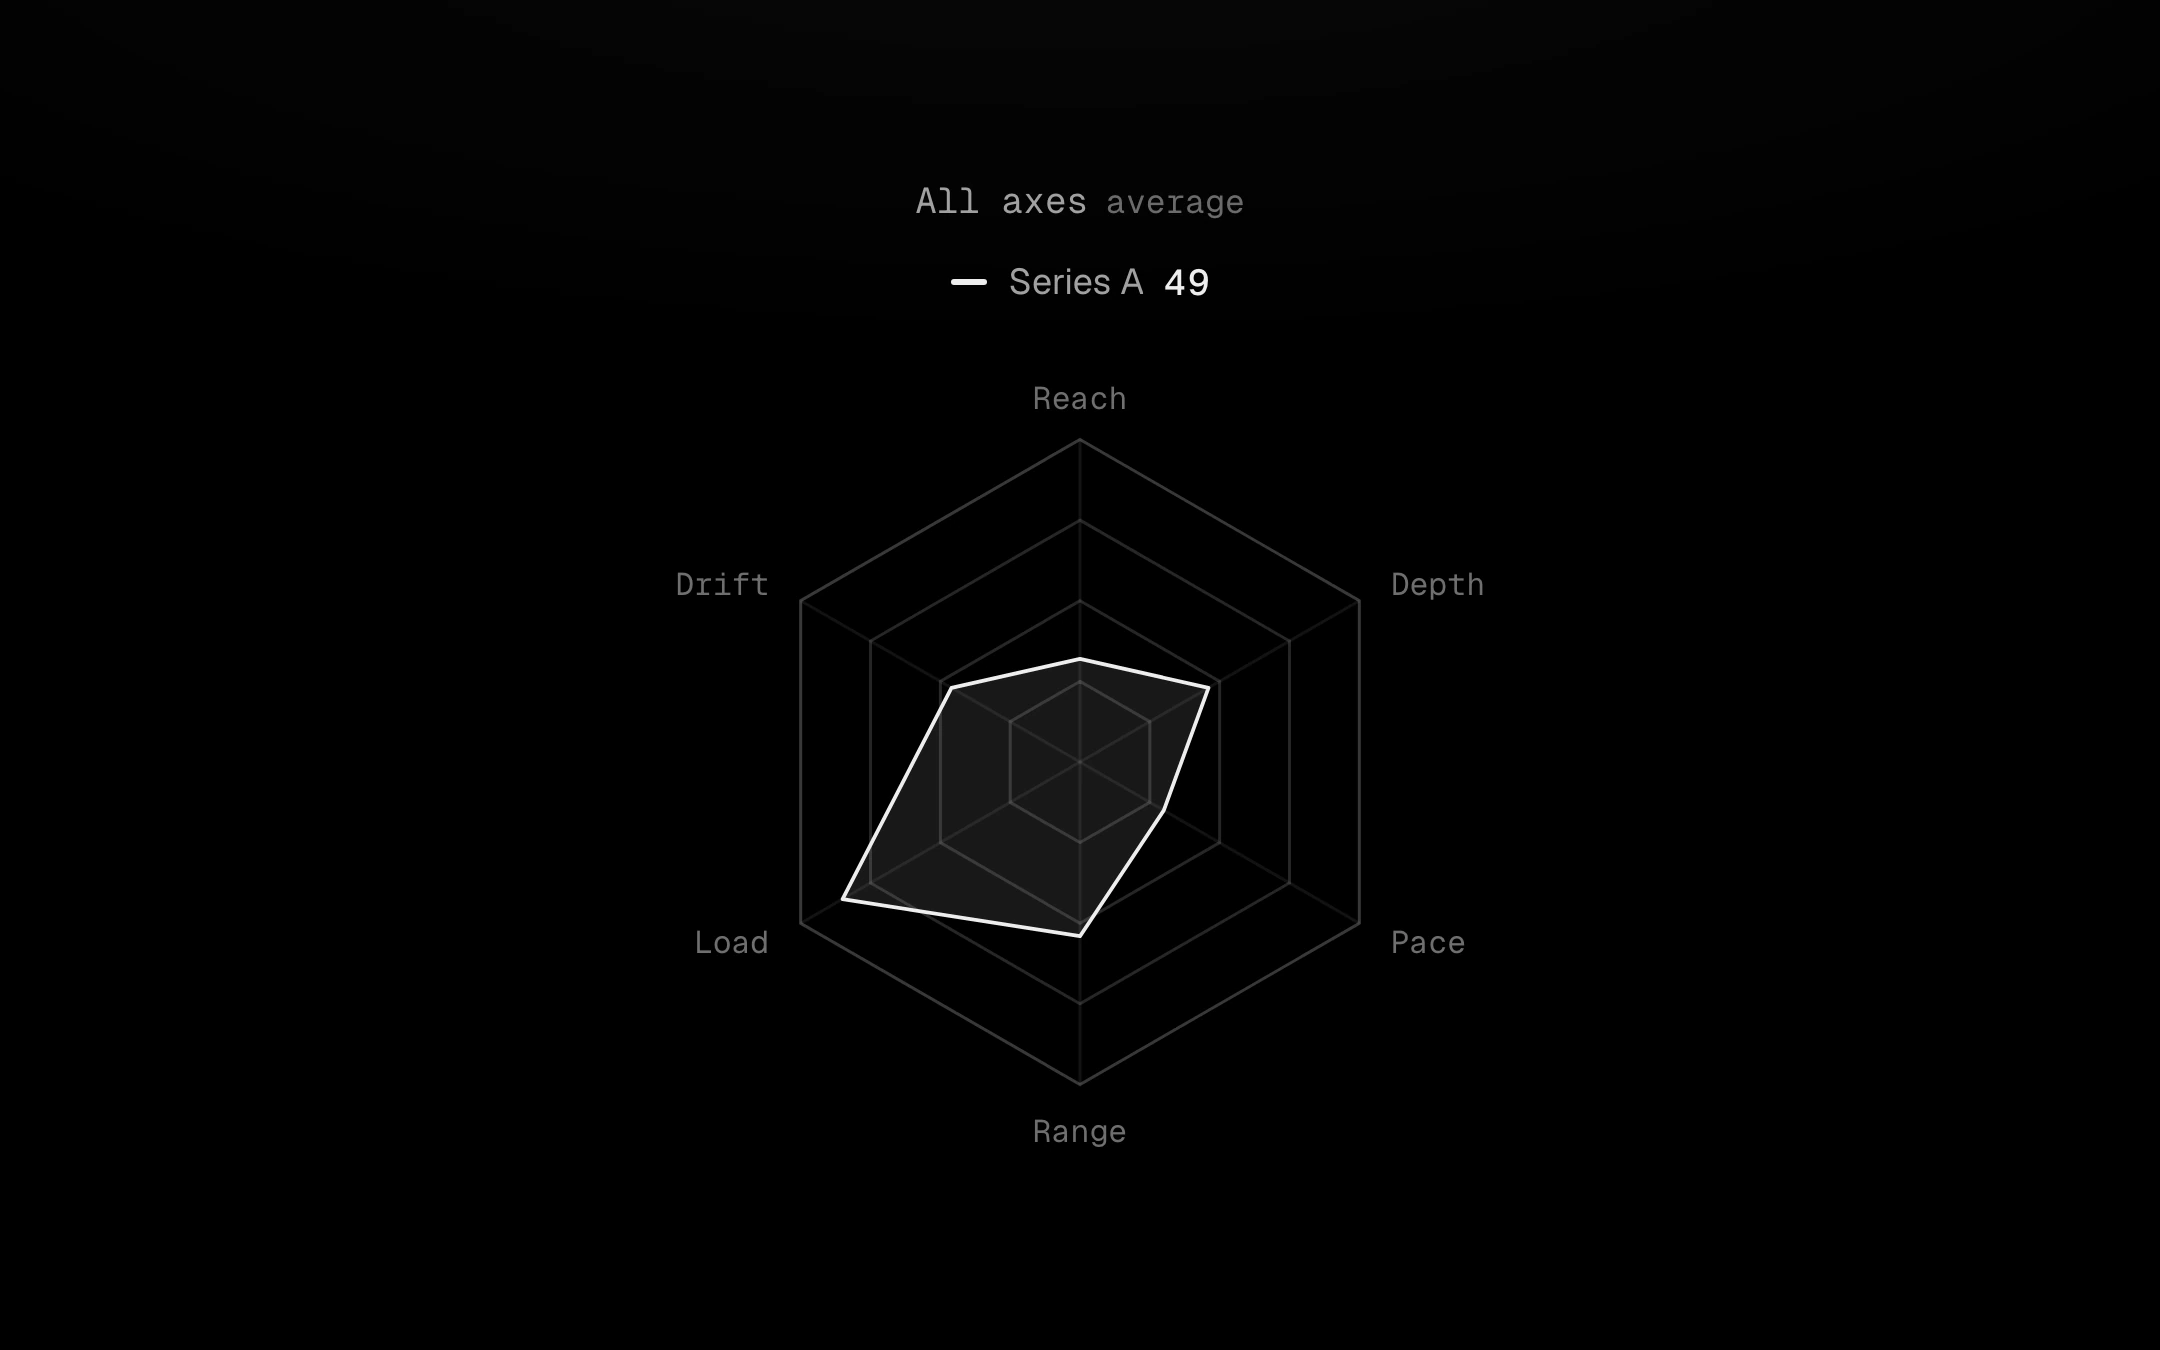
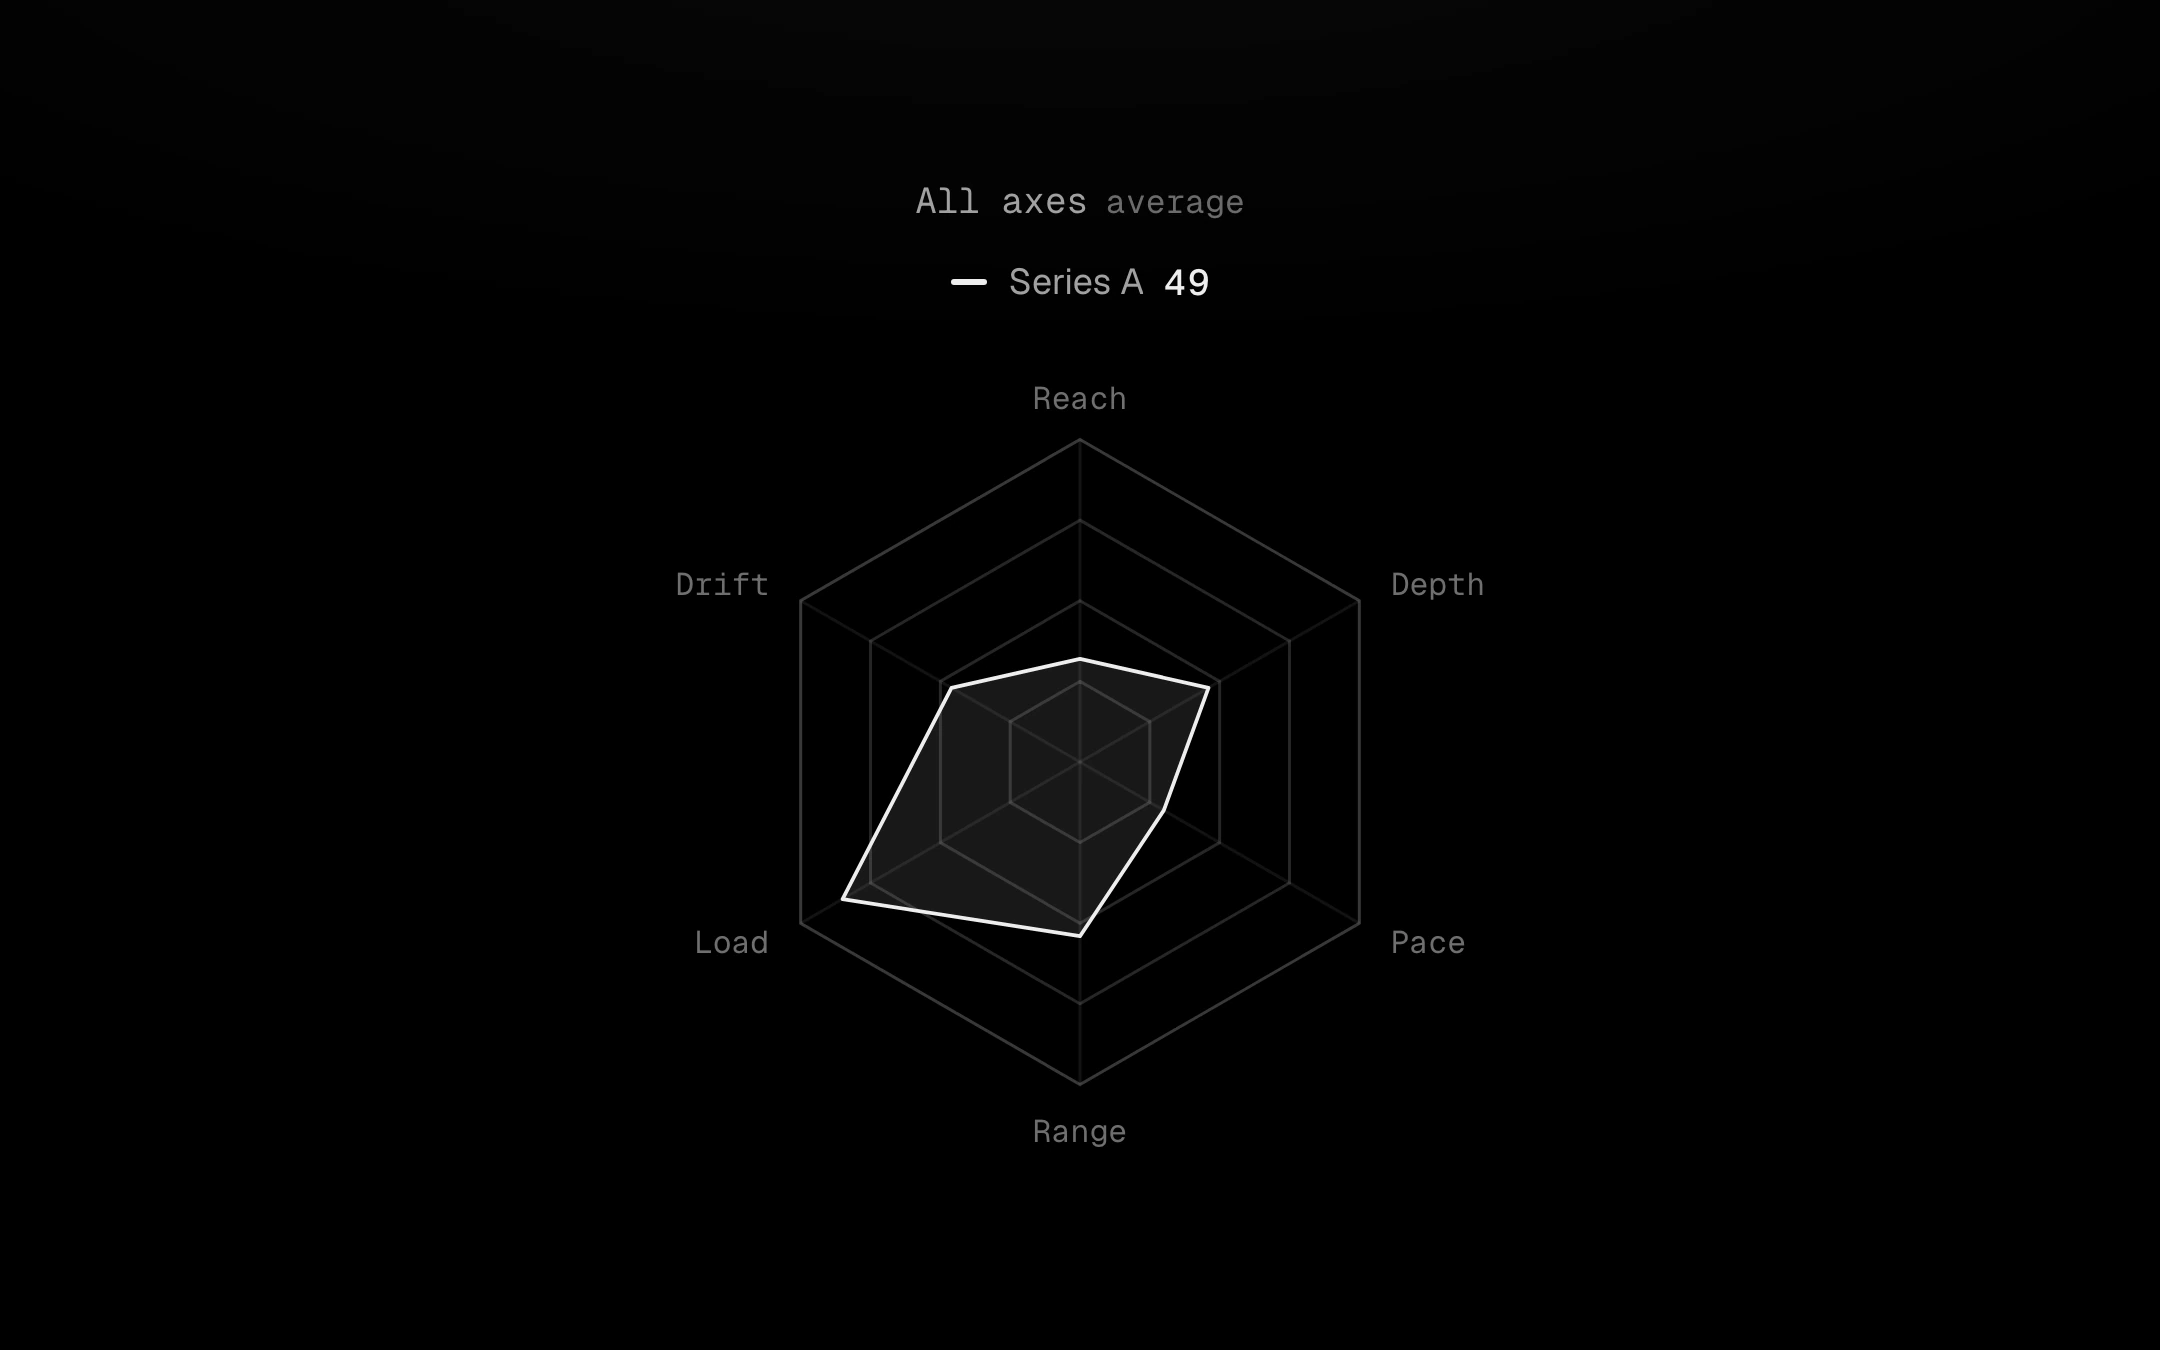
A web of hairline rings and spokes holding up to four series polygons.
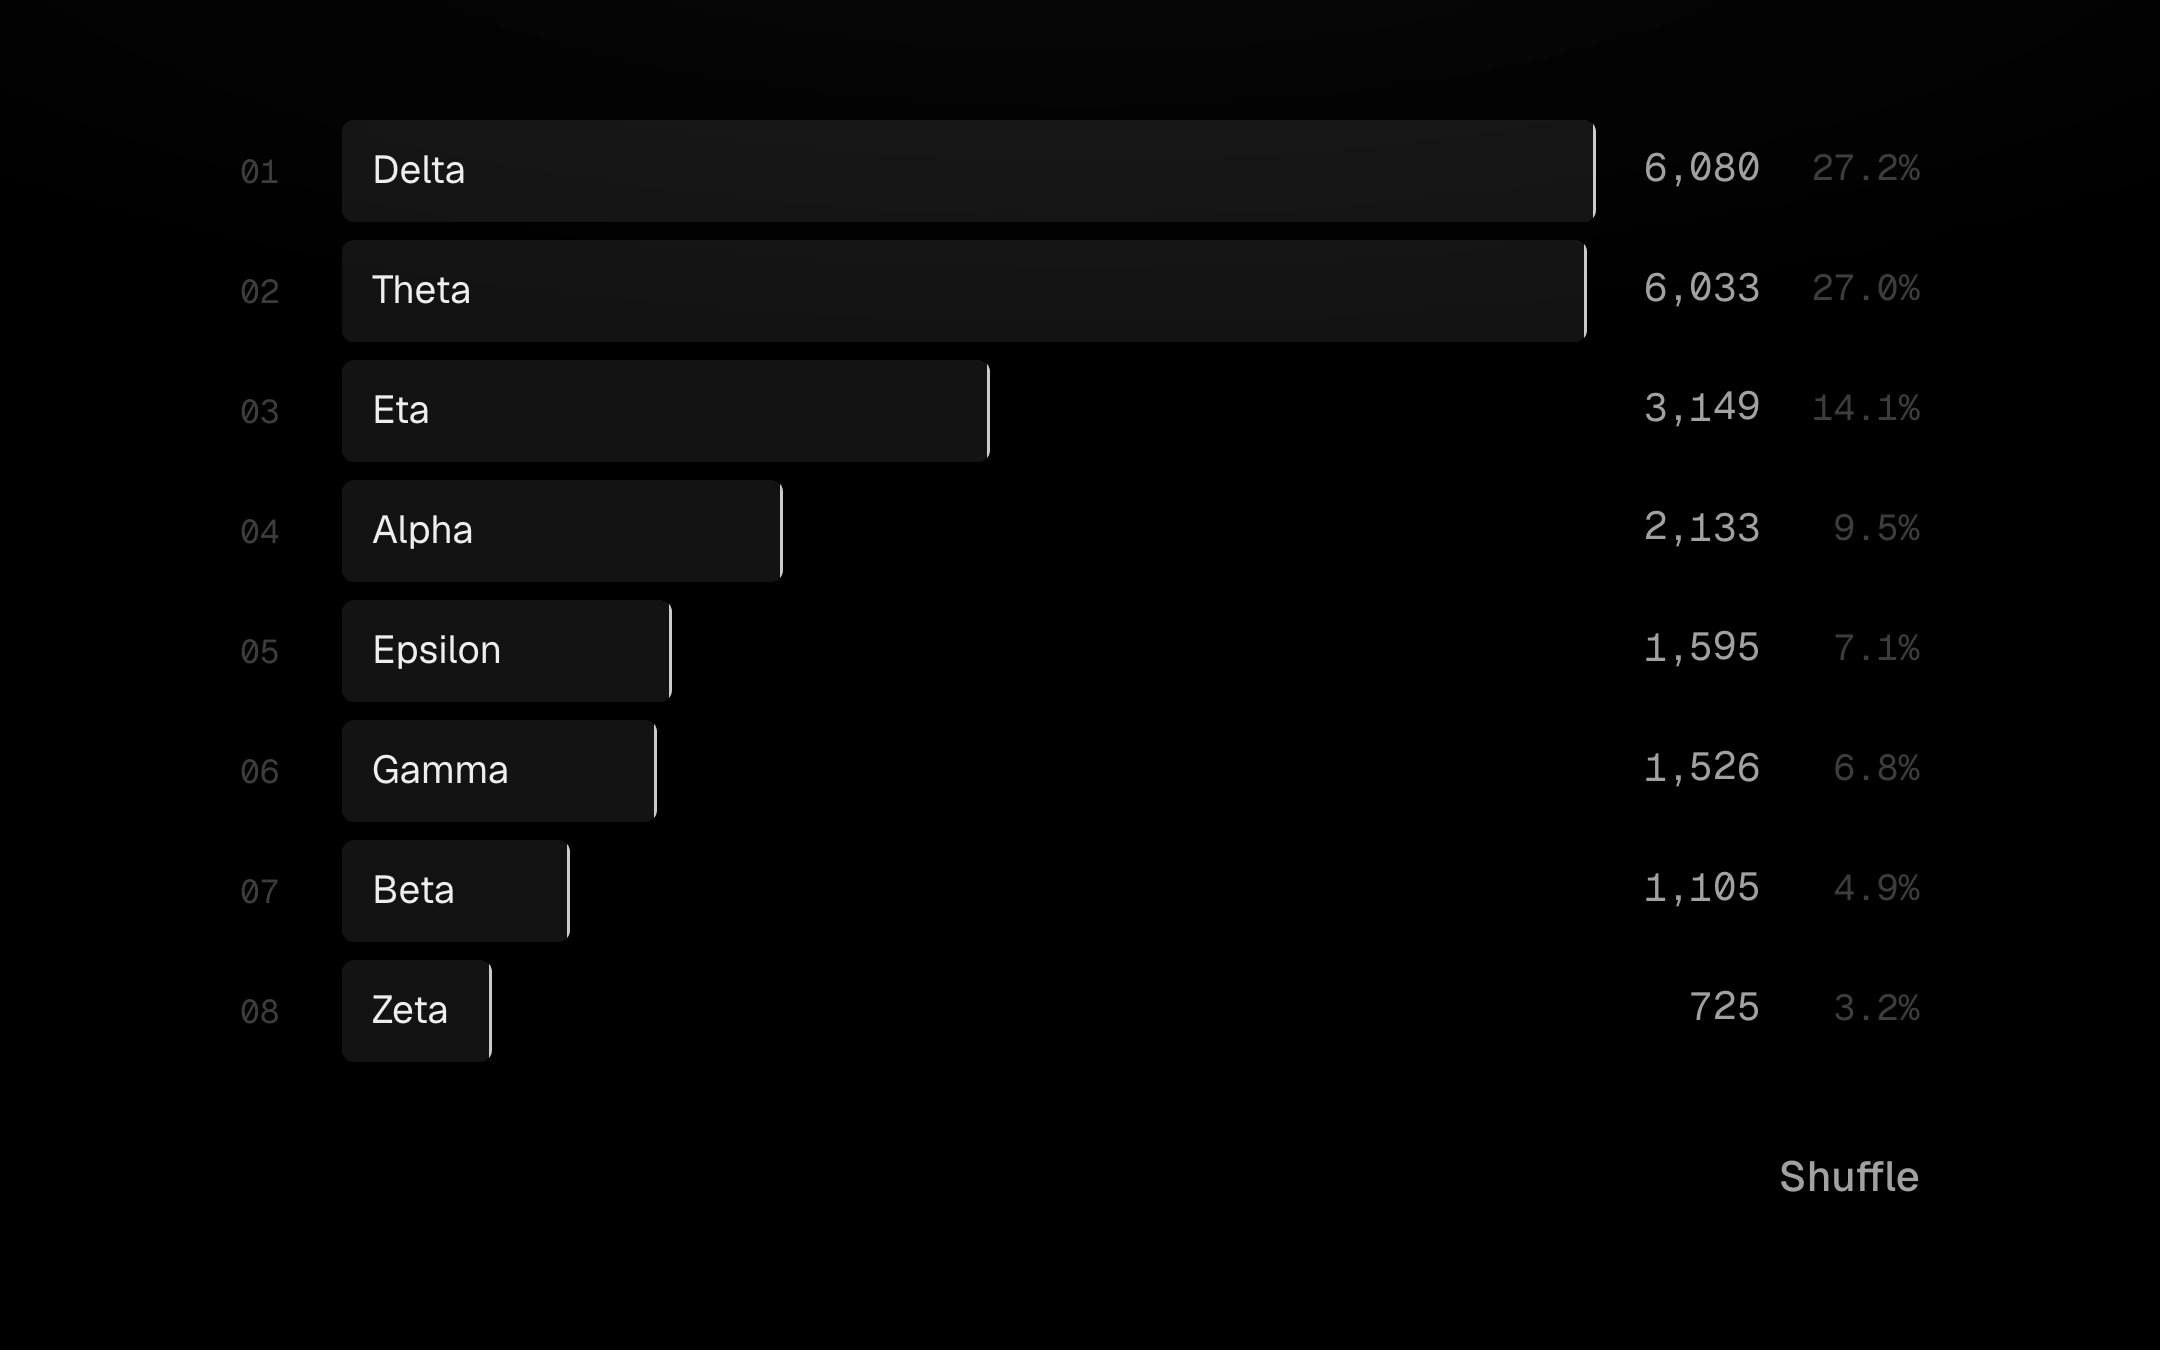
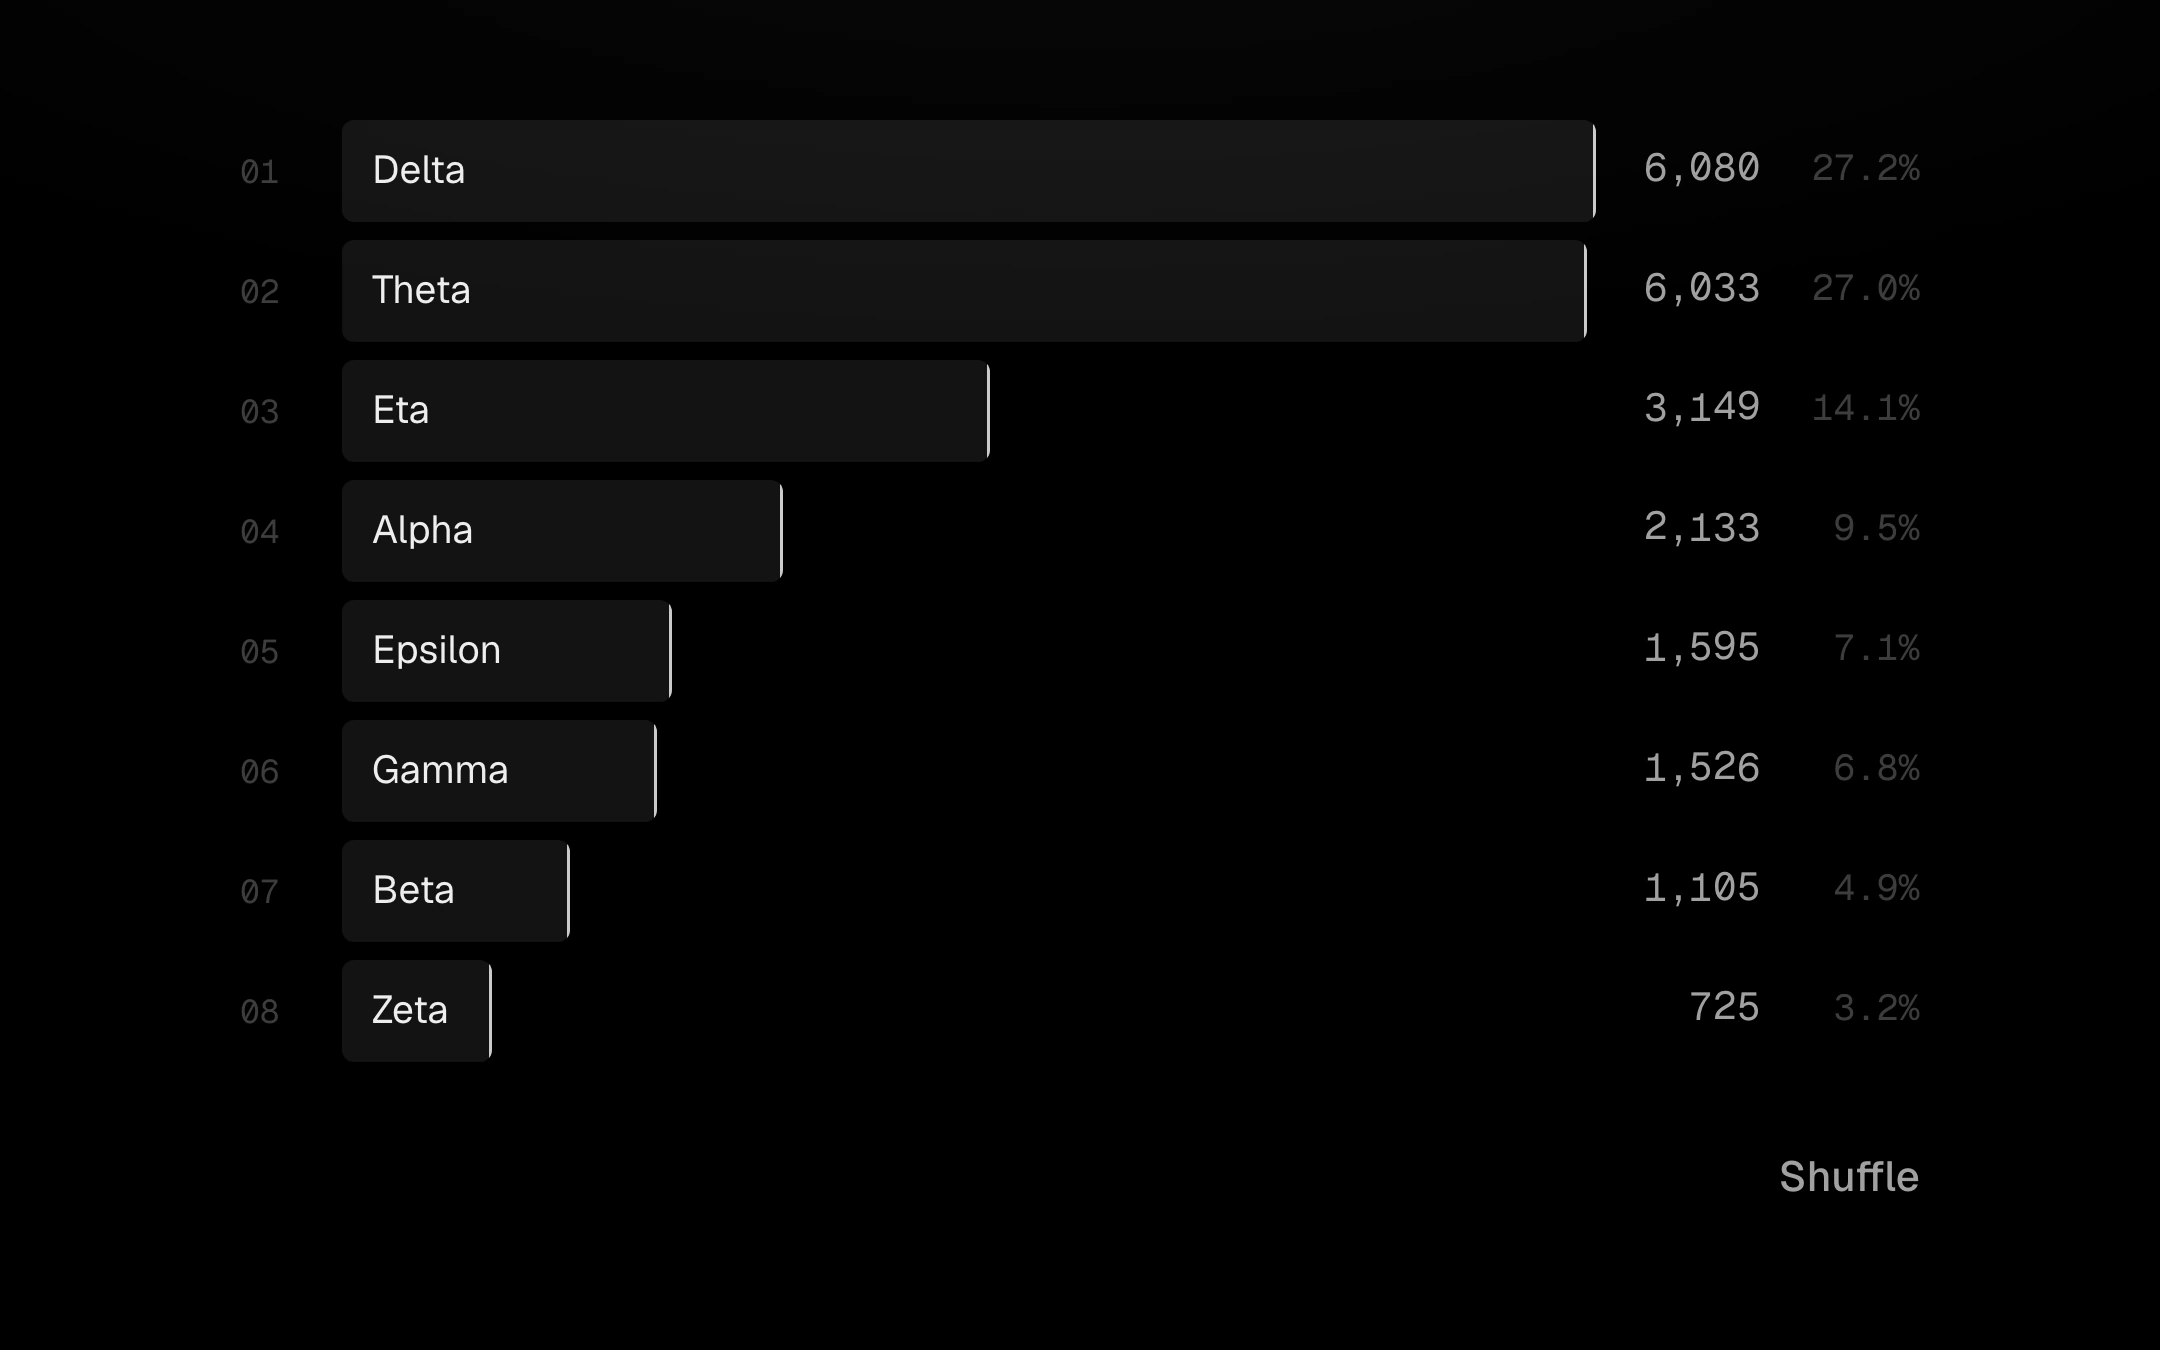
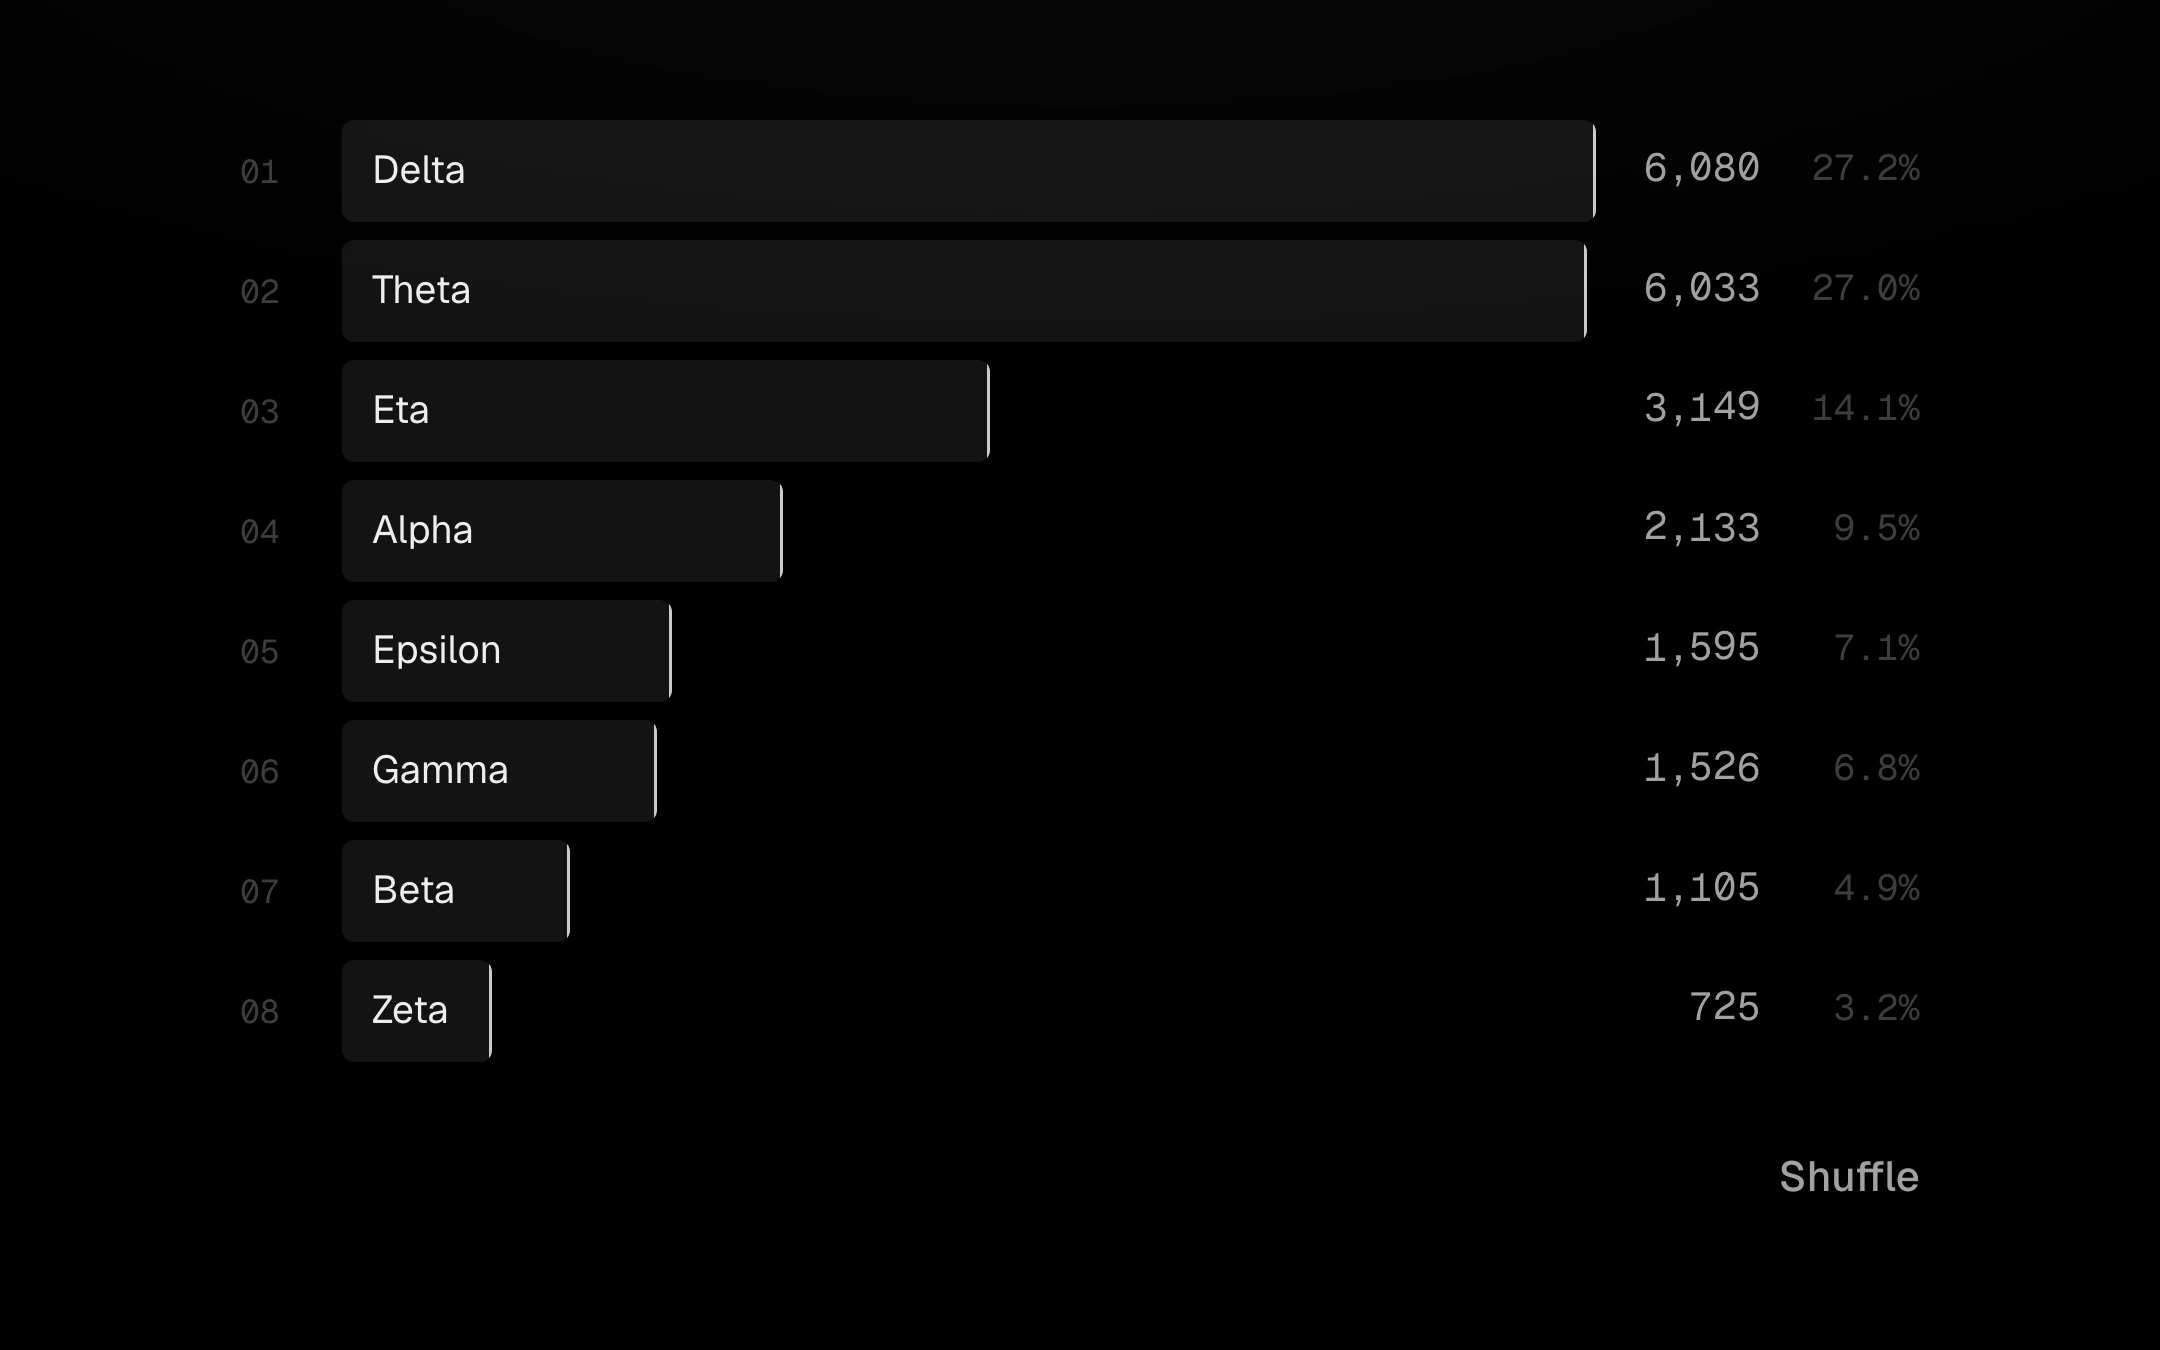
A ranked list of horizontal bars with each value in mono on the right.
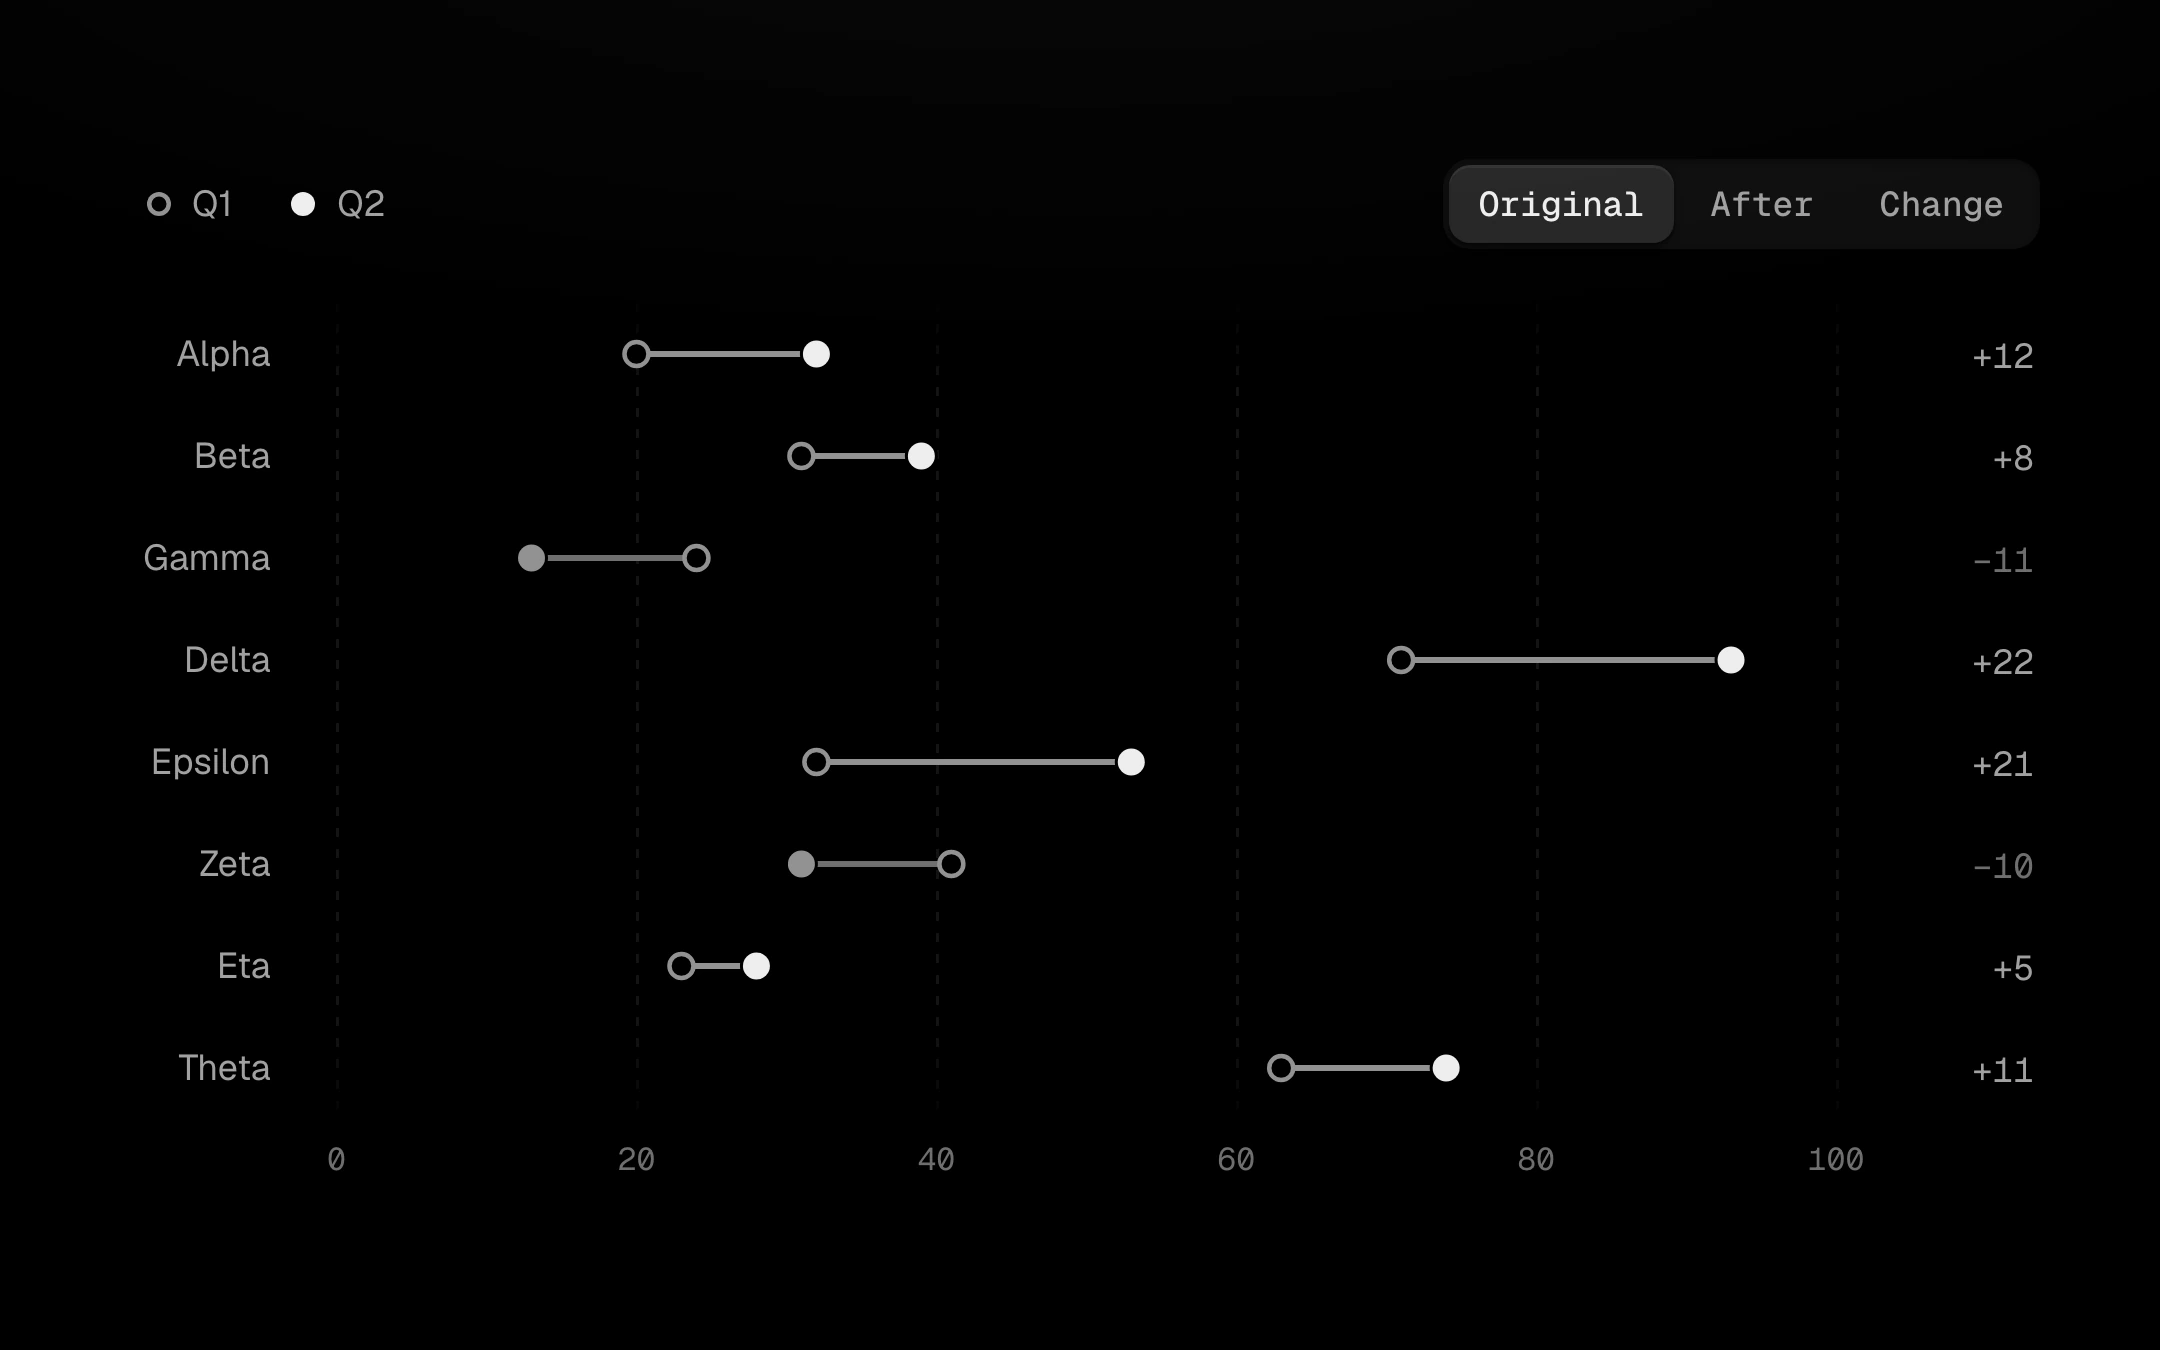
A before and an after value per row: a hollow ring, a solid dot and the link between them.
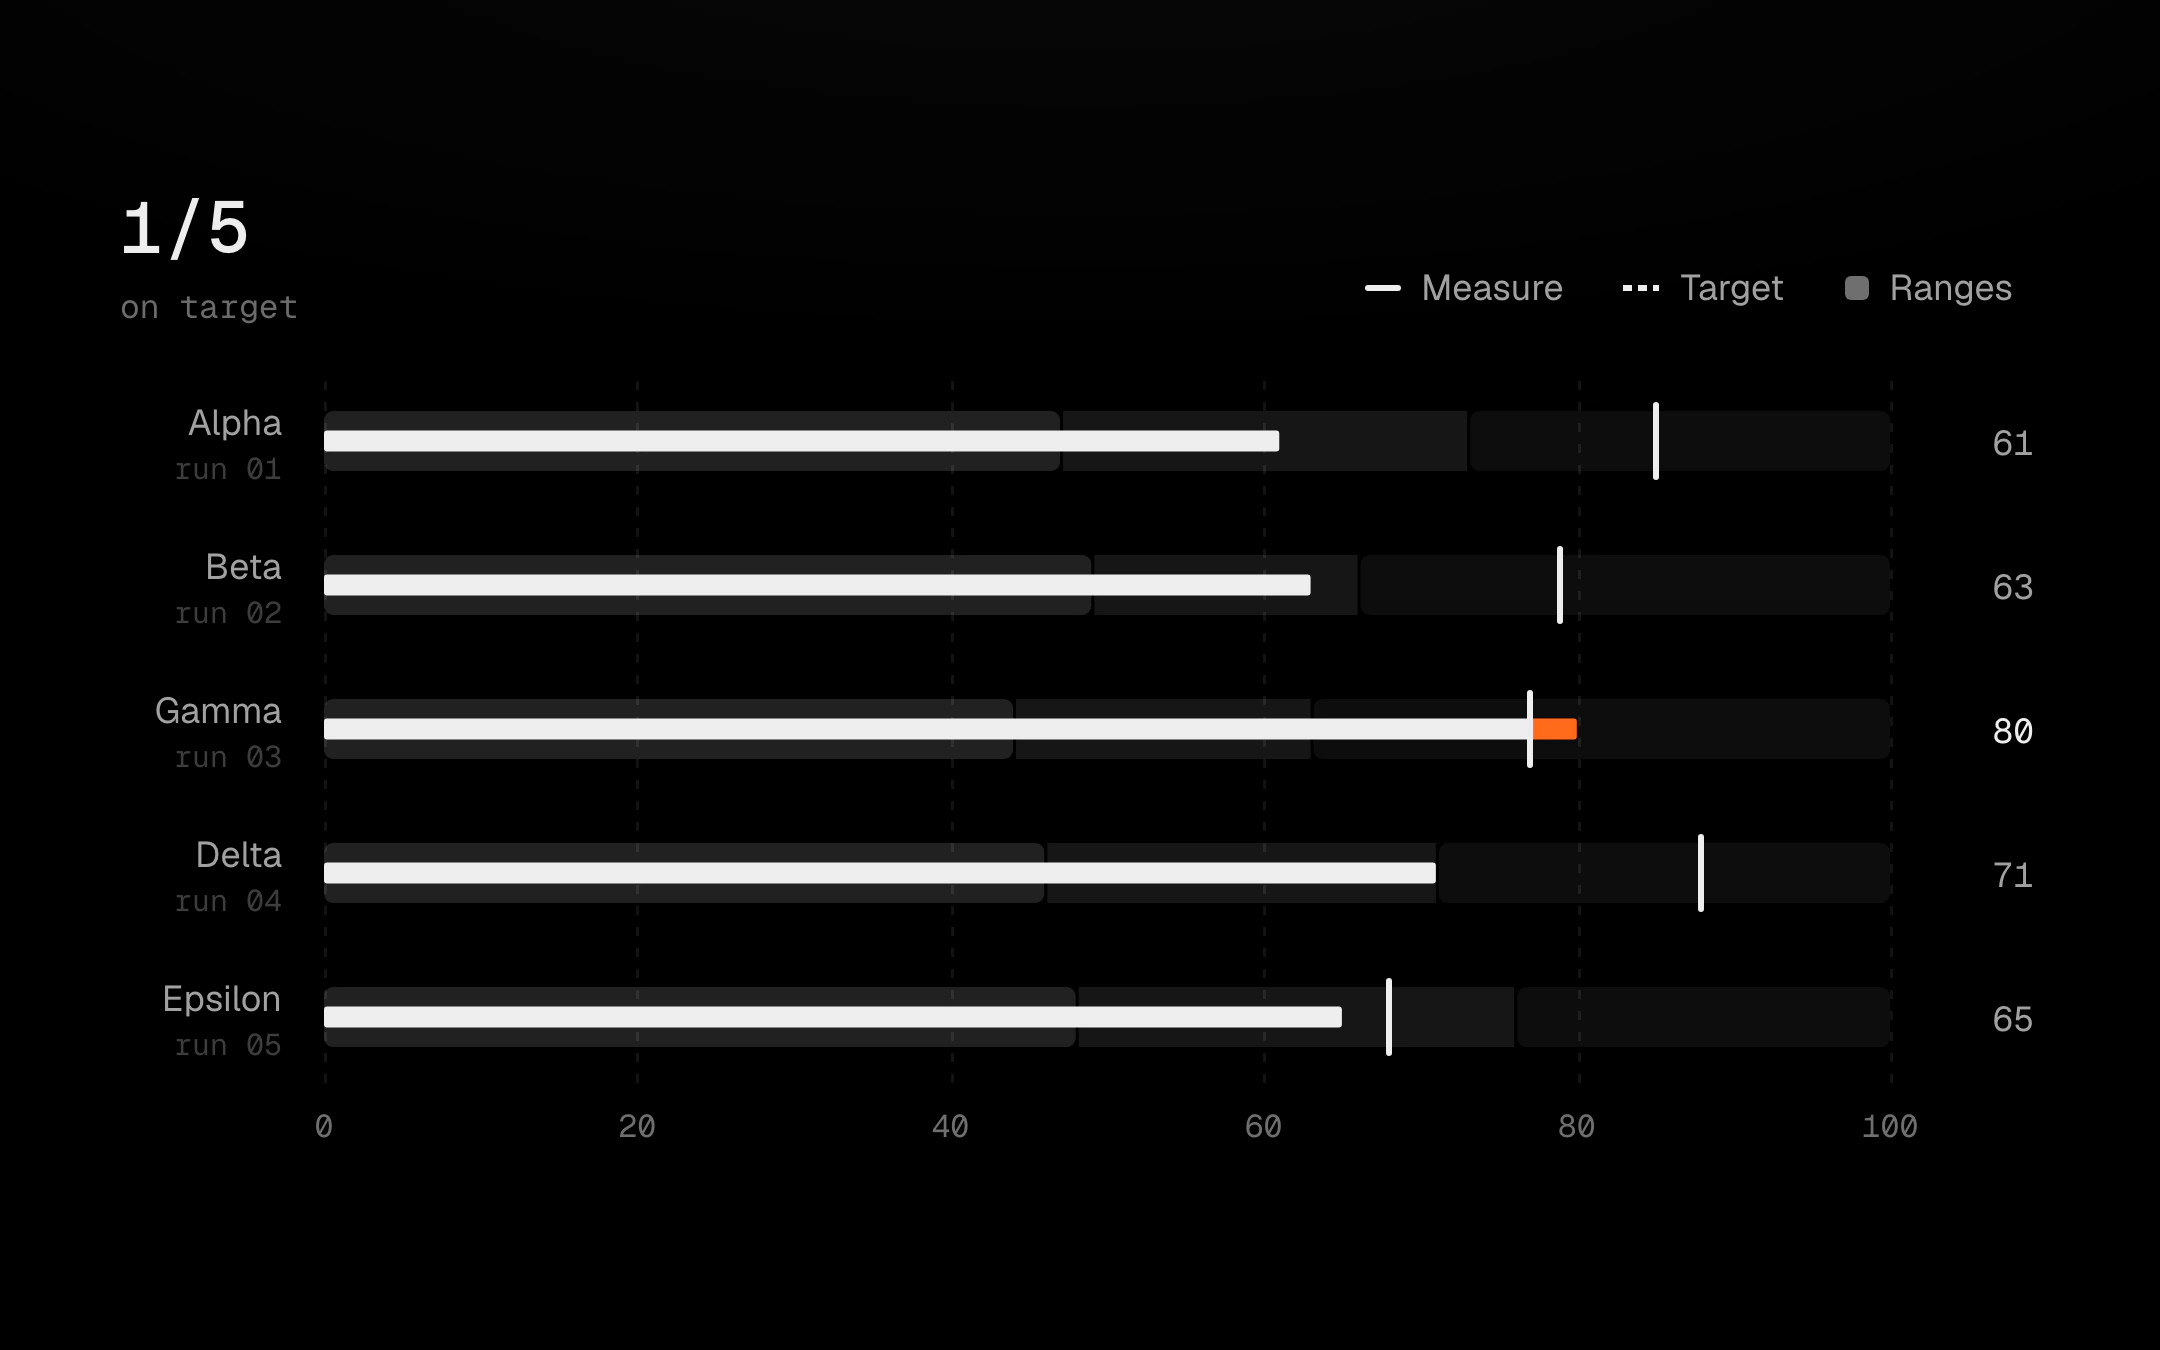
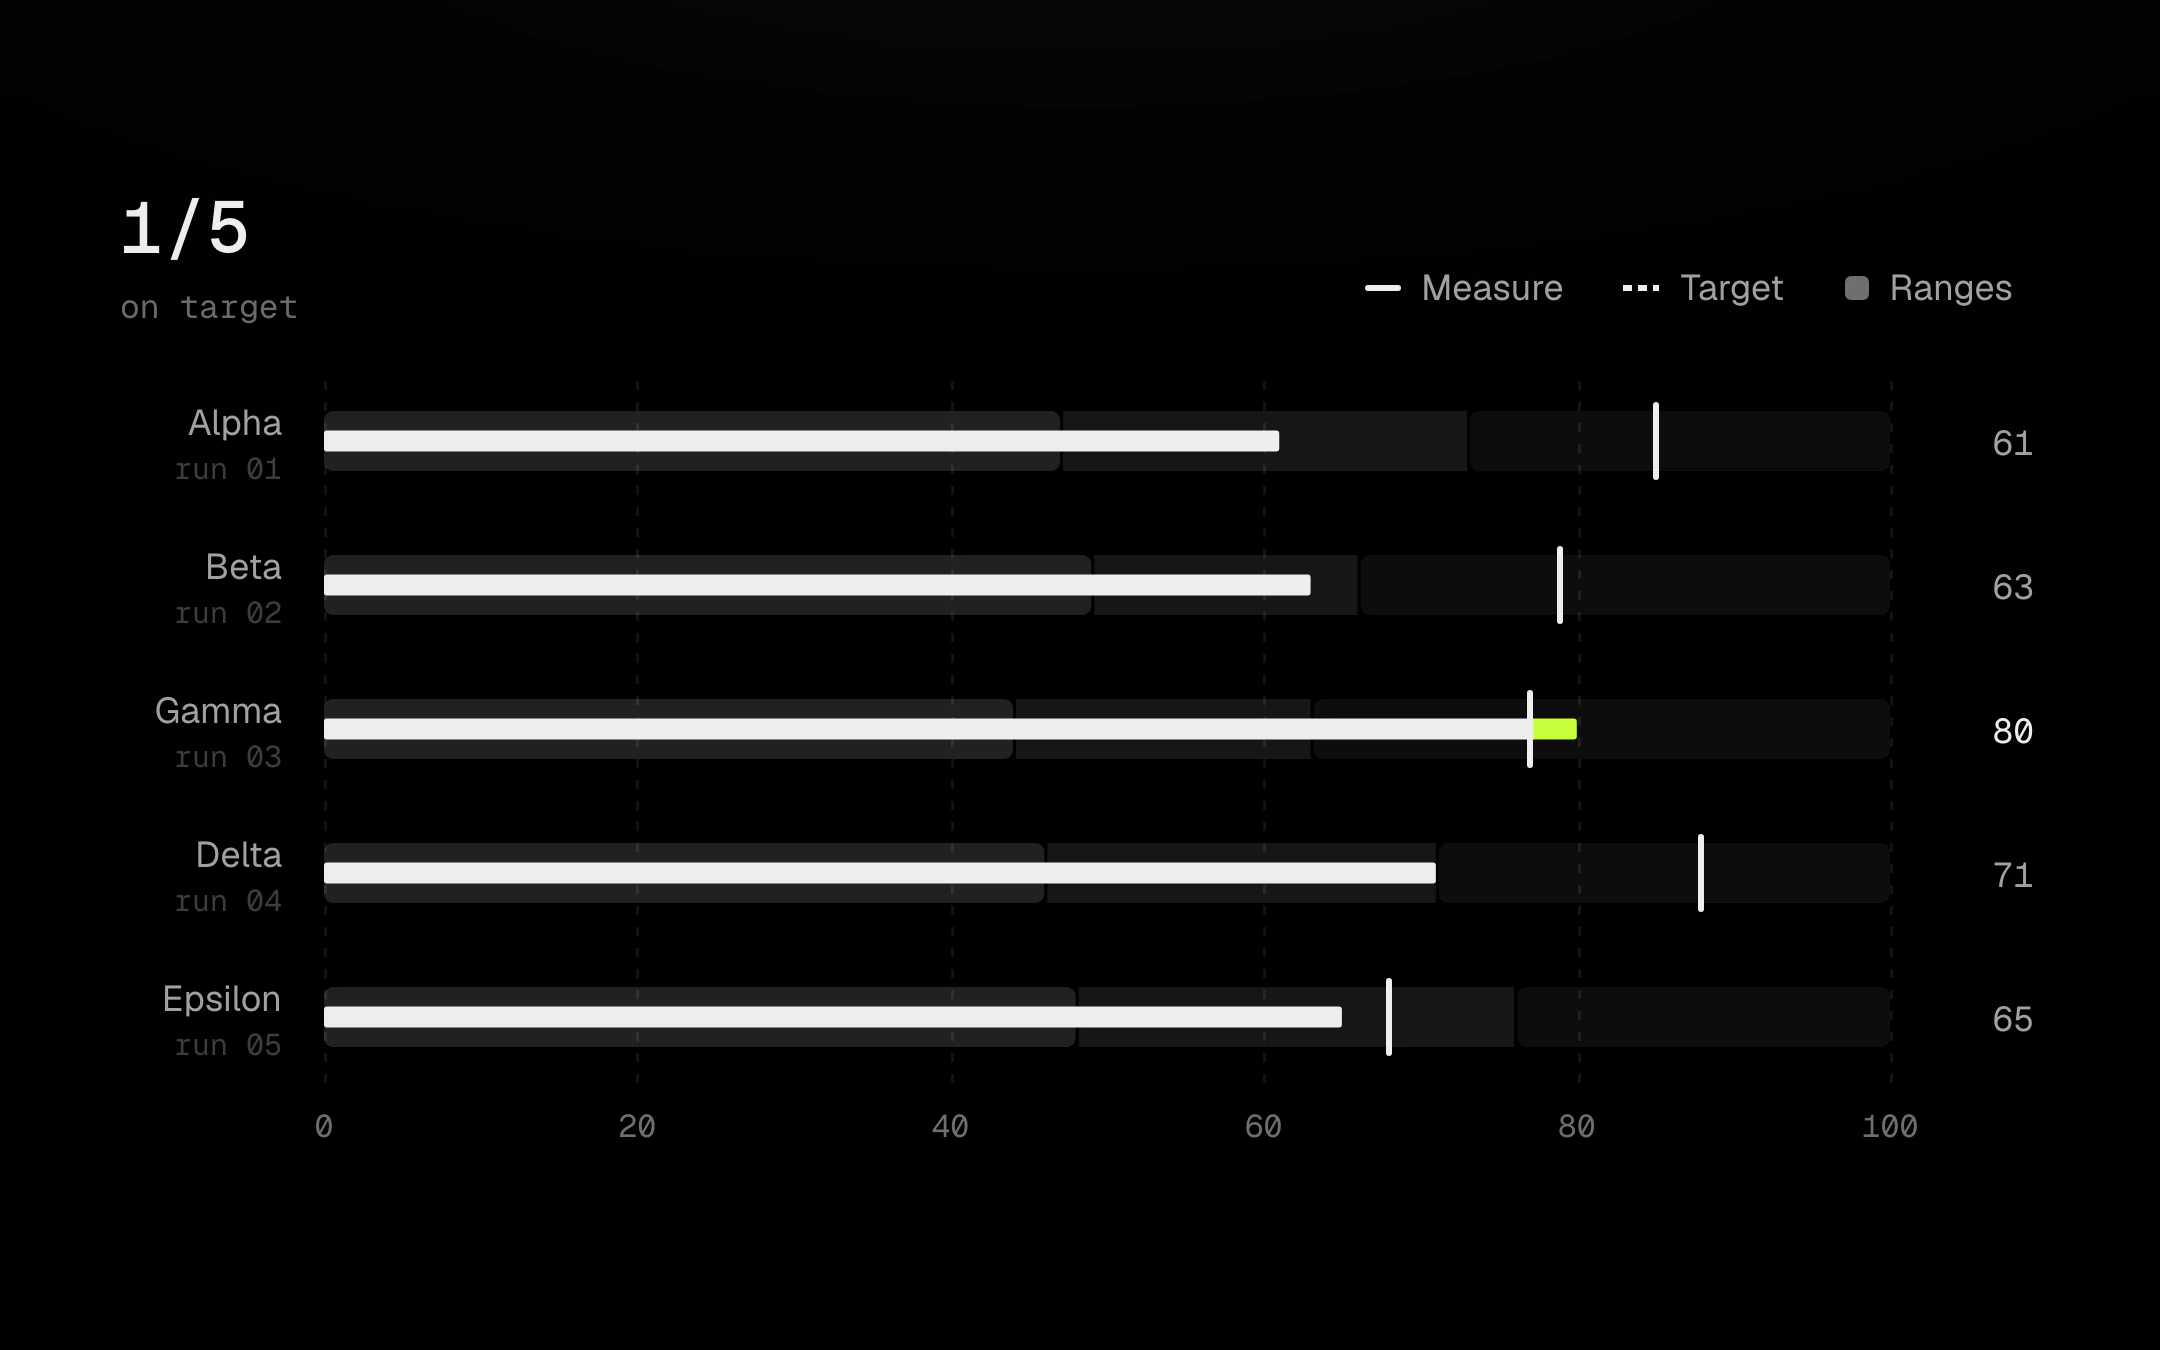
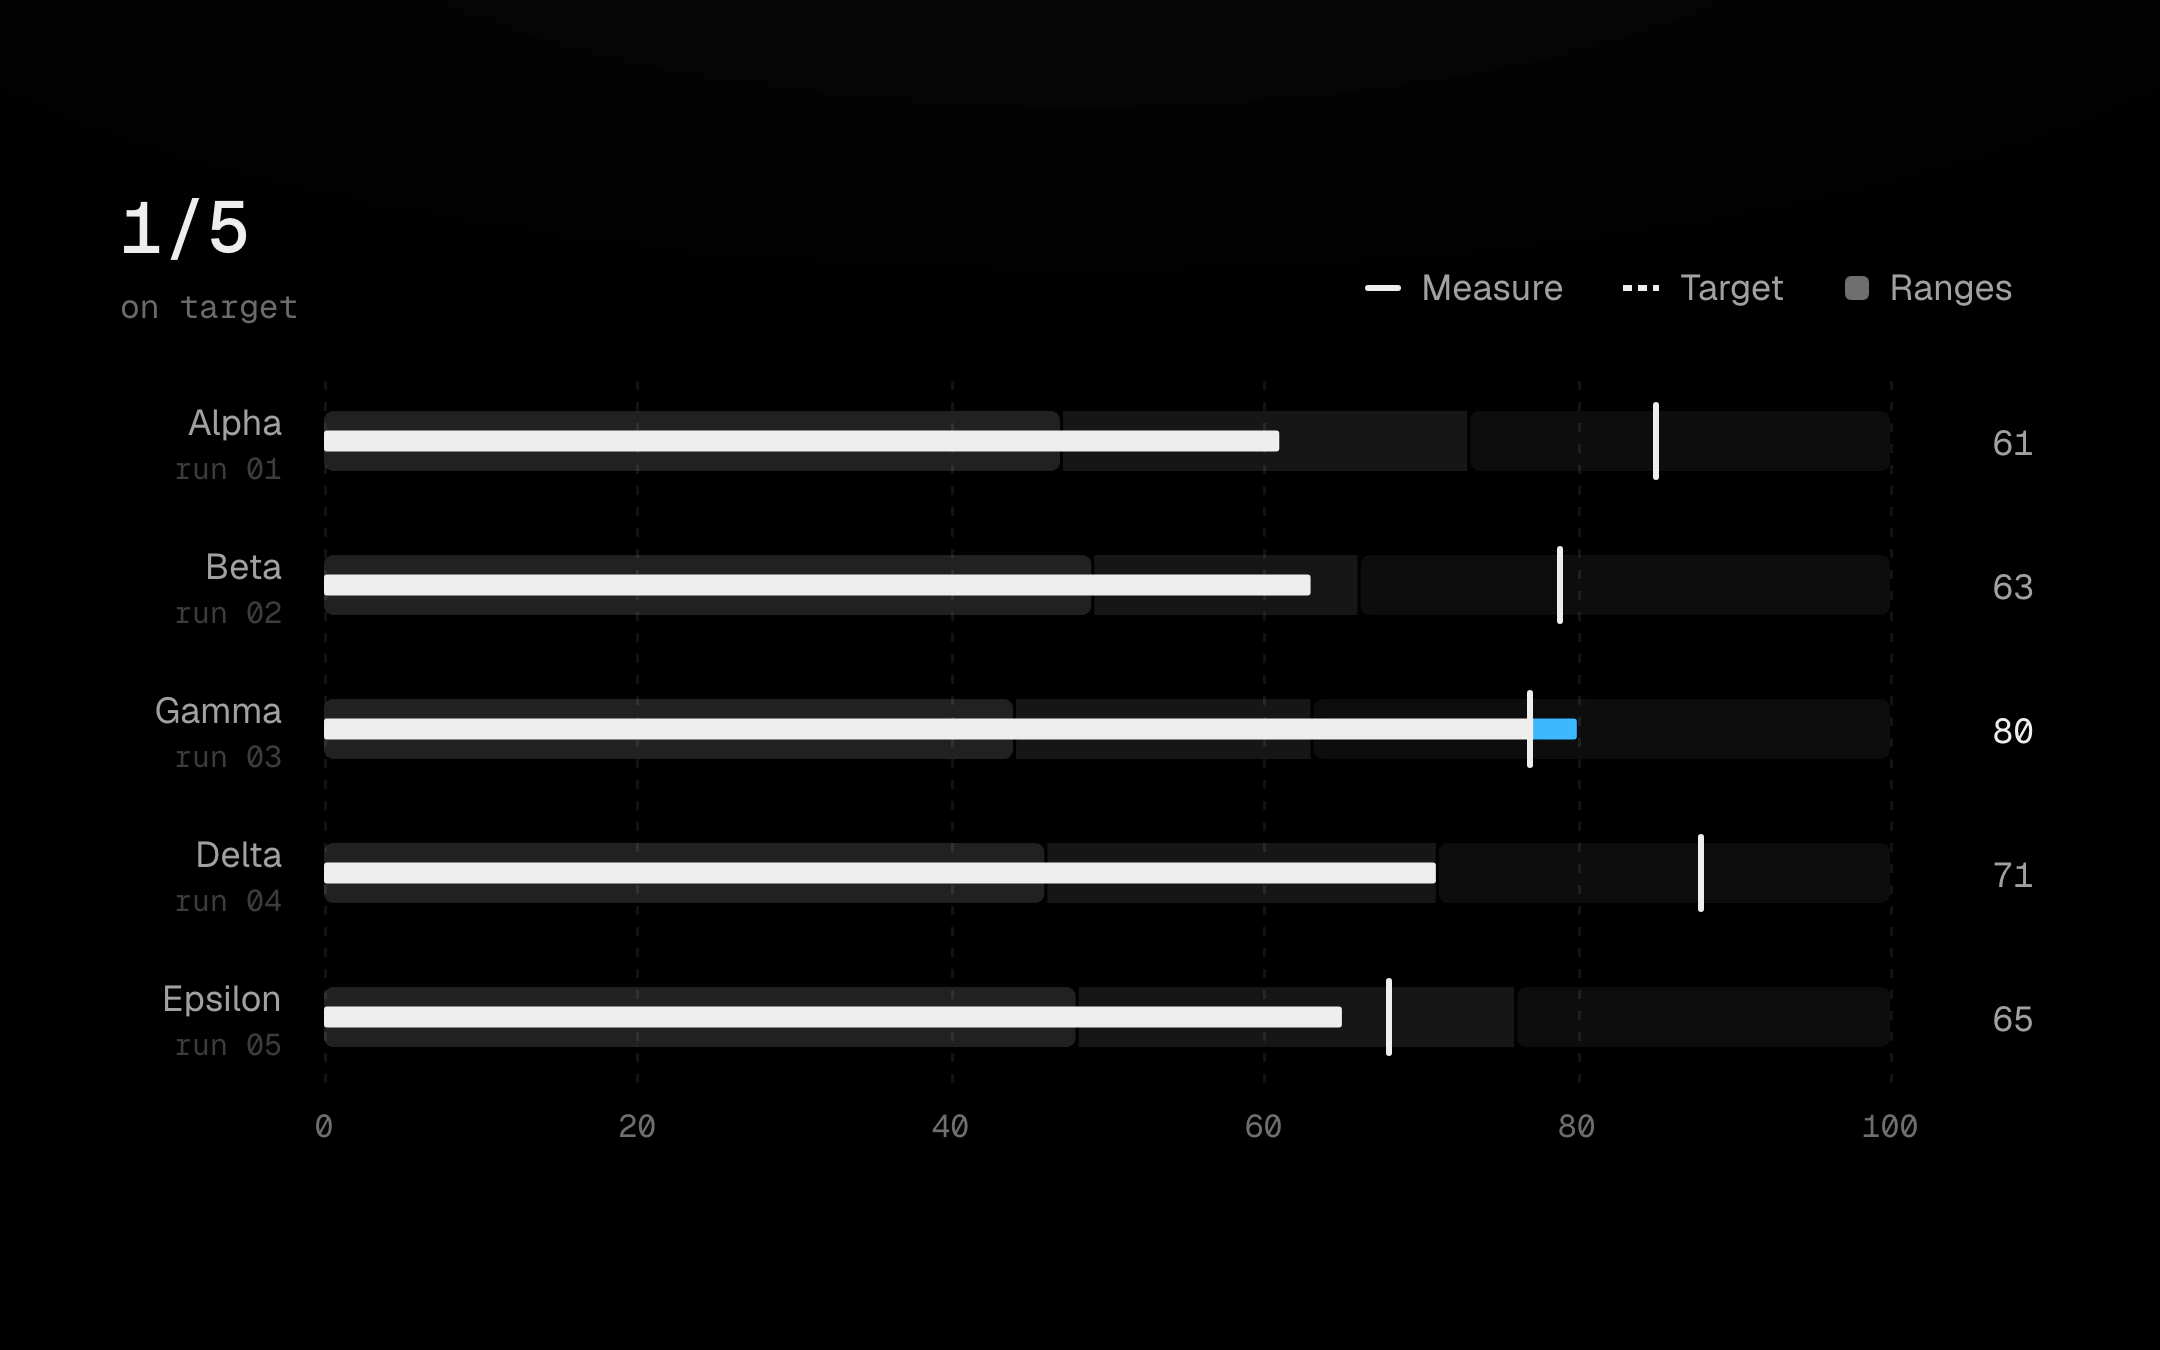
One measure against its target per row: three quiet bands for the qualitative ranges, a thin bone bar for the measure and a bone tick for the target; only the part past the target runs hot.
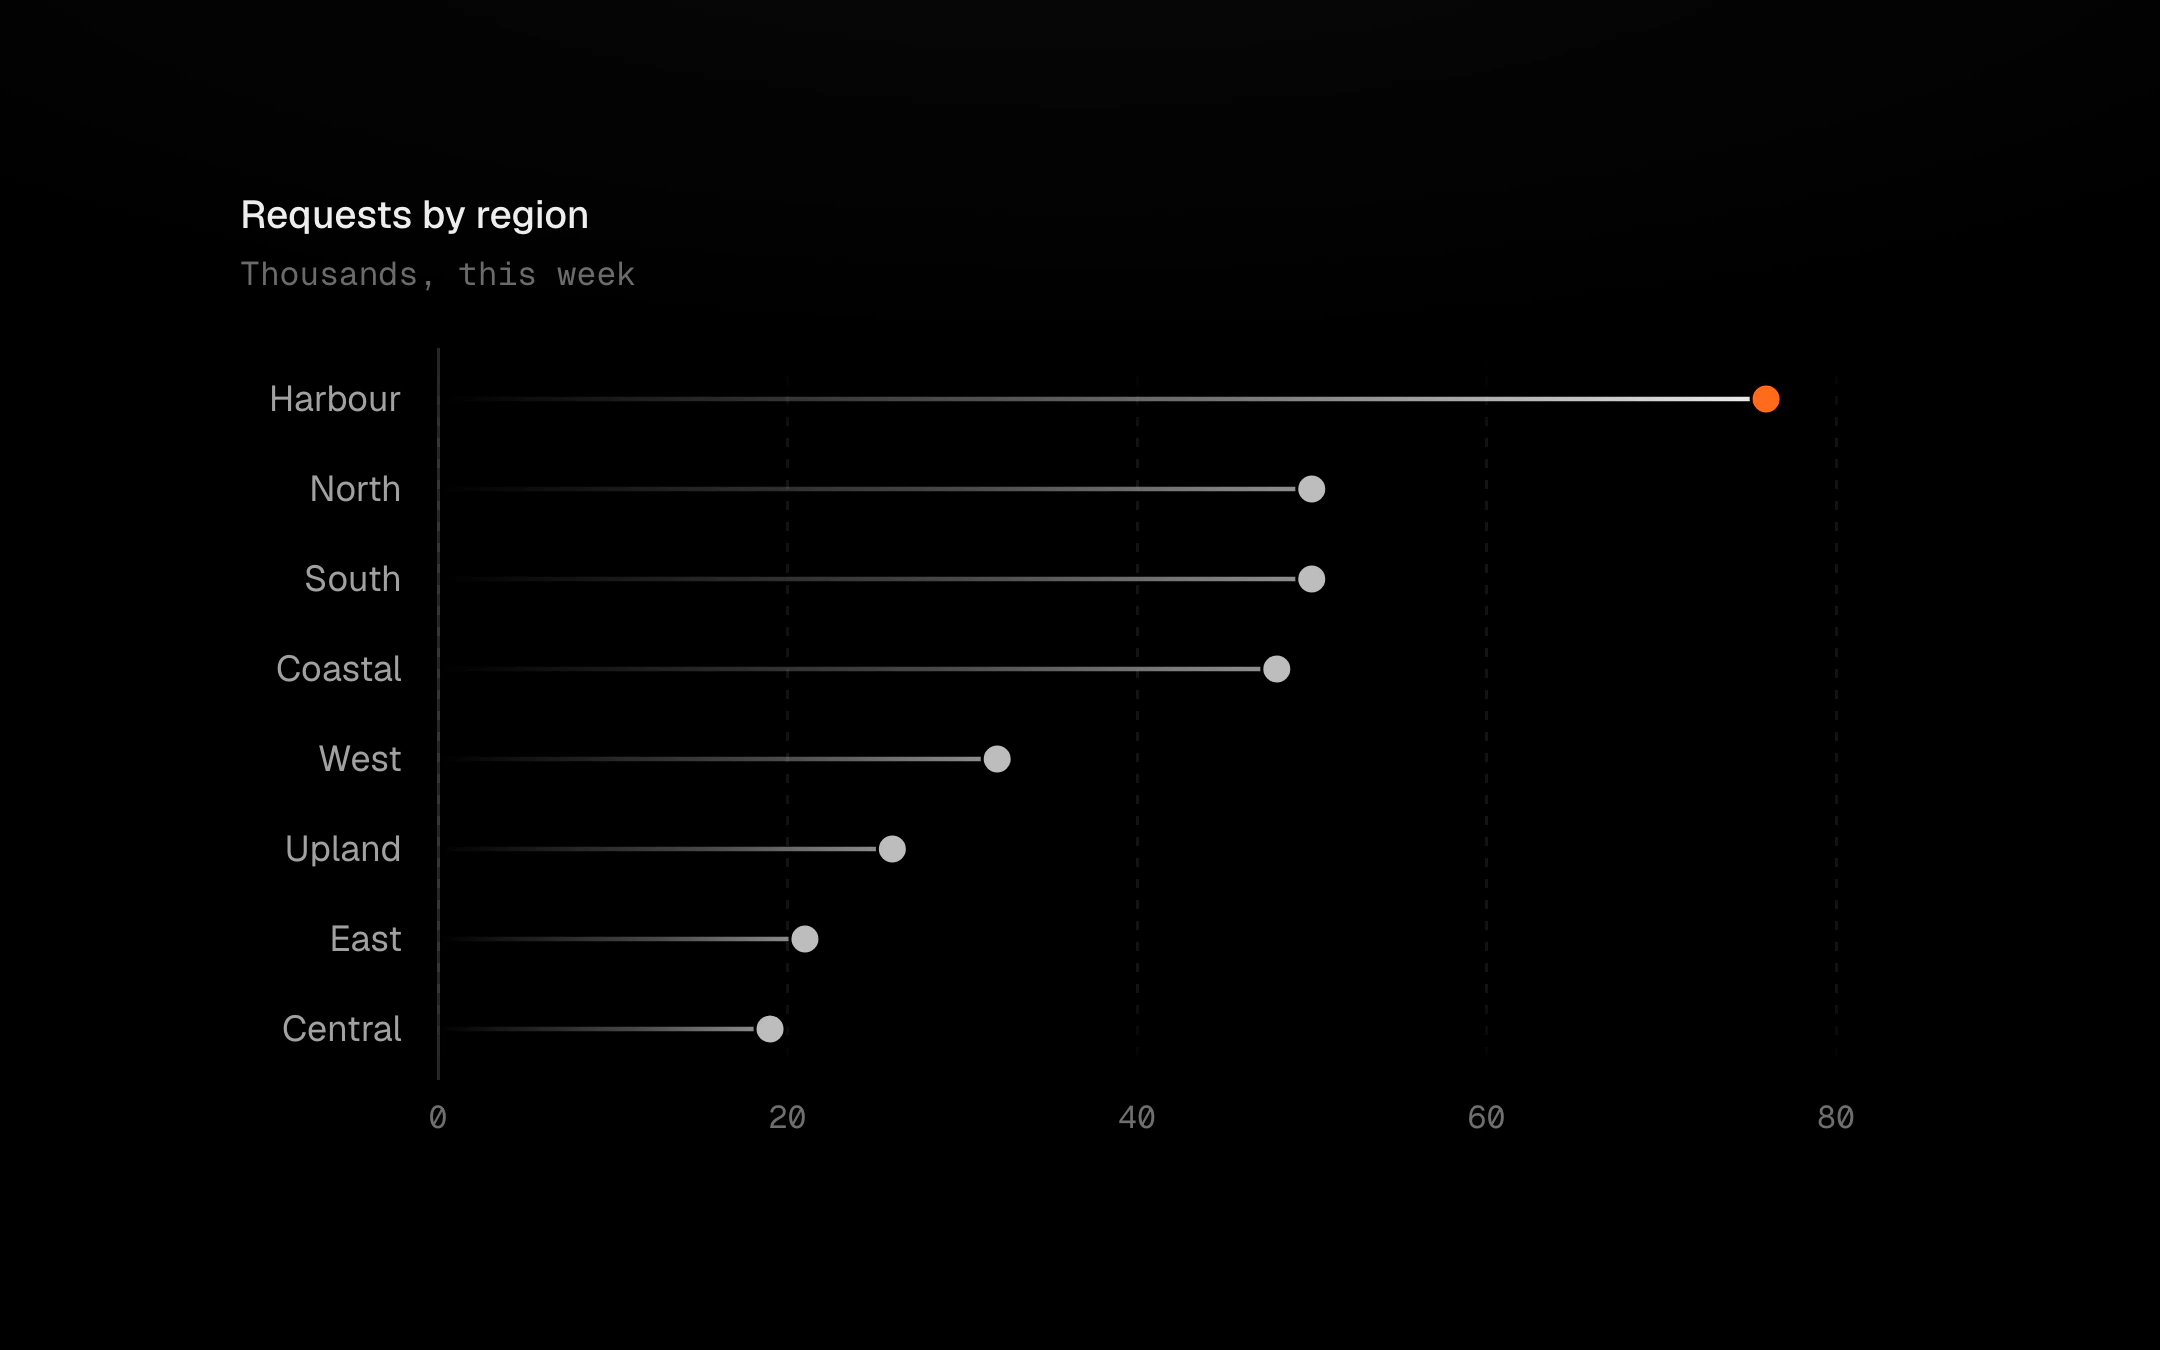
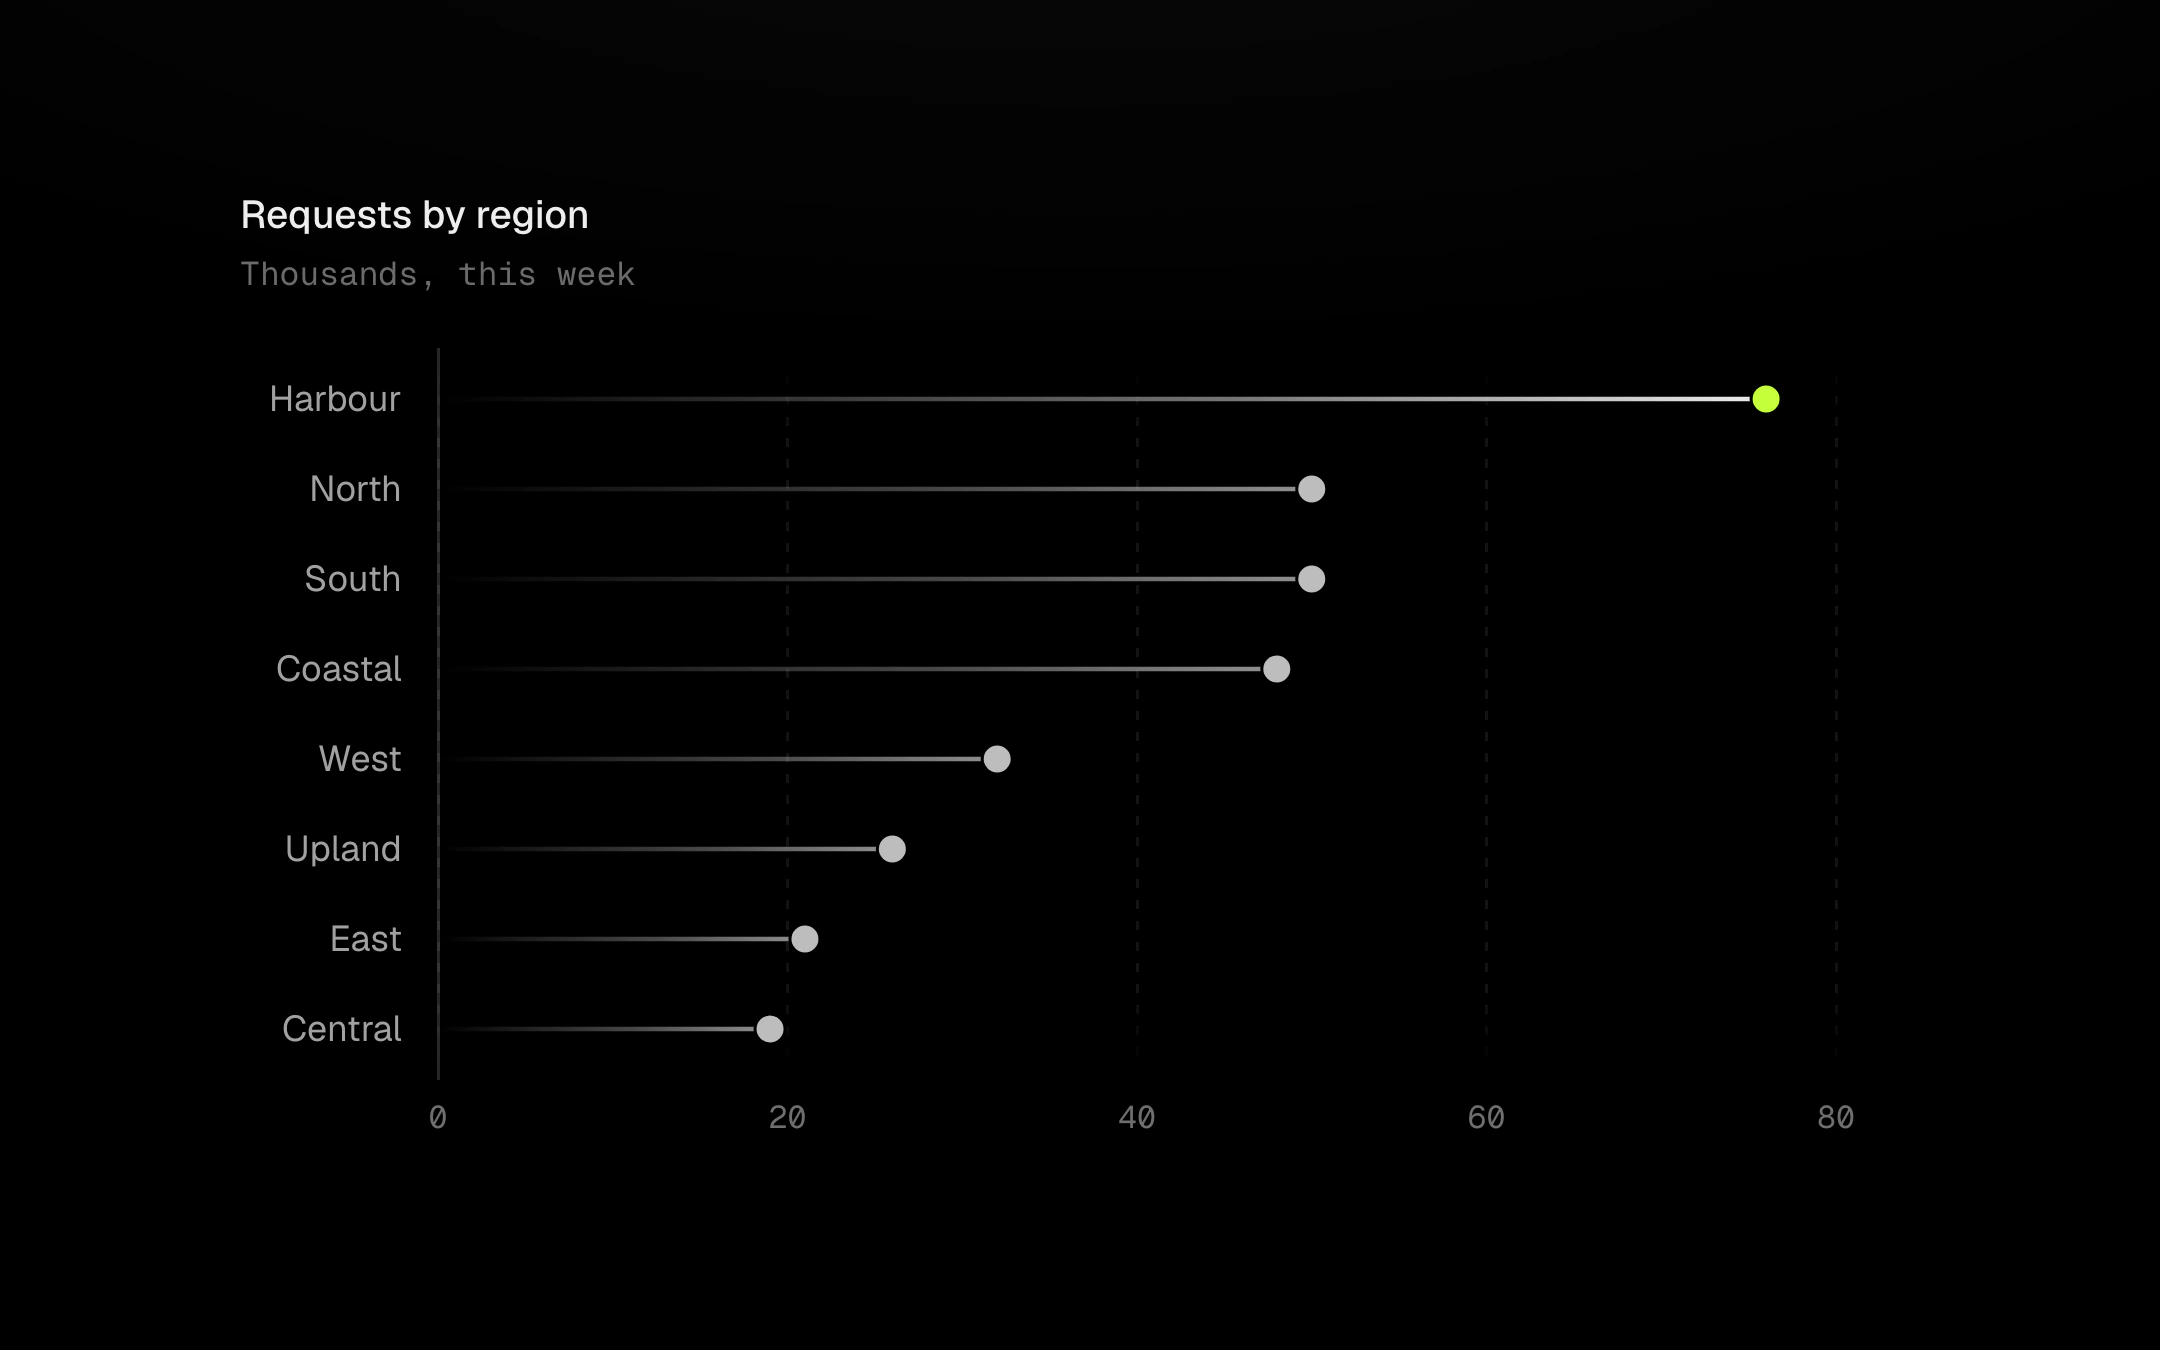
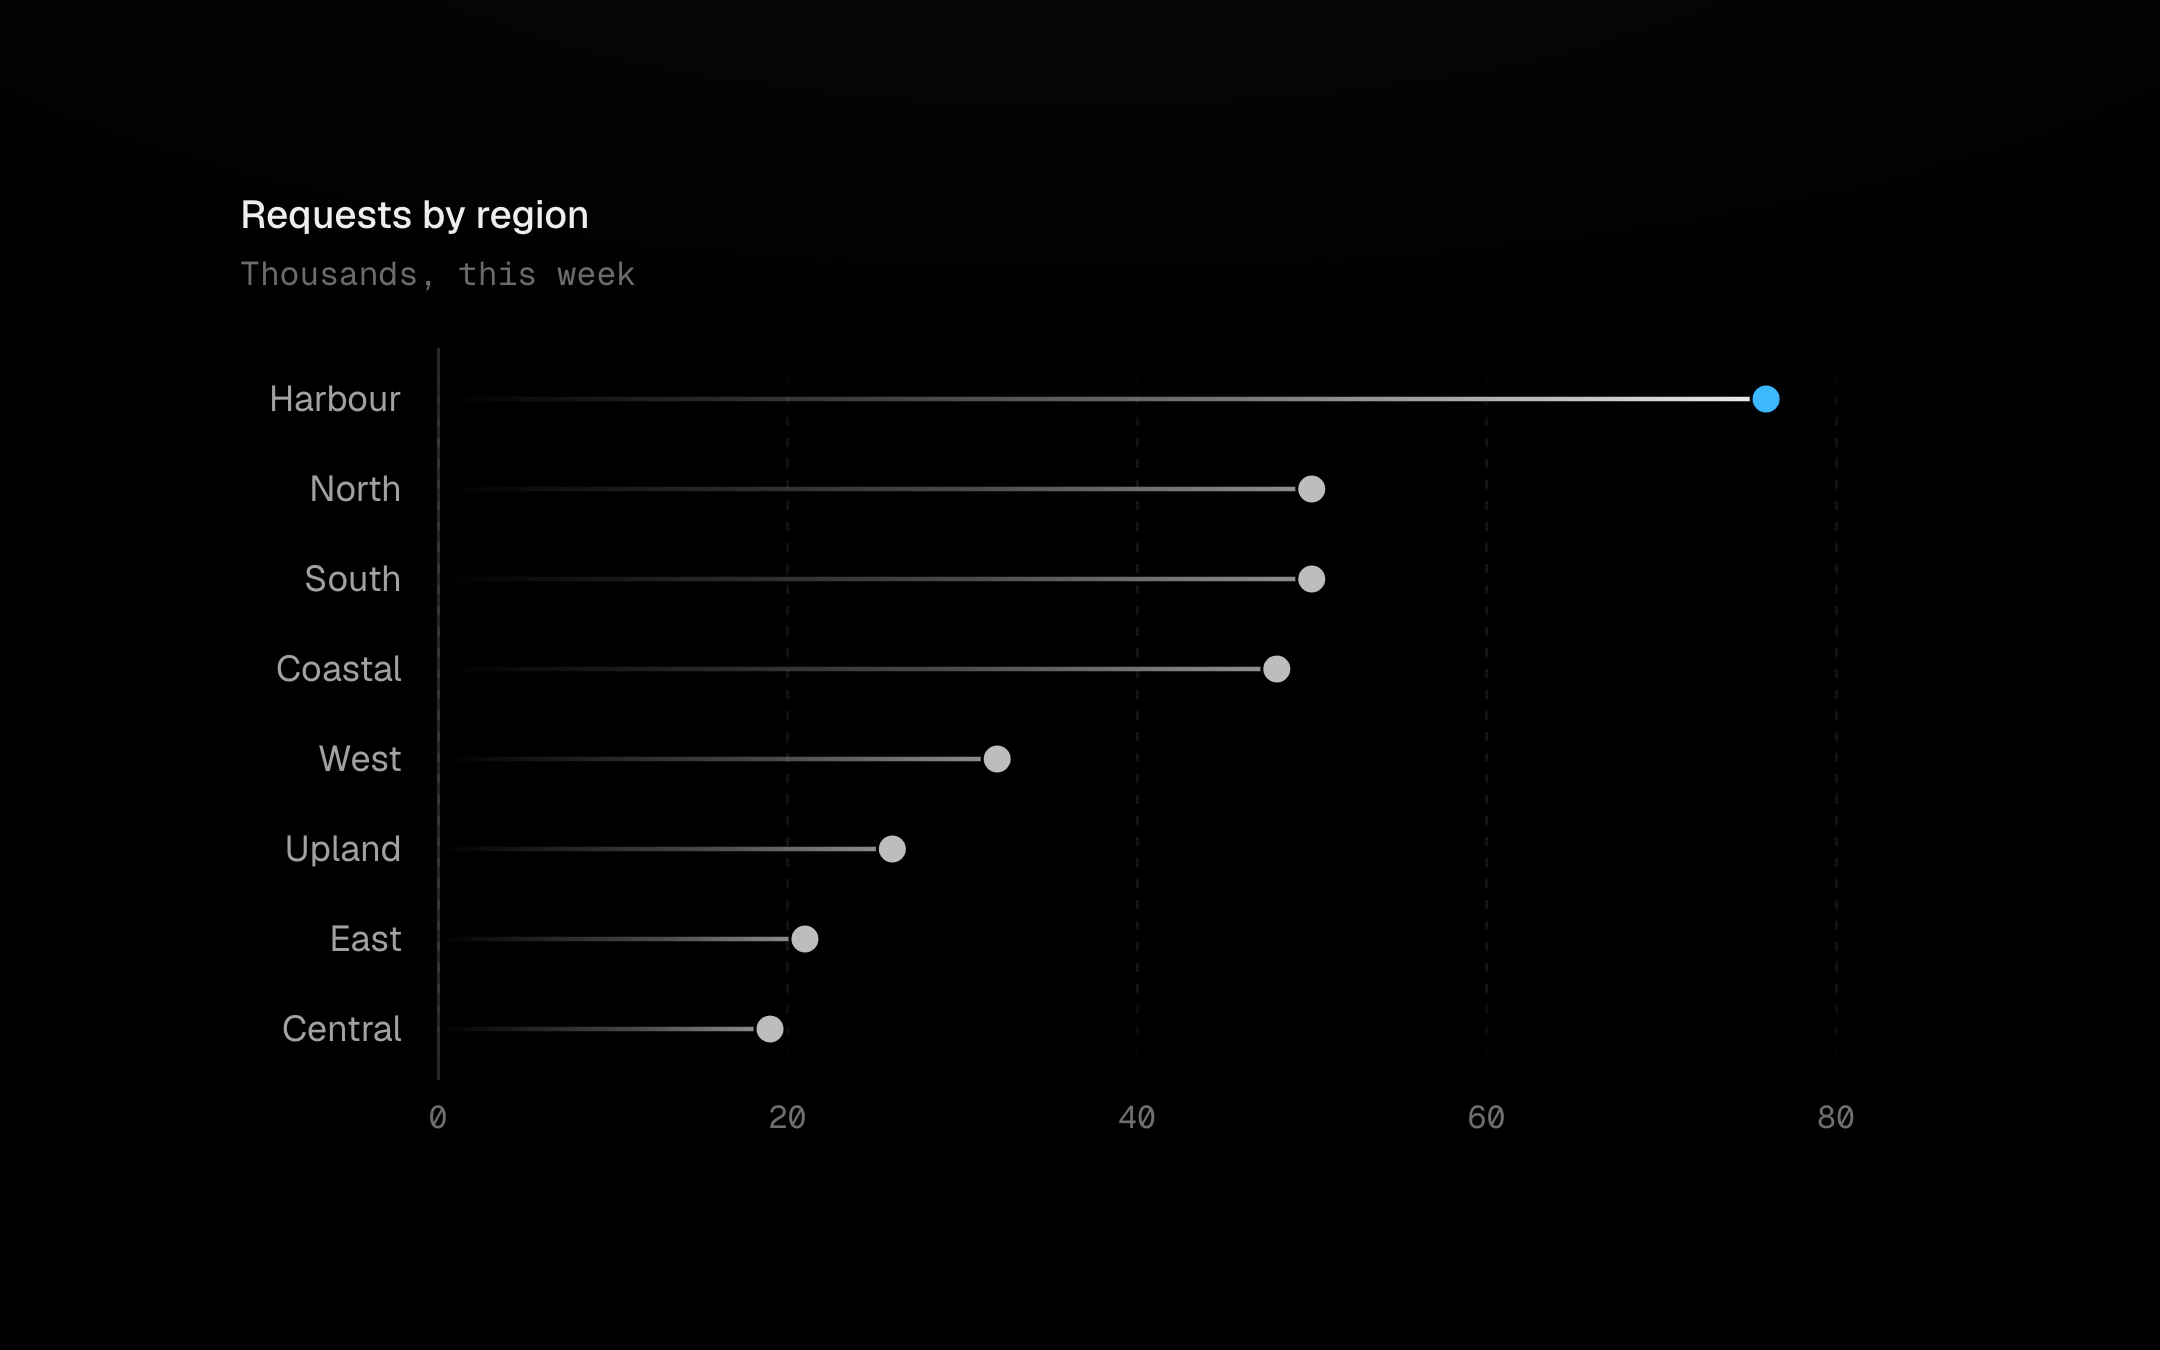
One row per category: a hairline stem that fades in from the baseline and a head at the value, as a dot, a ring or a squircle.
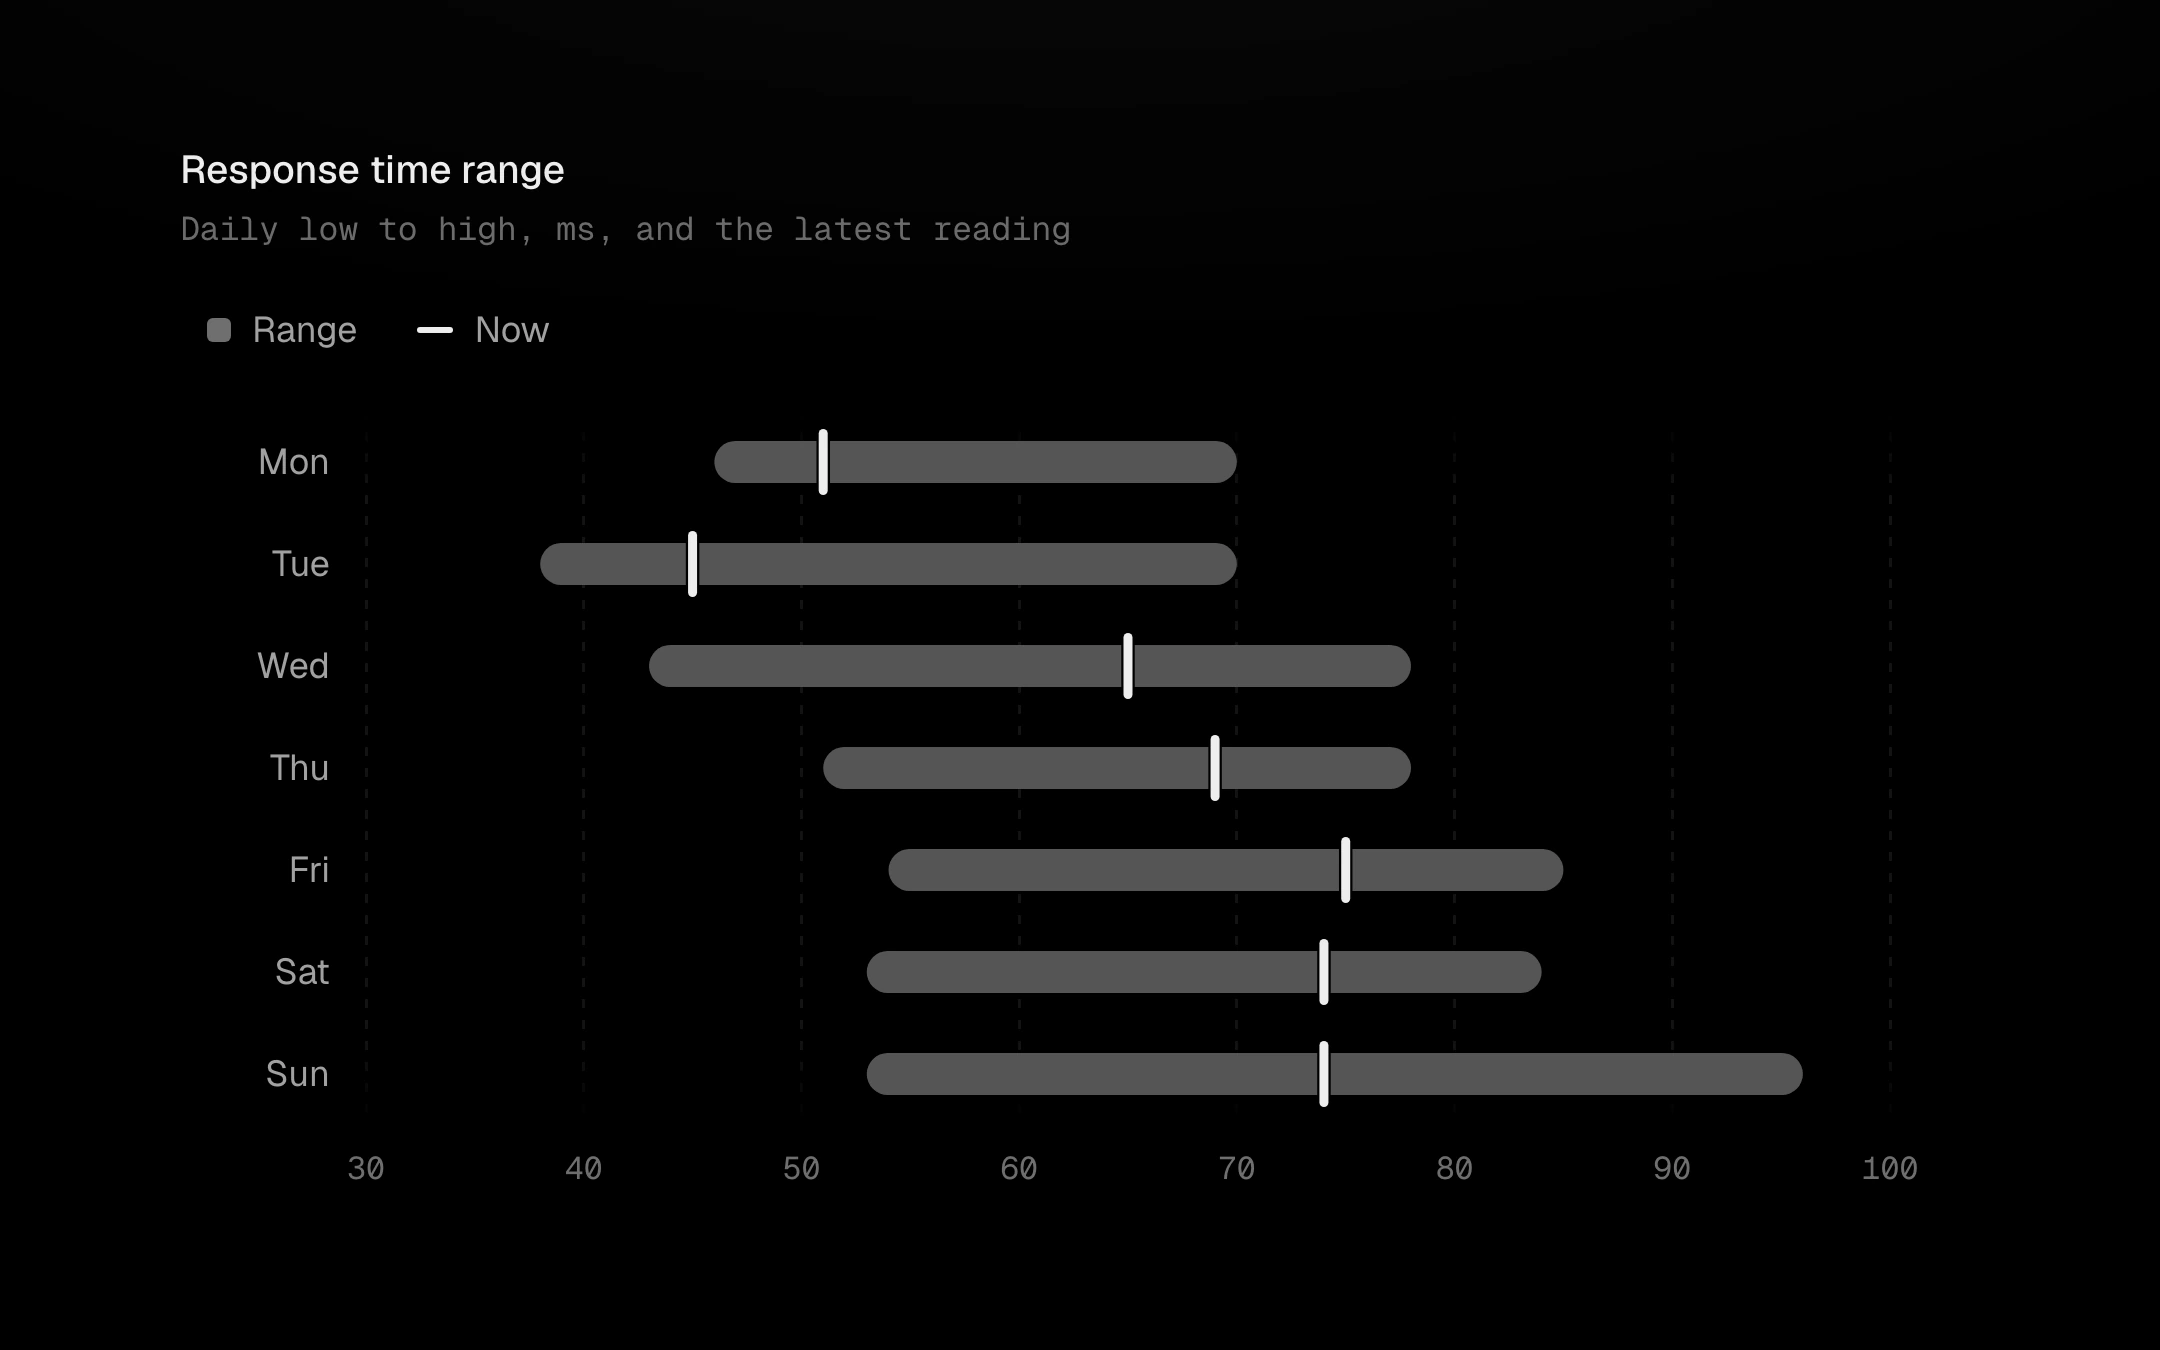
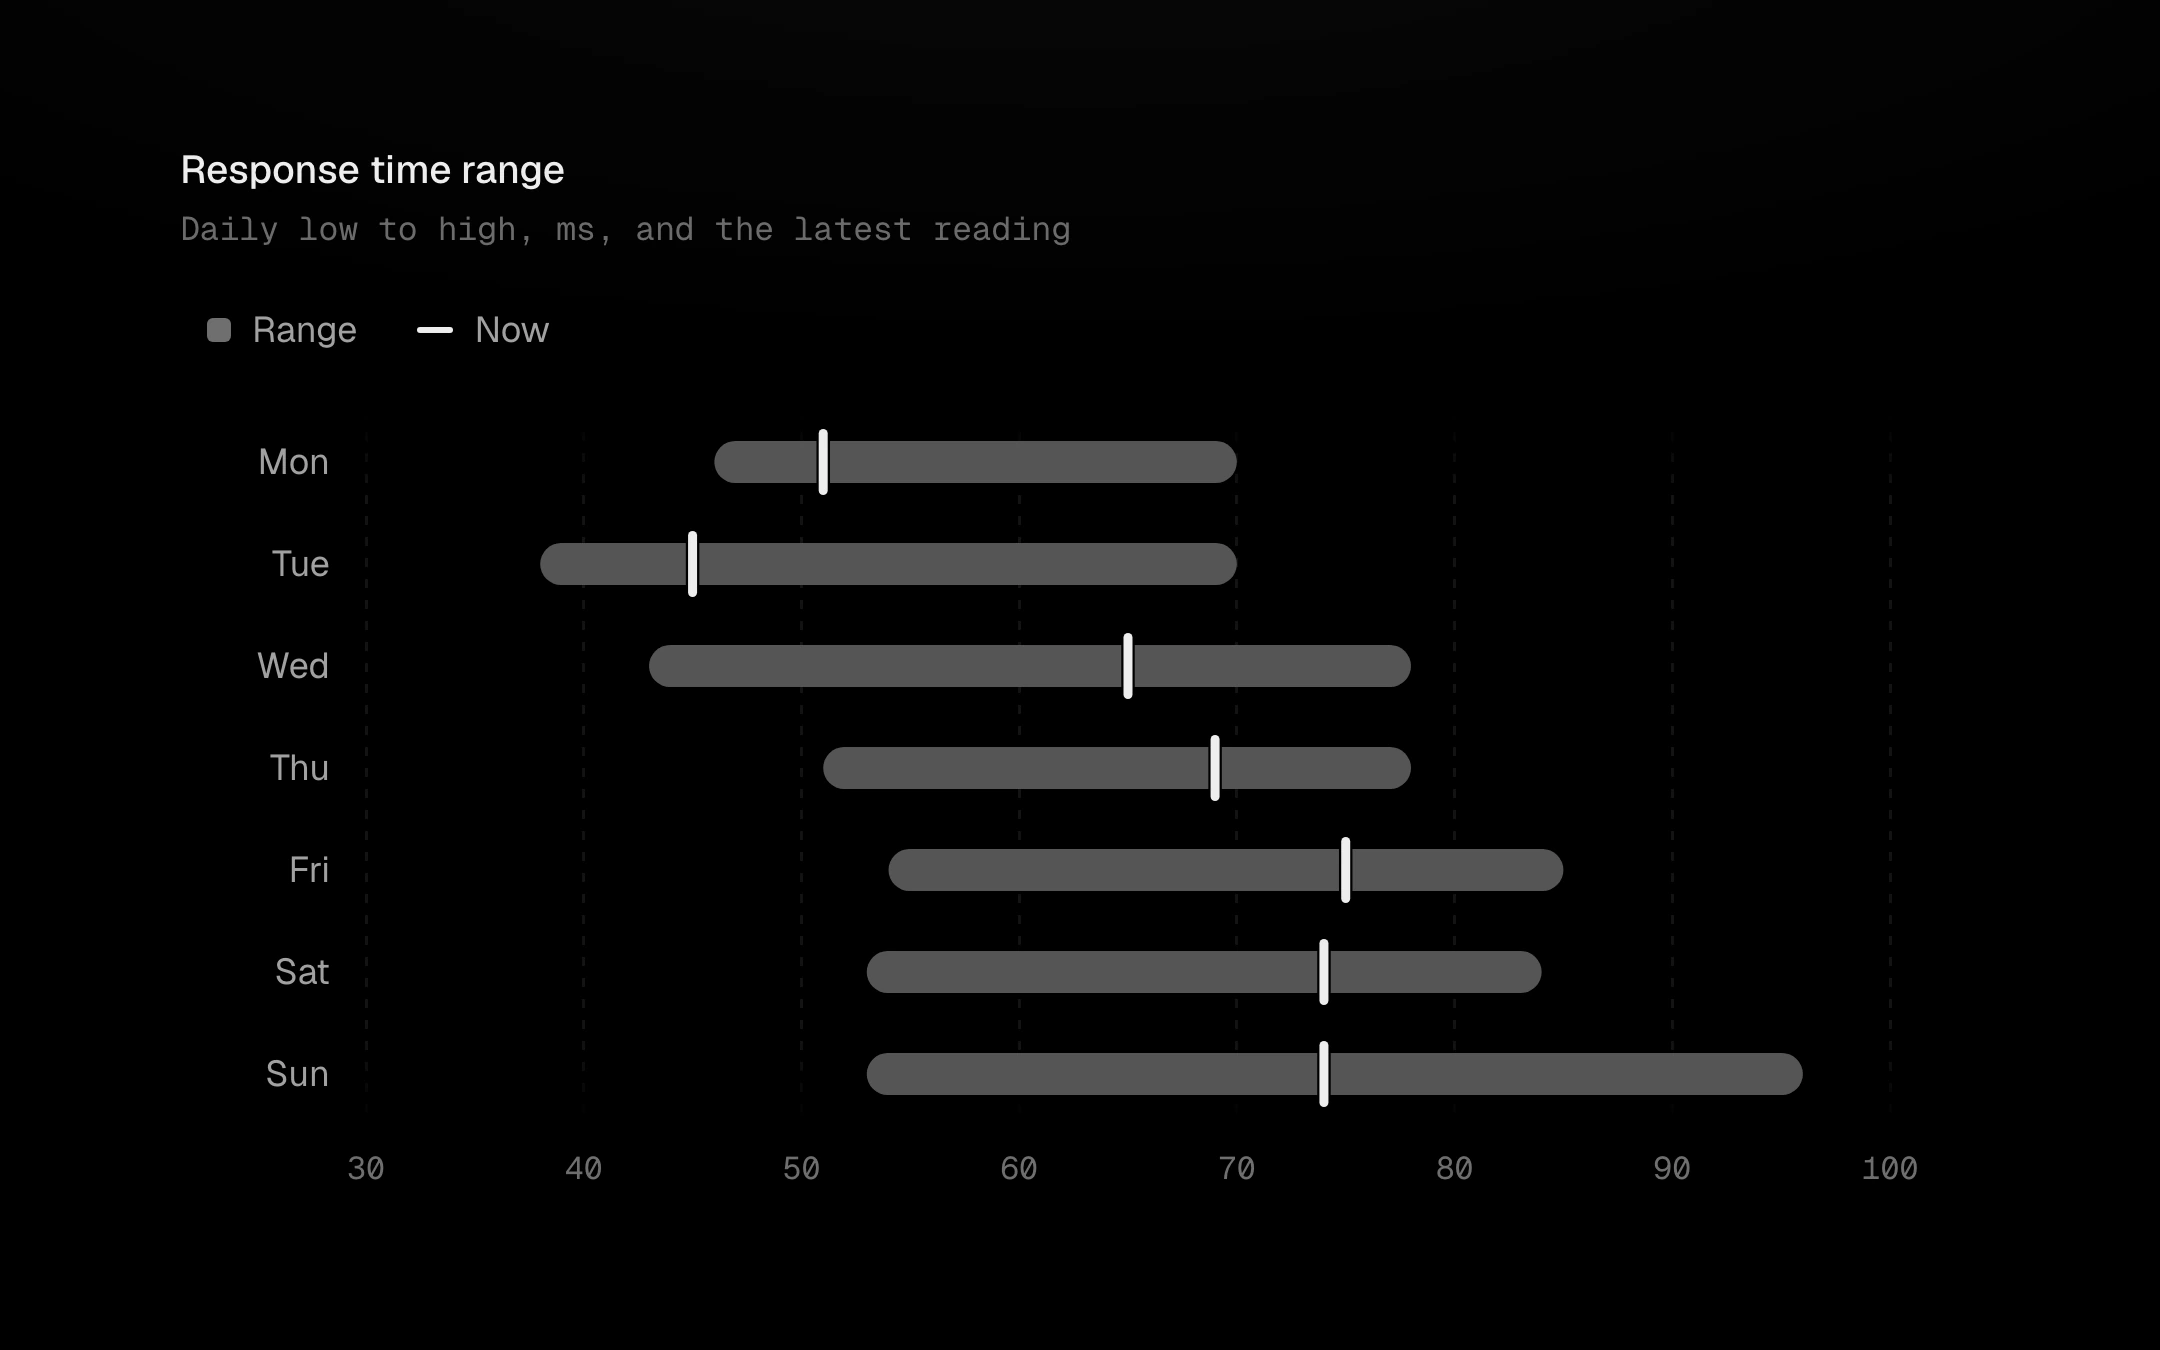
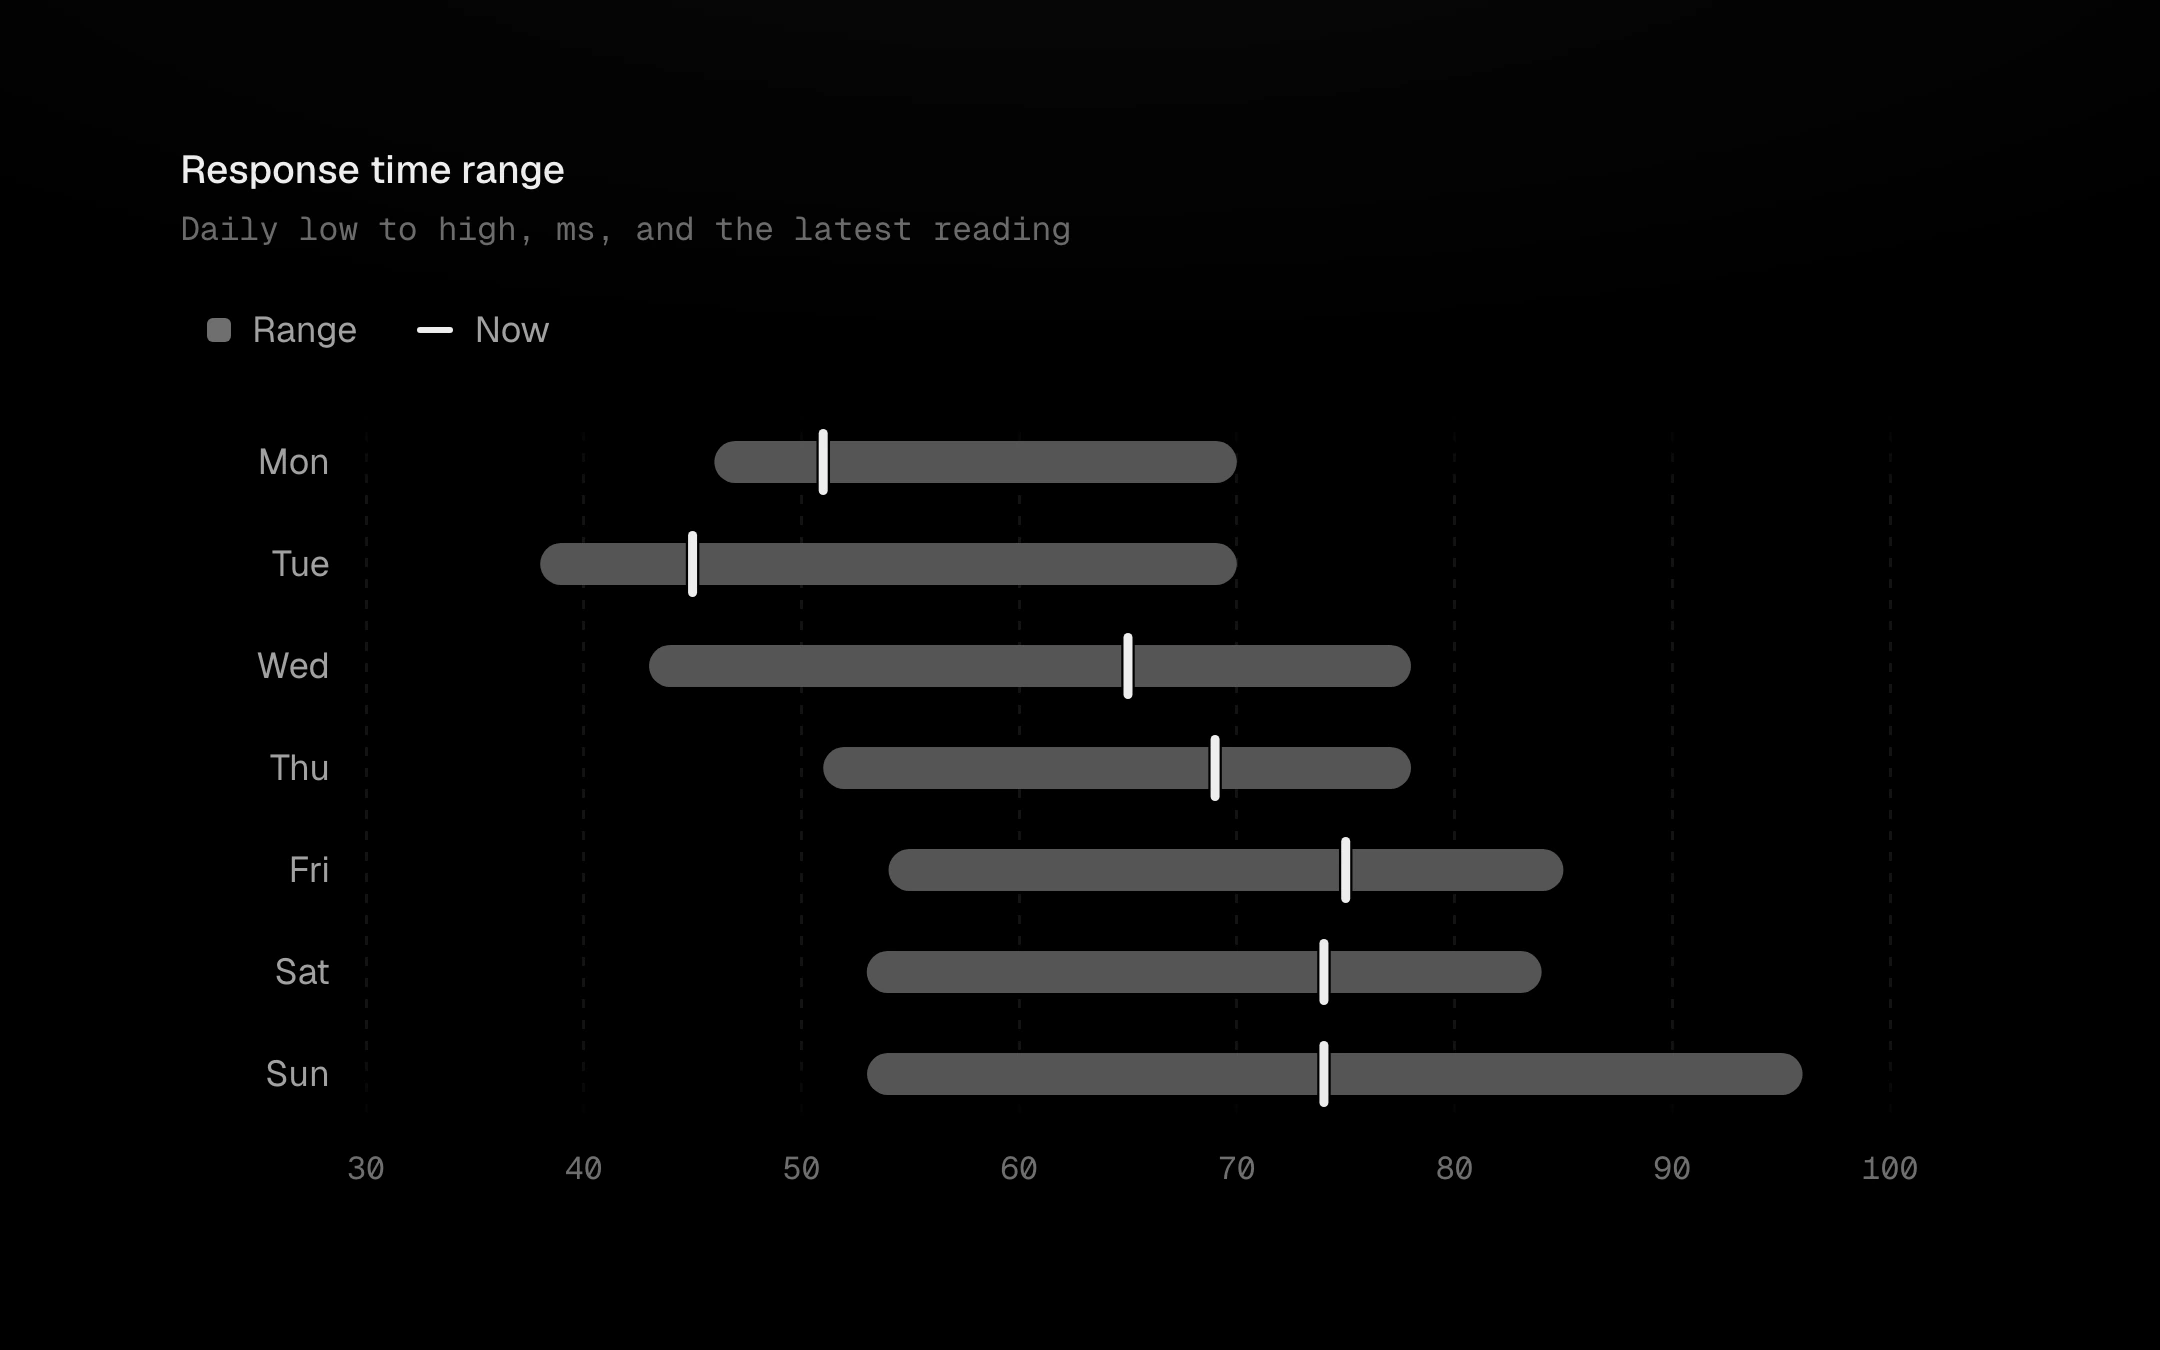
Floating bars, one per row, from a start to an end, with a capsule tick for the current value.
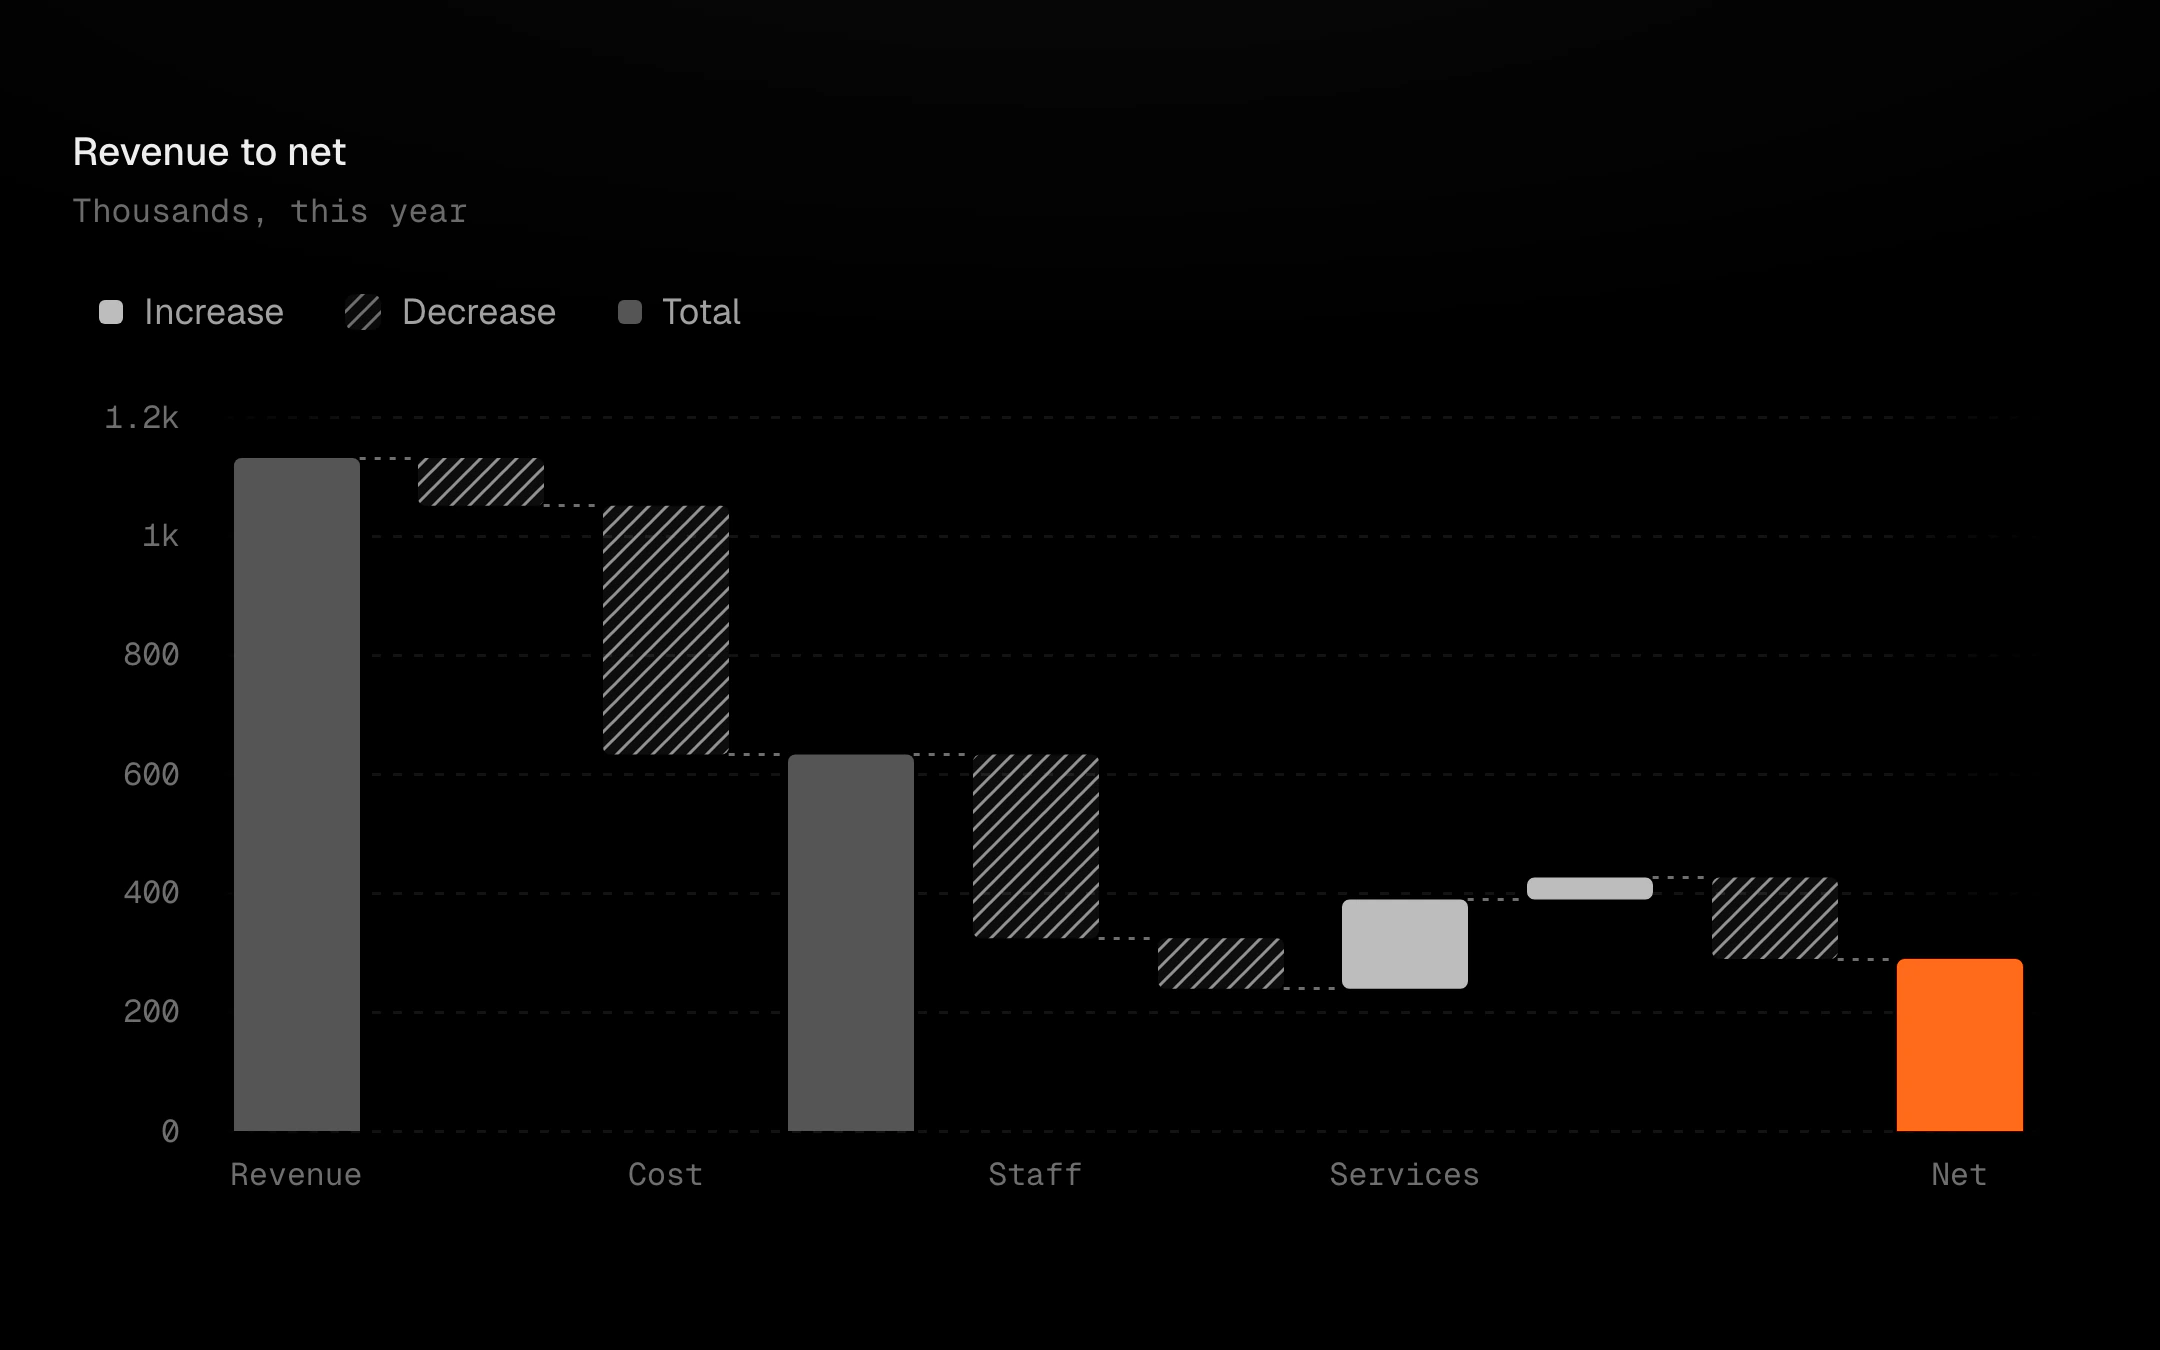
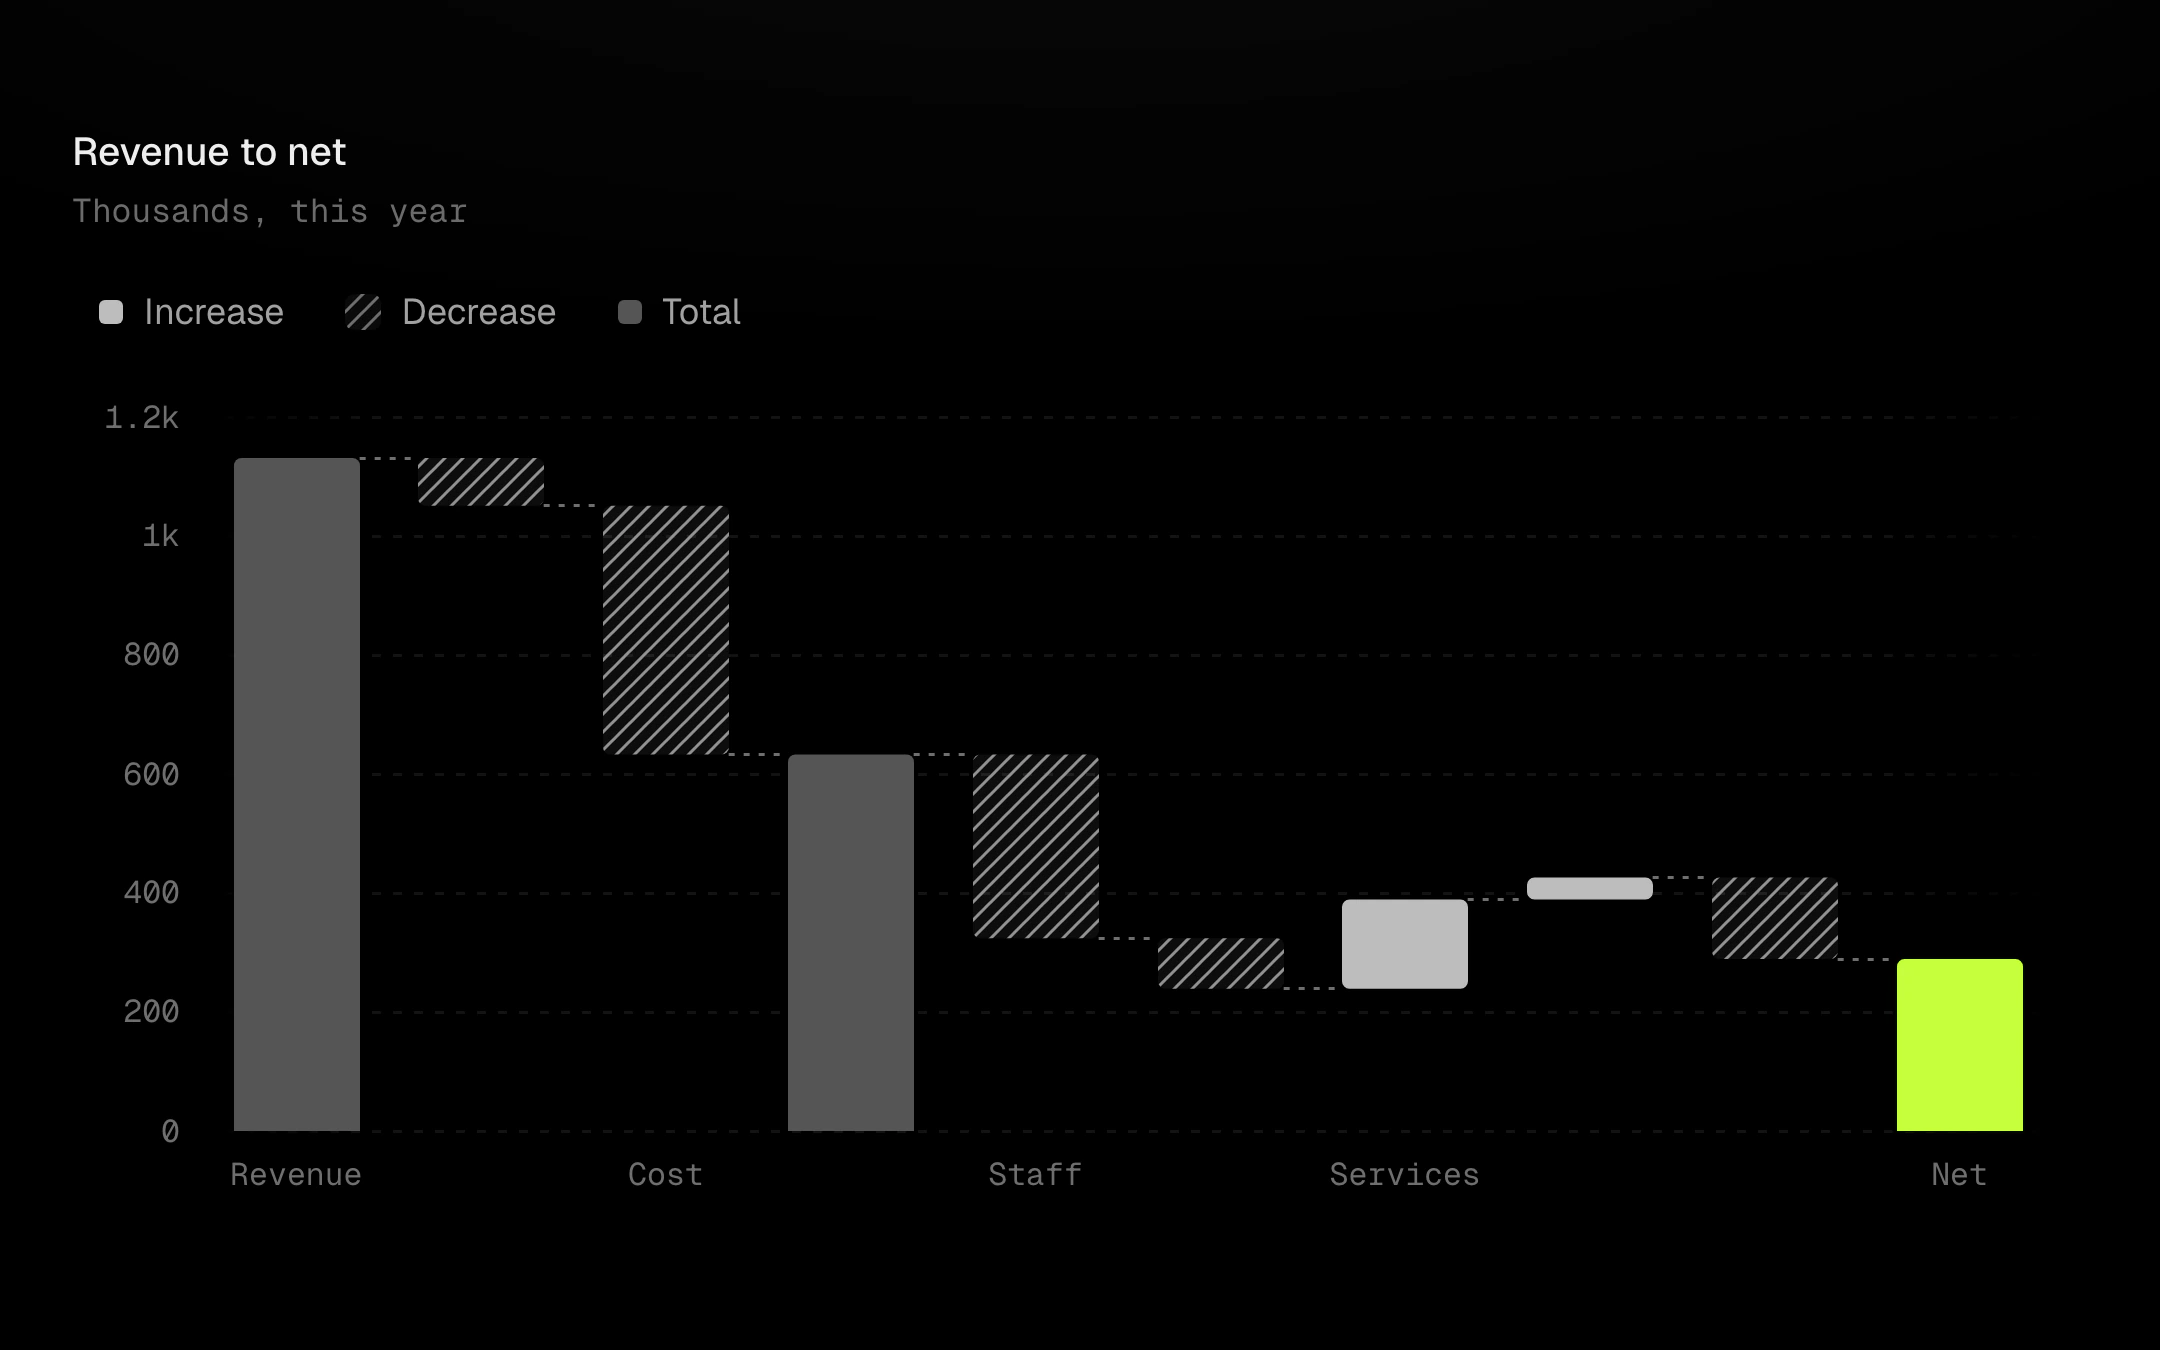
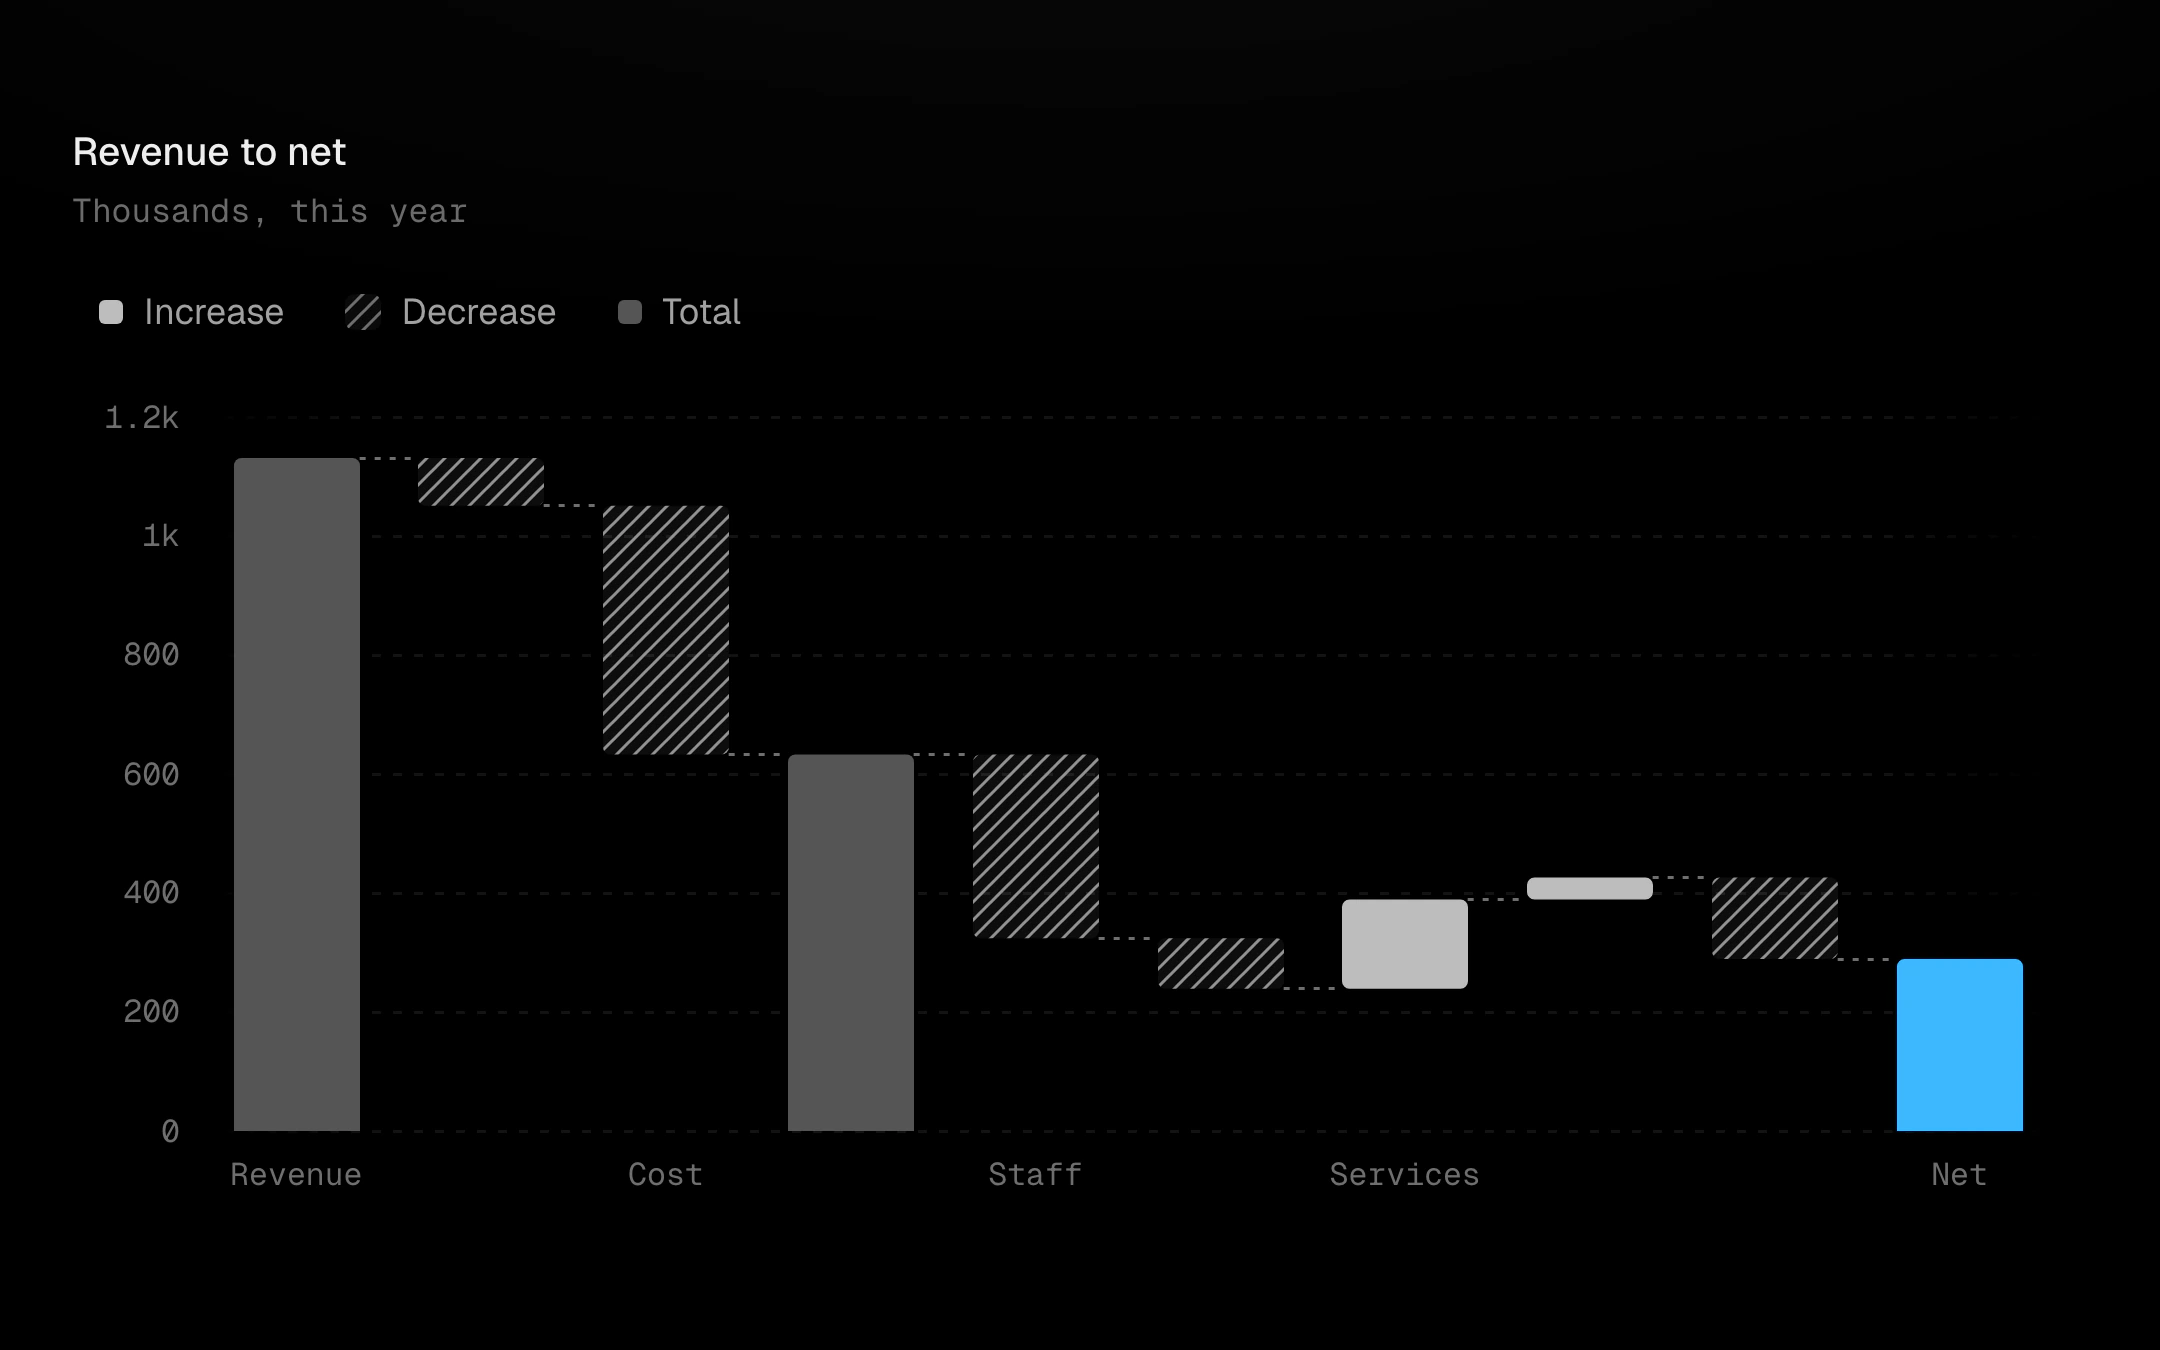
A start, the steps up and down, subtotals and the end.
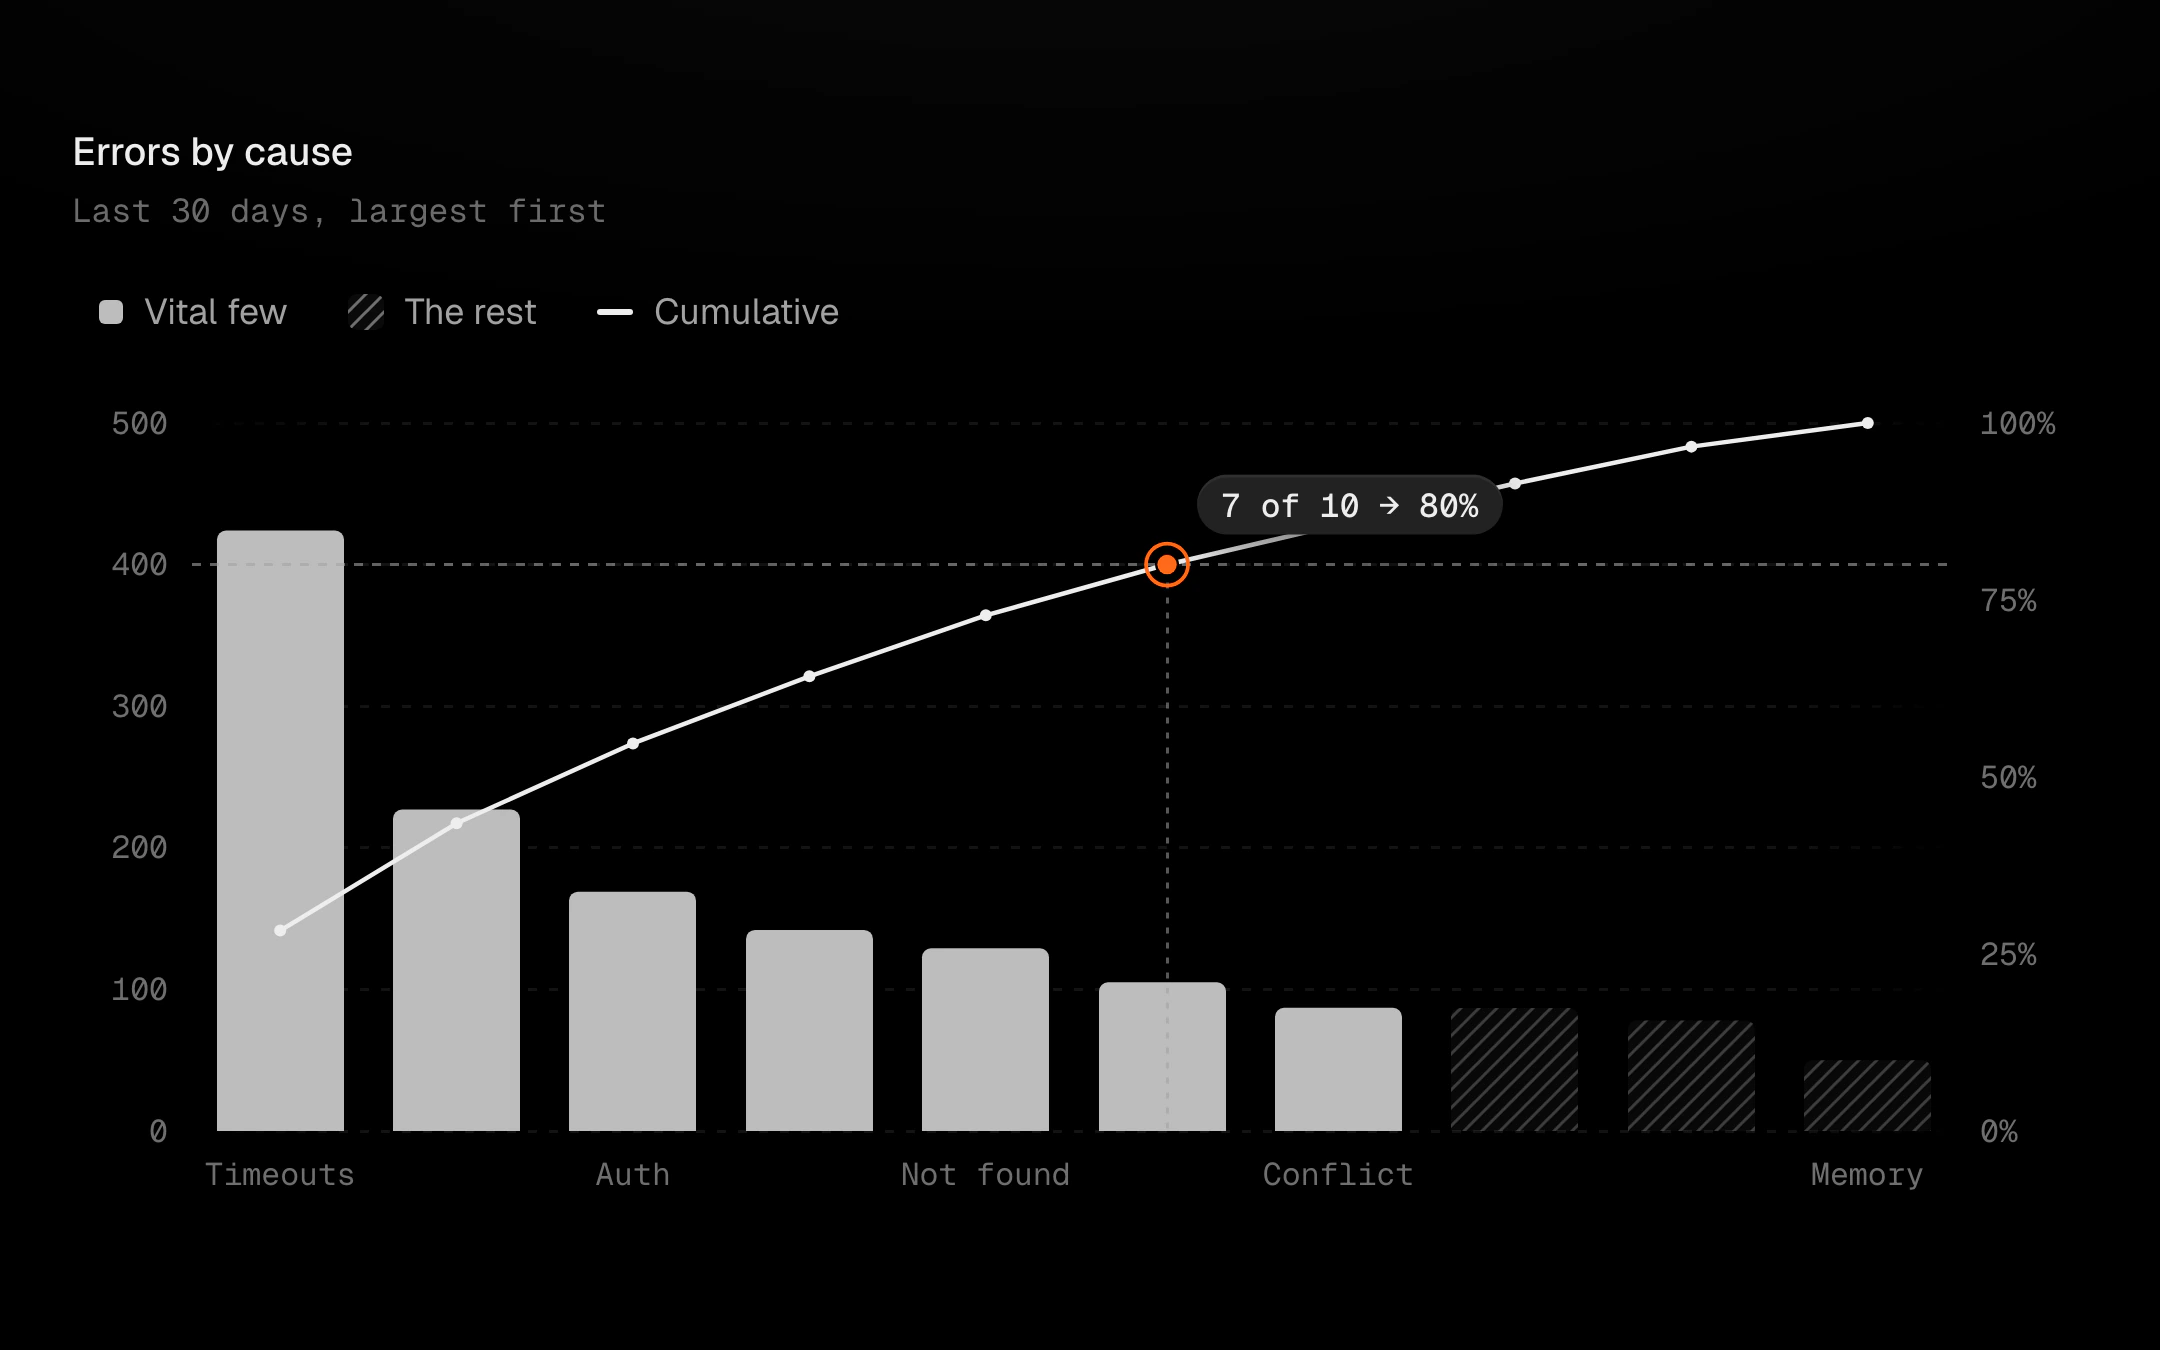
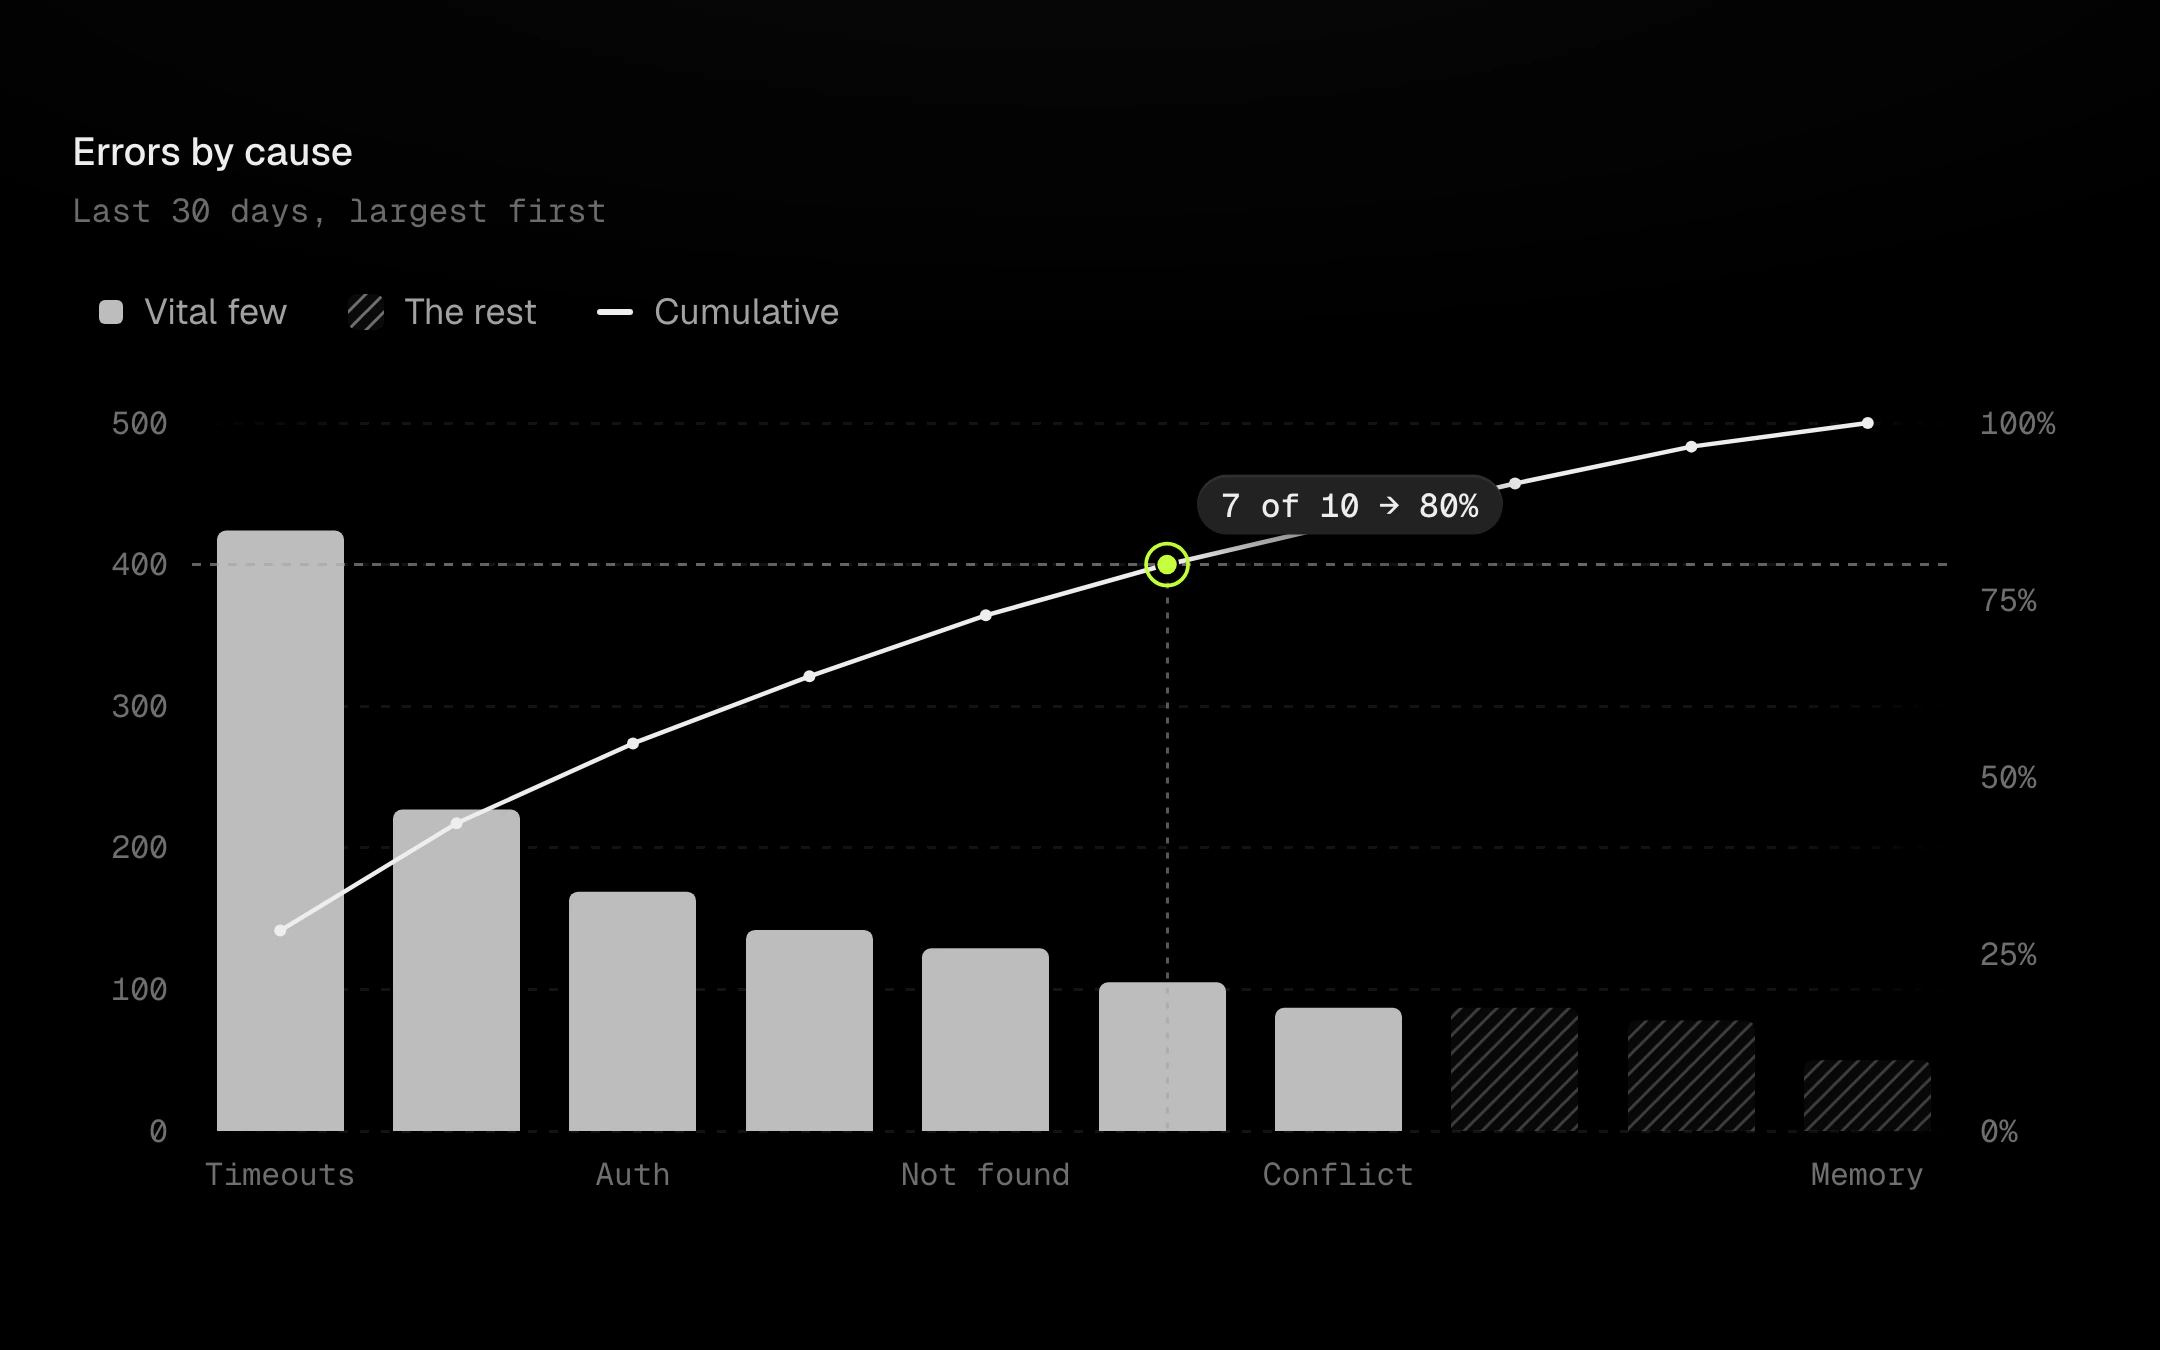
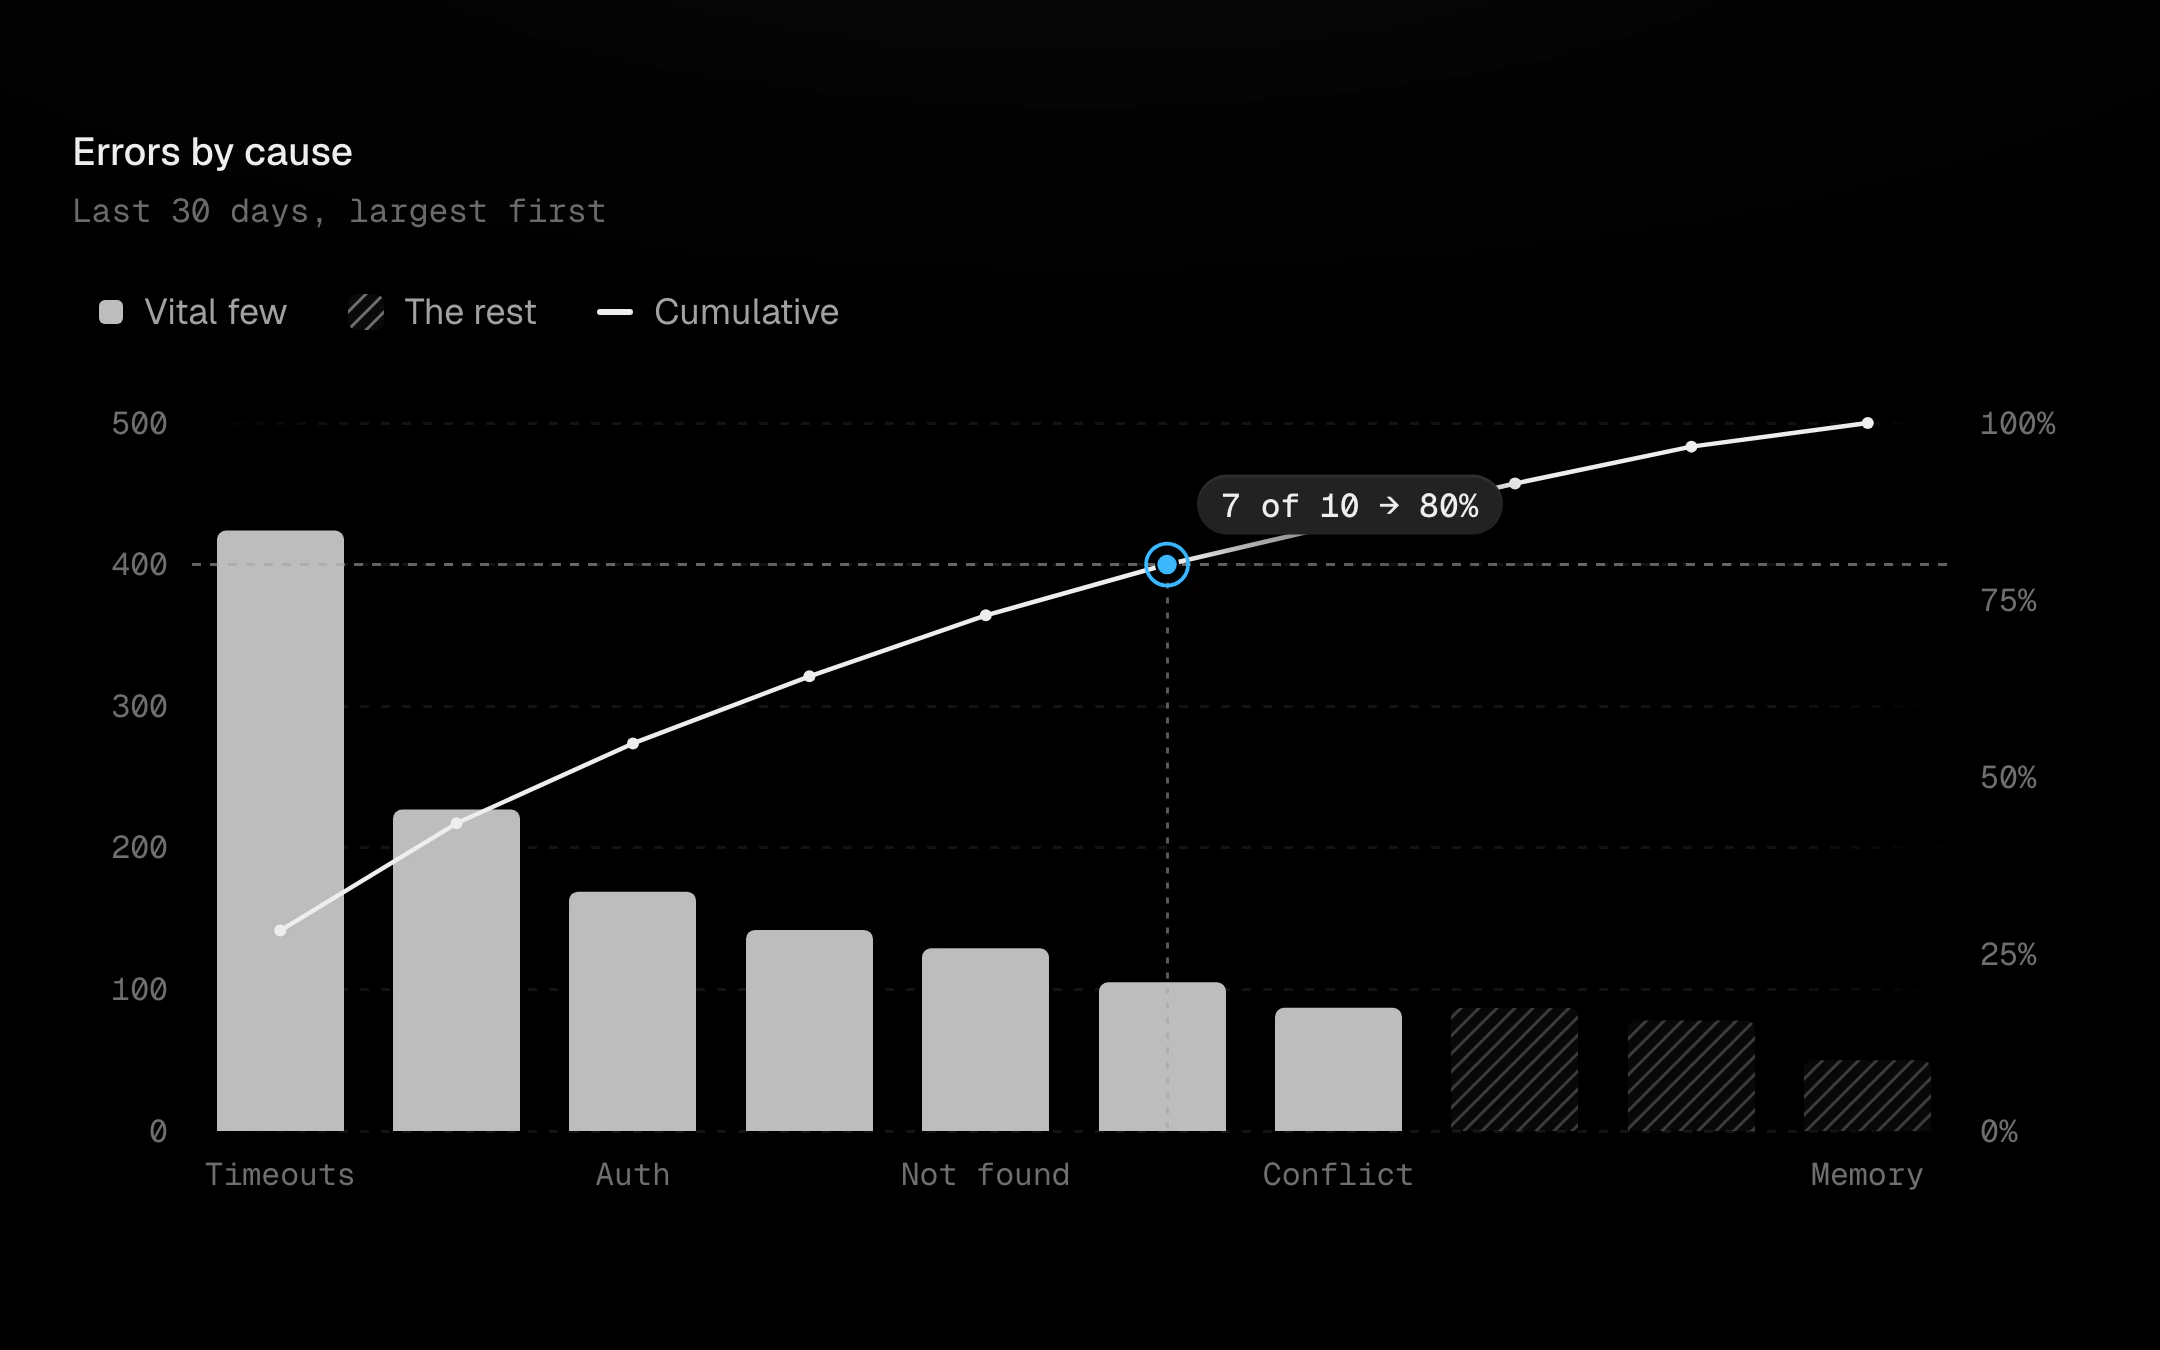
Causes sorted largest first as bars, with the cumulative share as a line on a 0 to 100% axis.
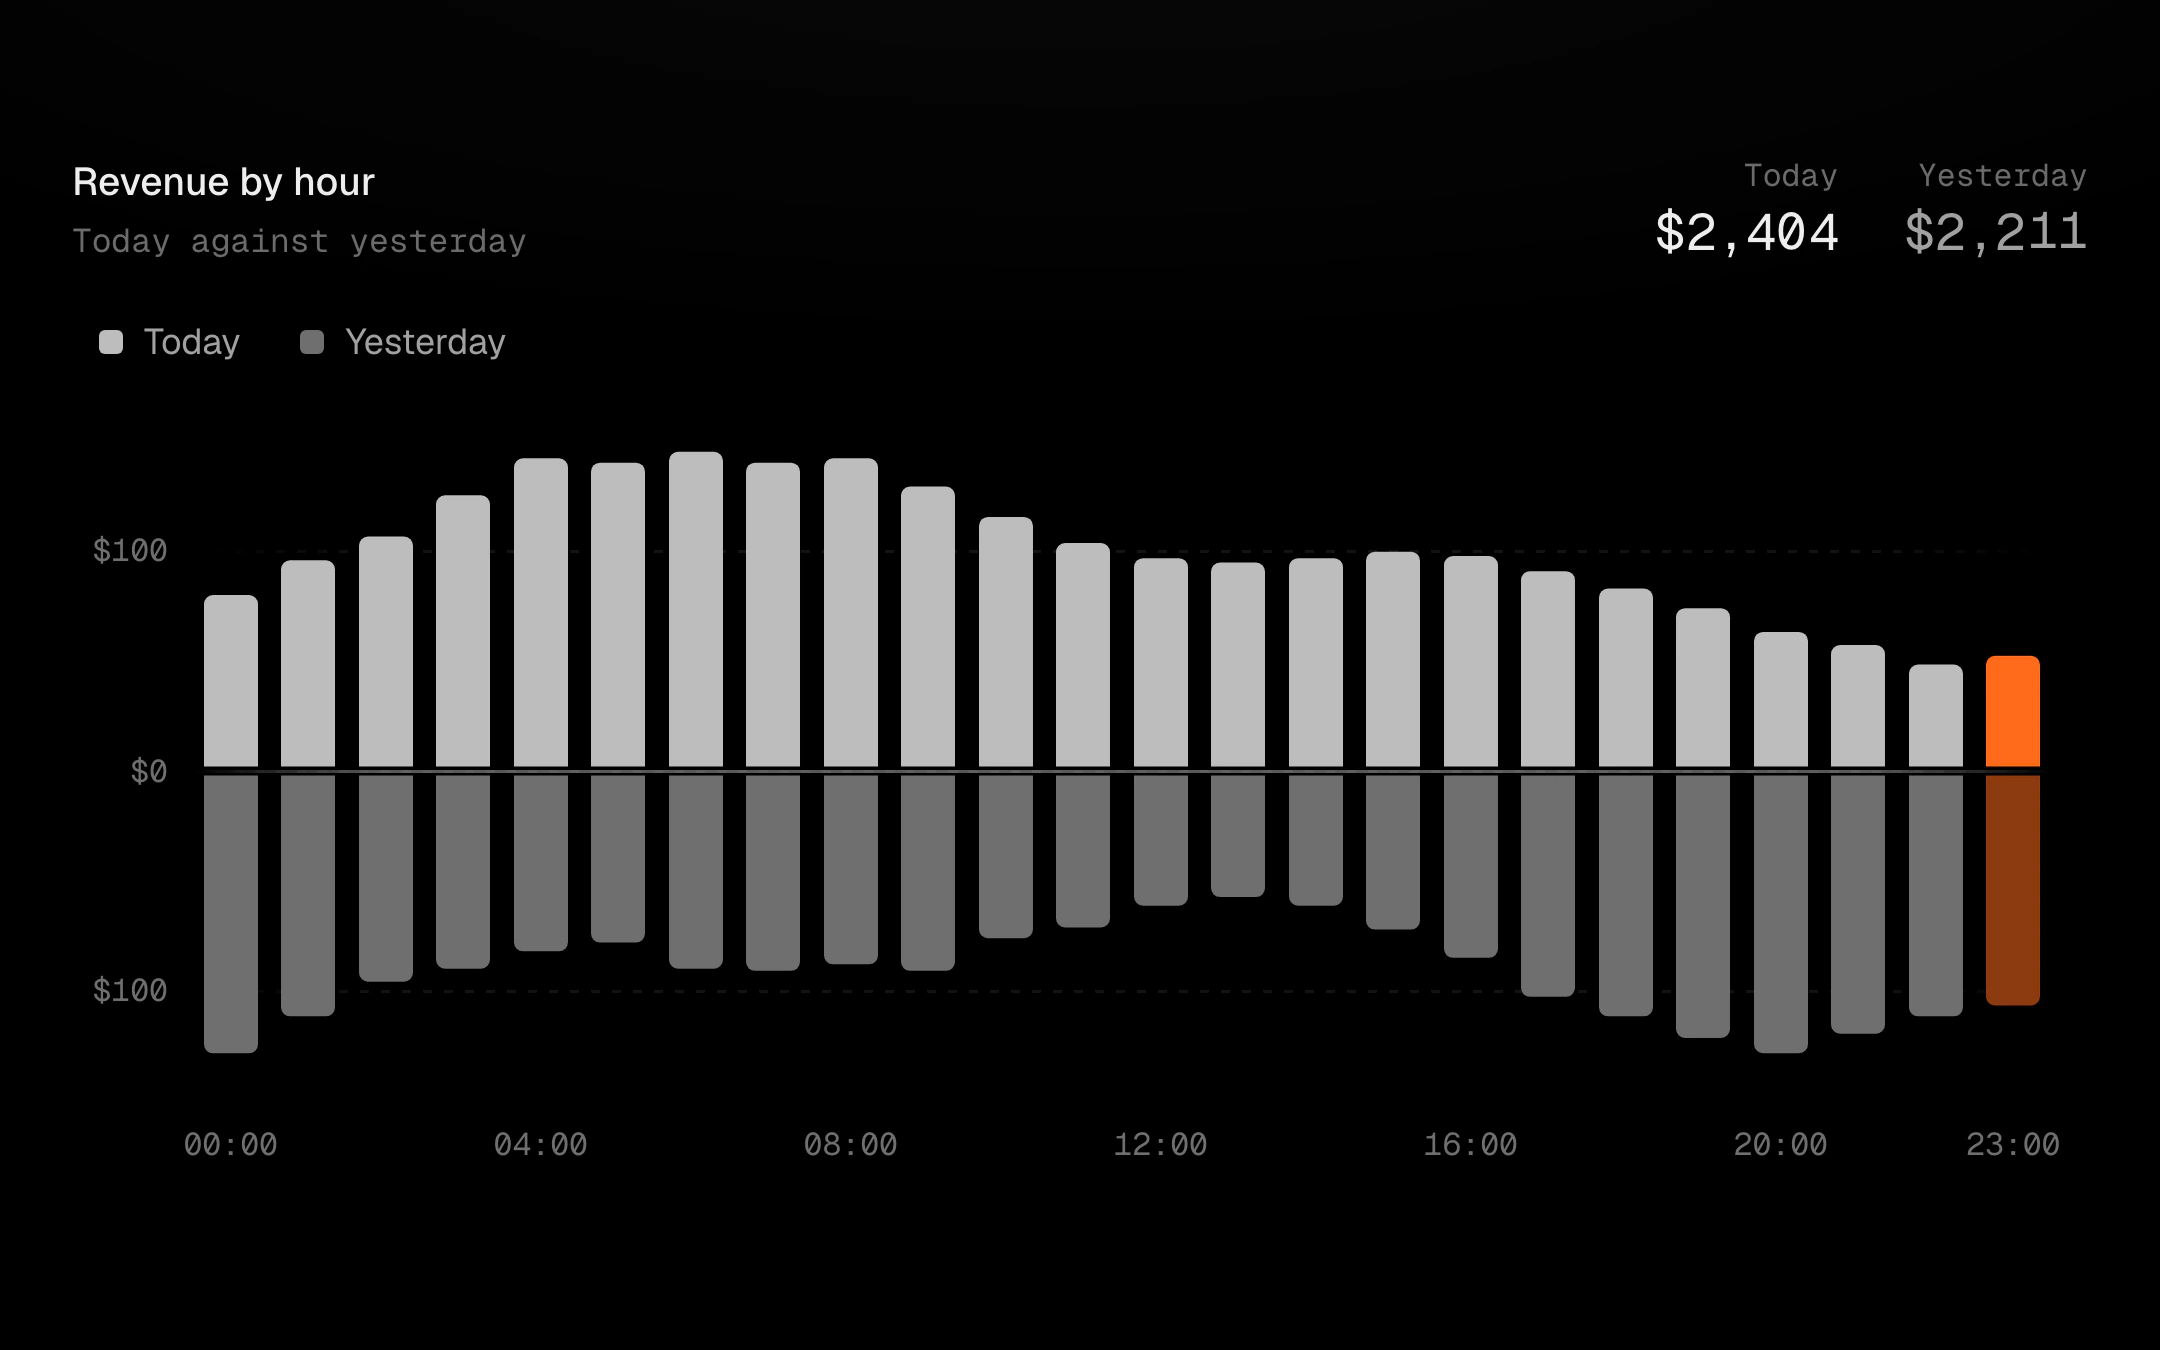
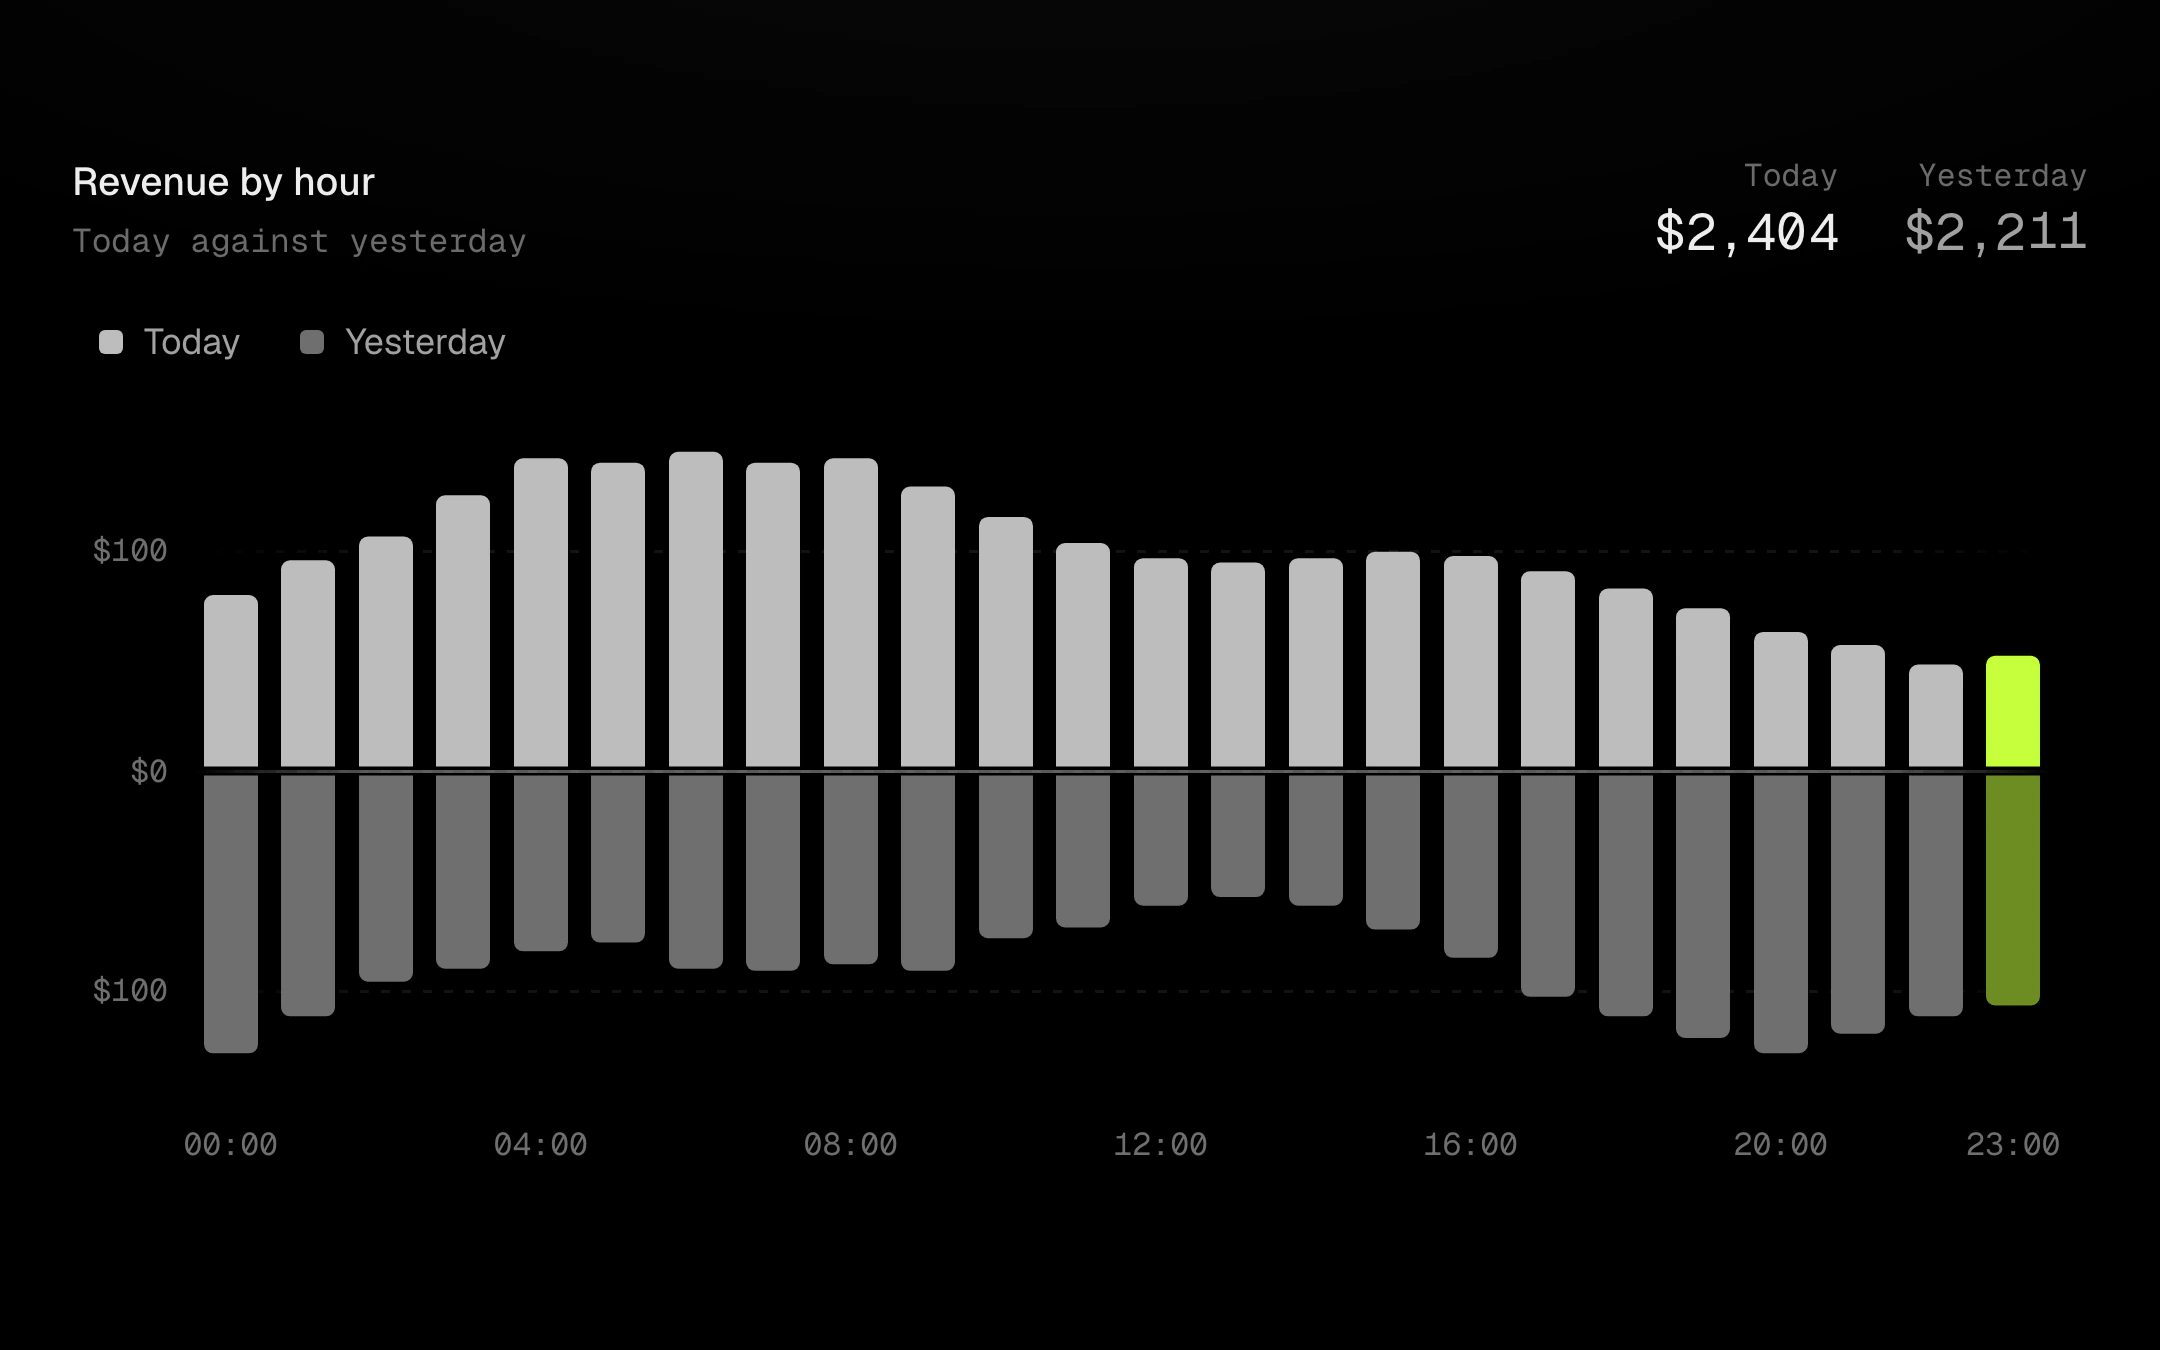
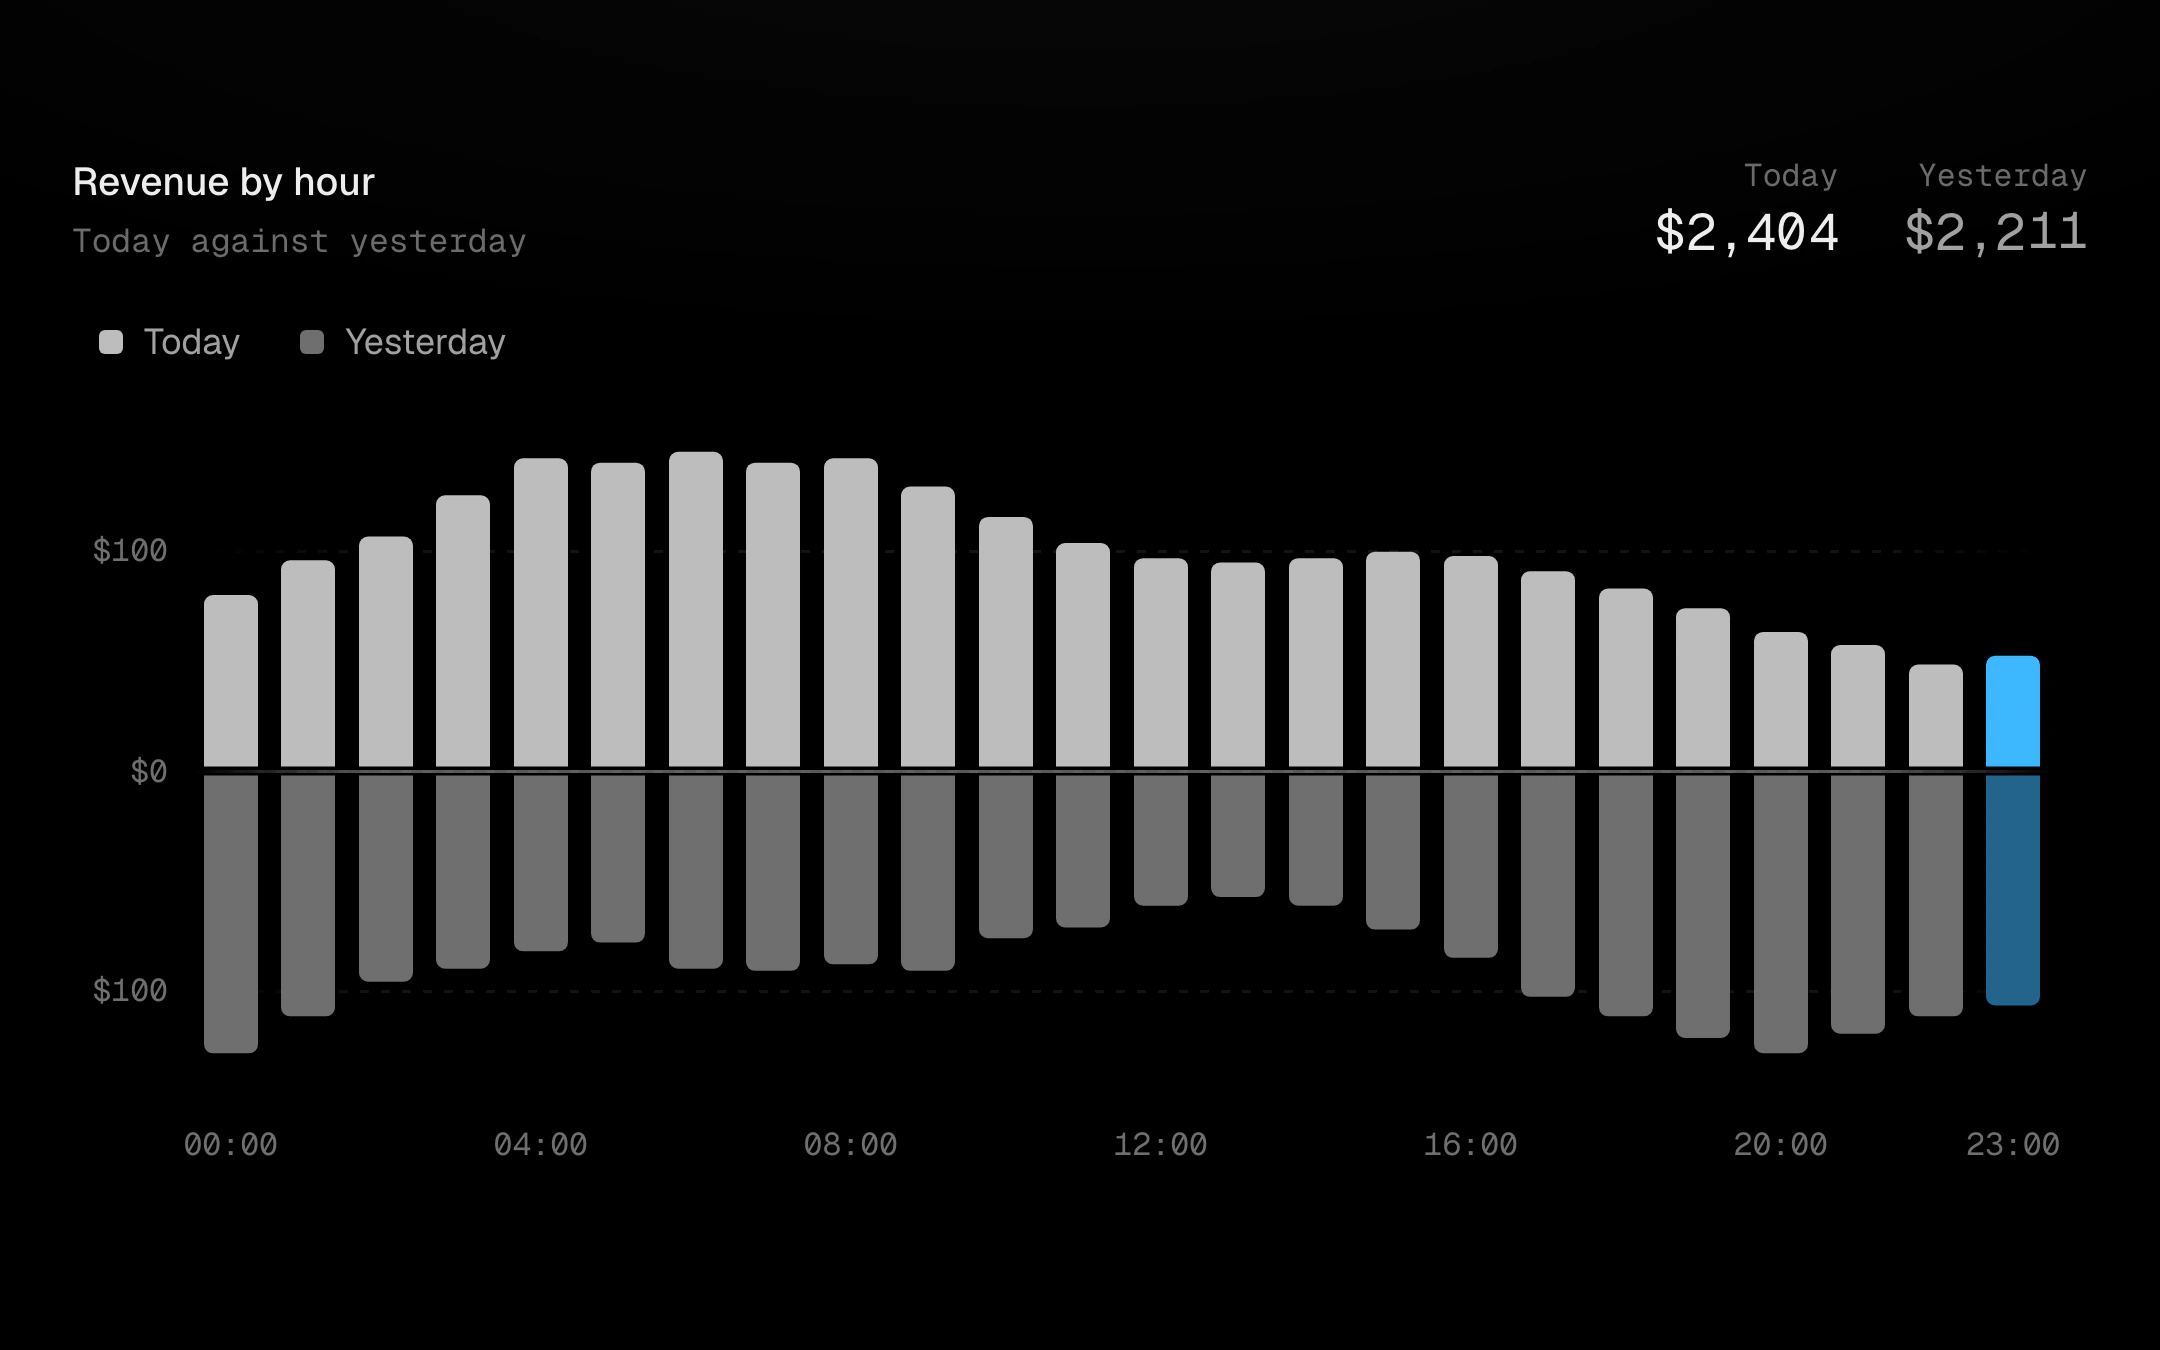
Bars grow away from a highlighted midline, up and down or left and right.
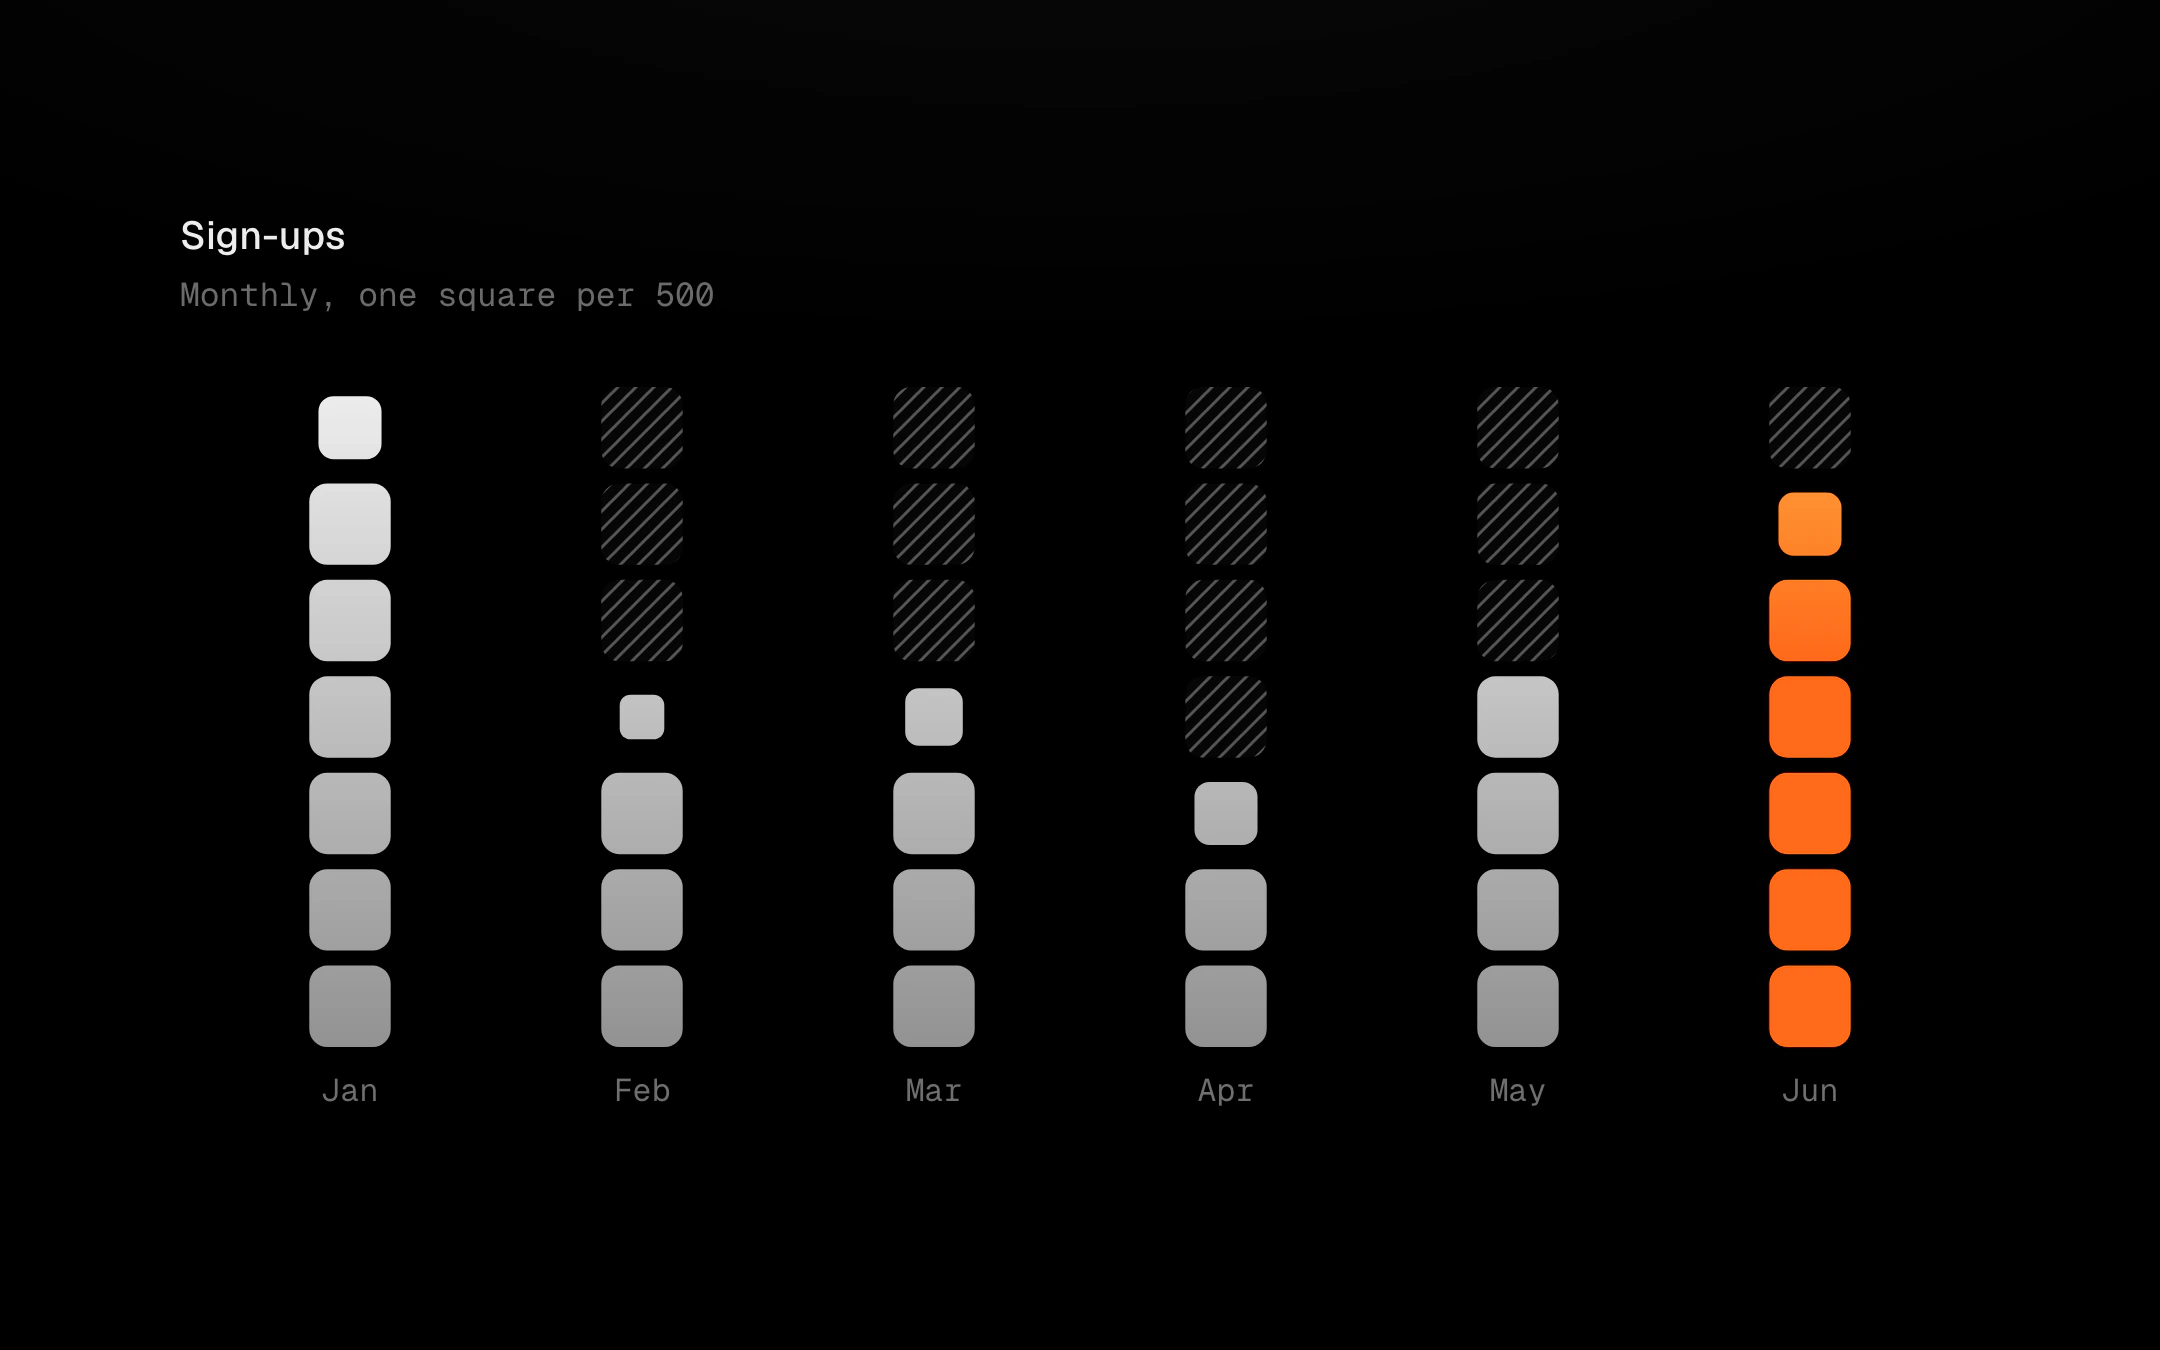
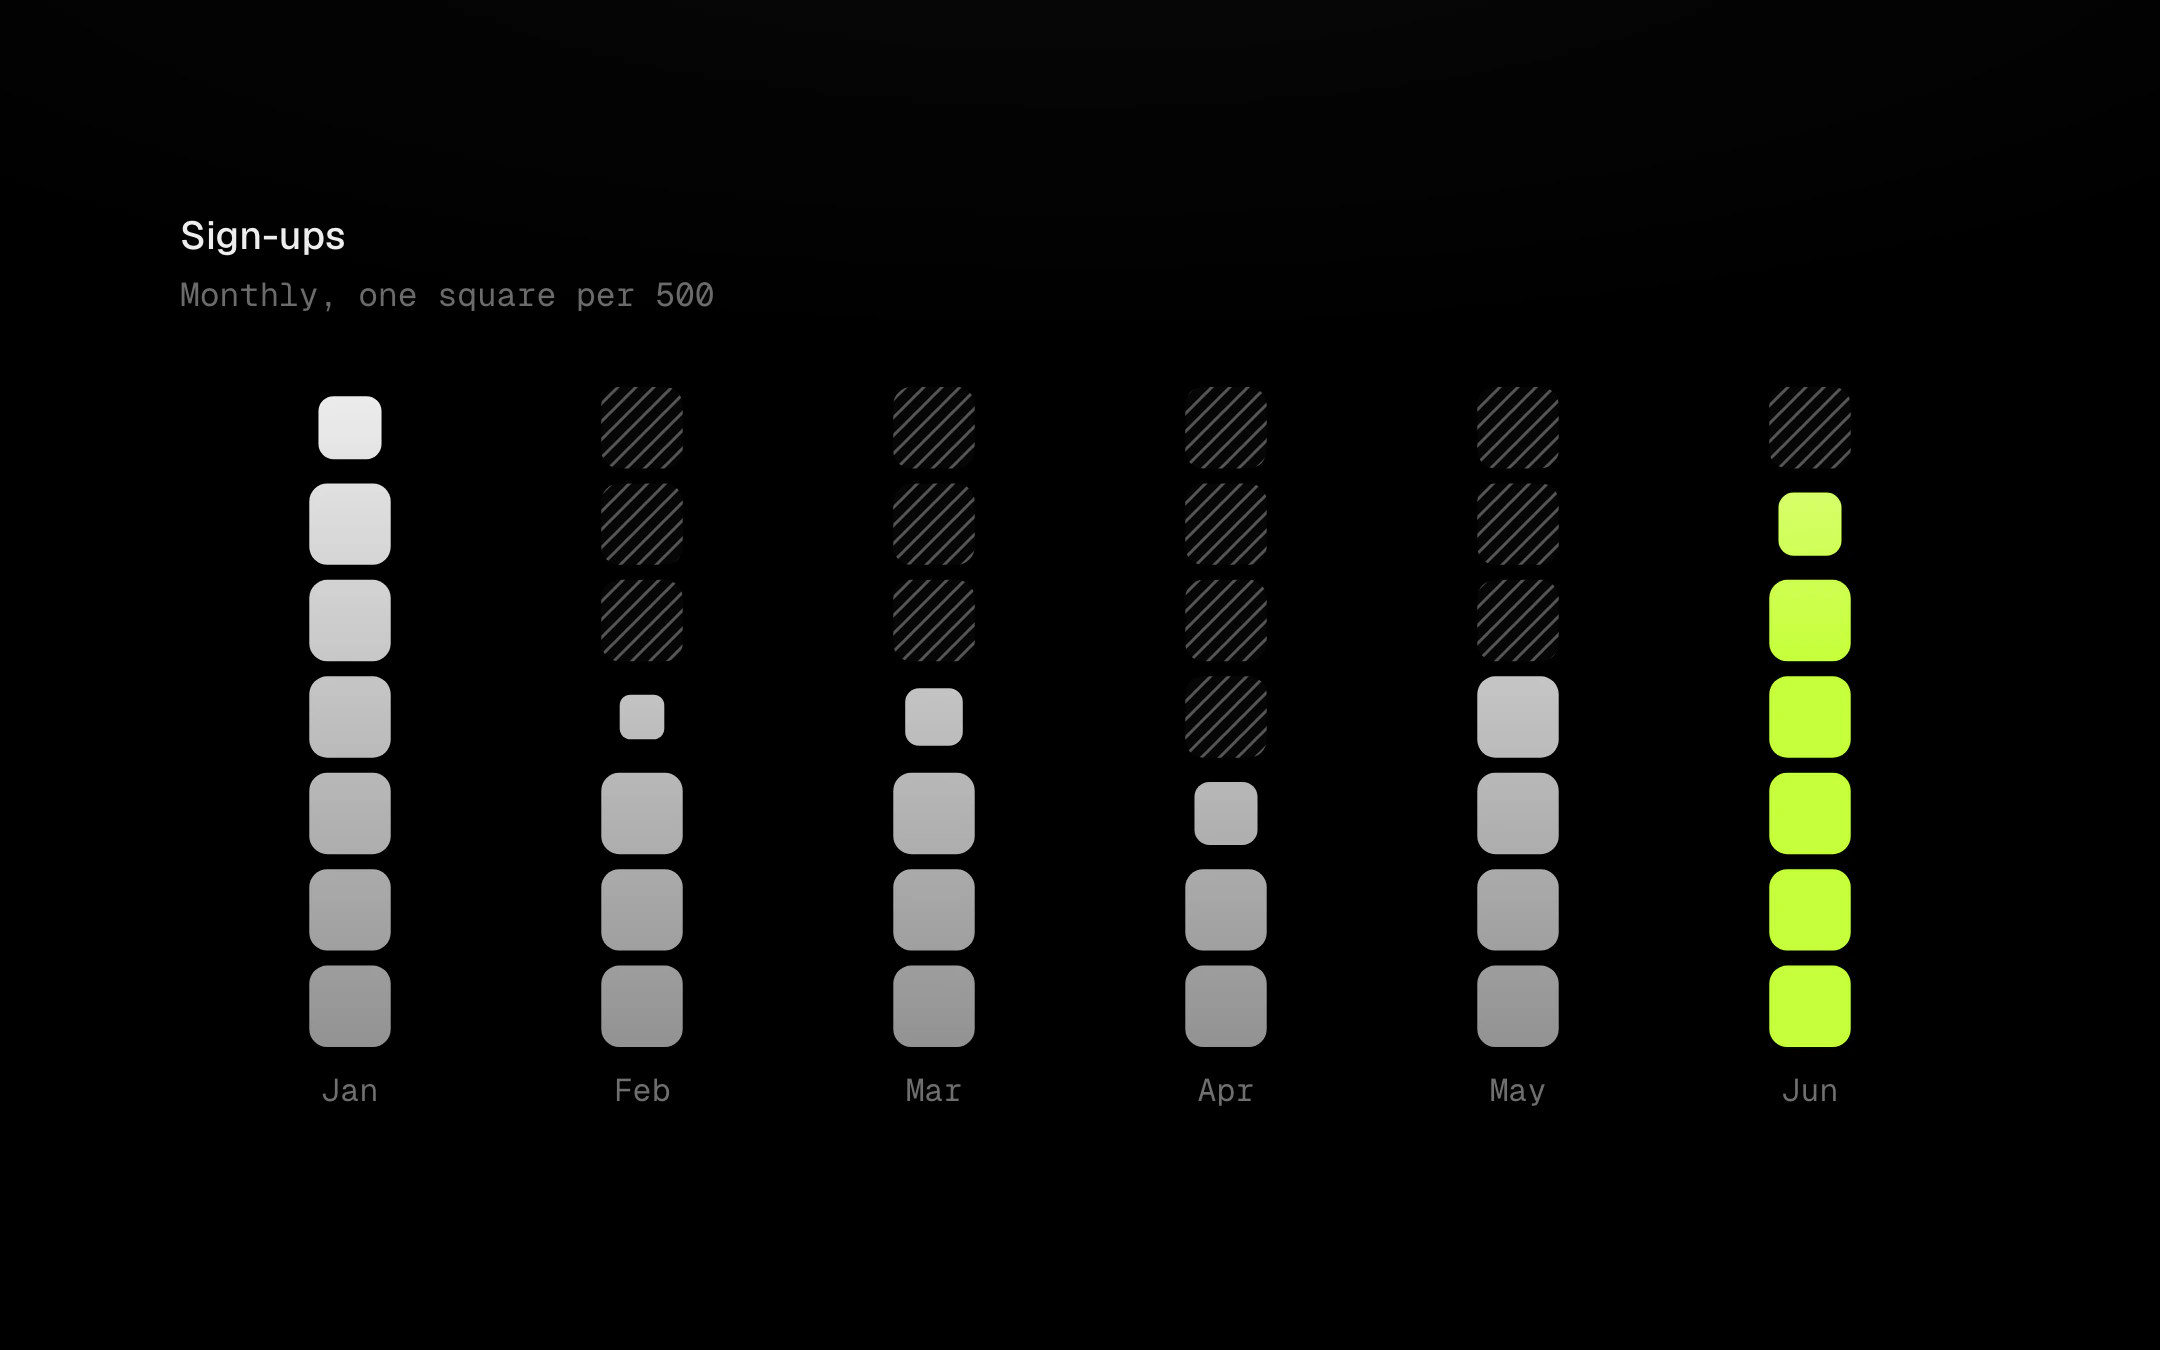
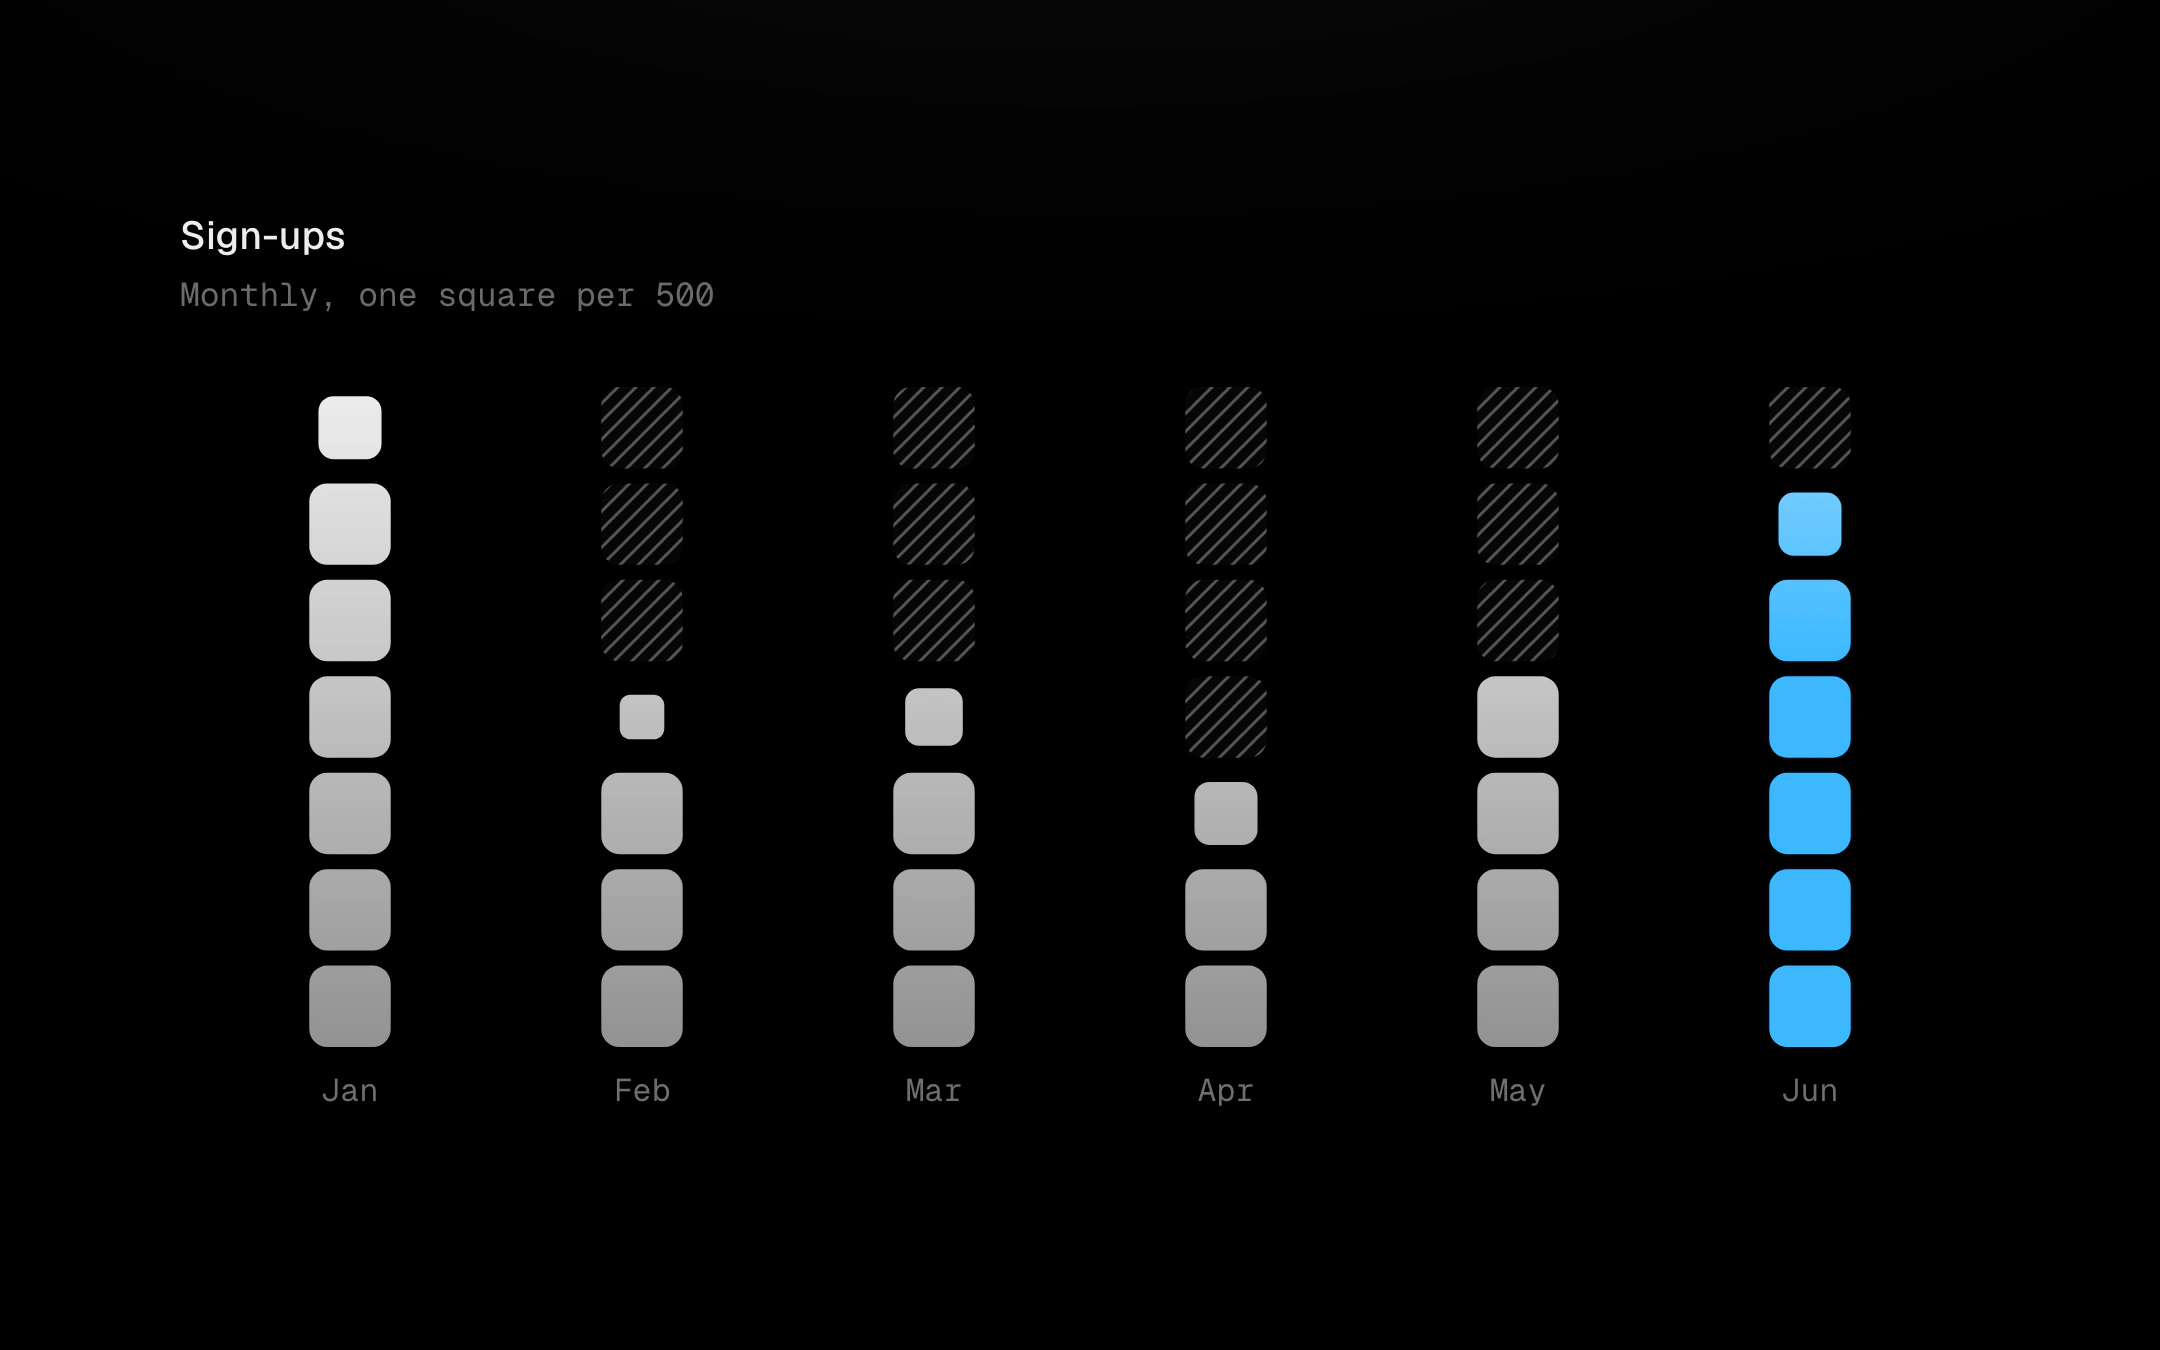
Columns counted out in rounded squares, one per unit, over a faded hatched track that shows how far the scale goes.
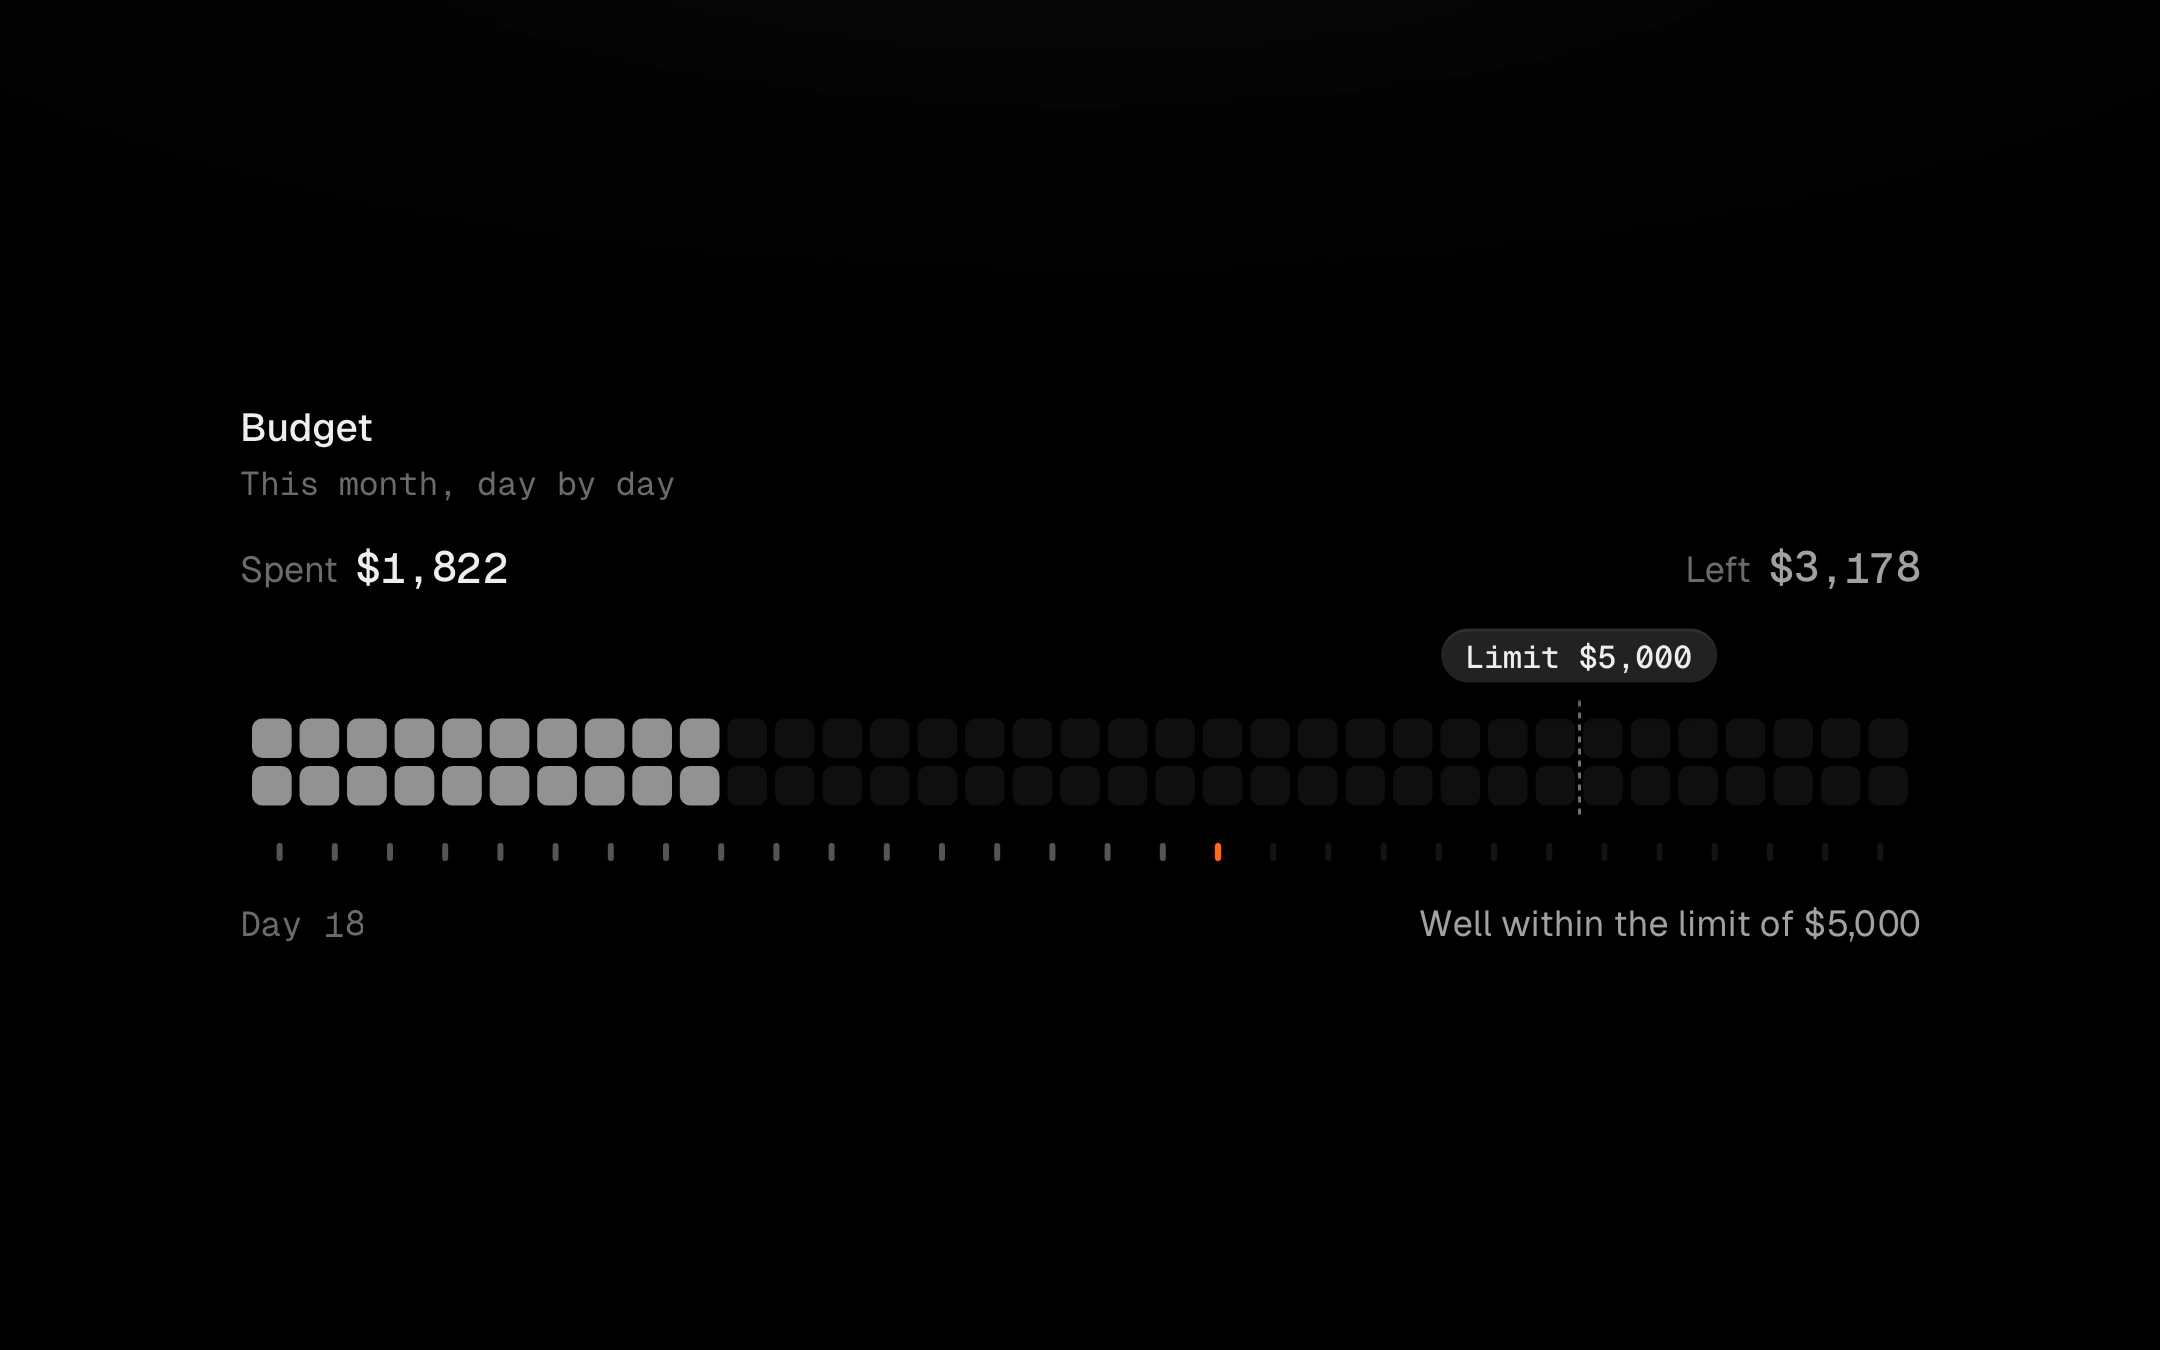
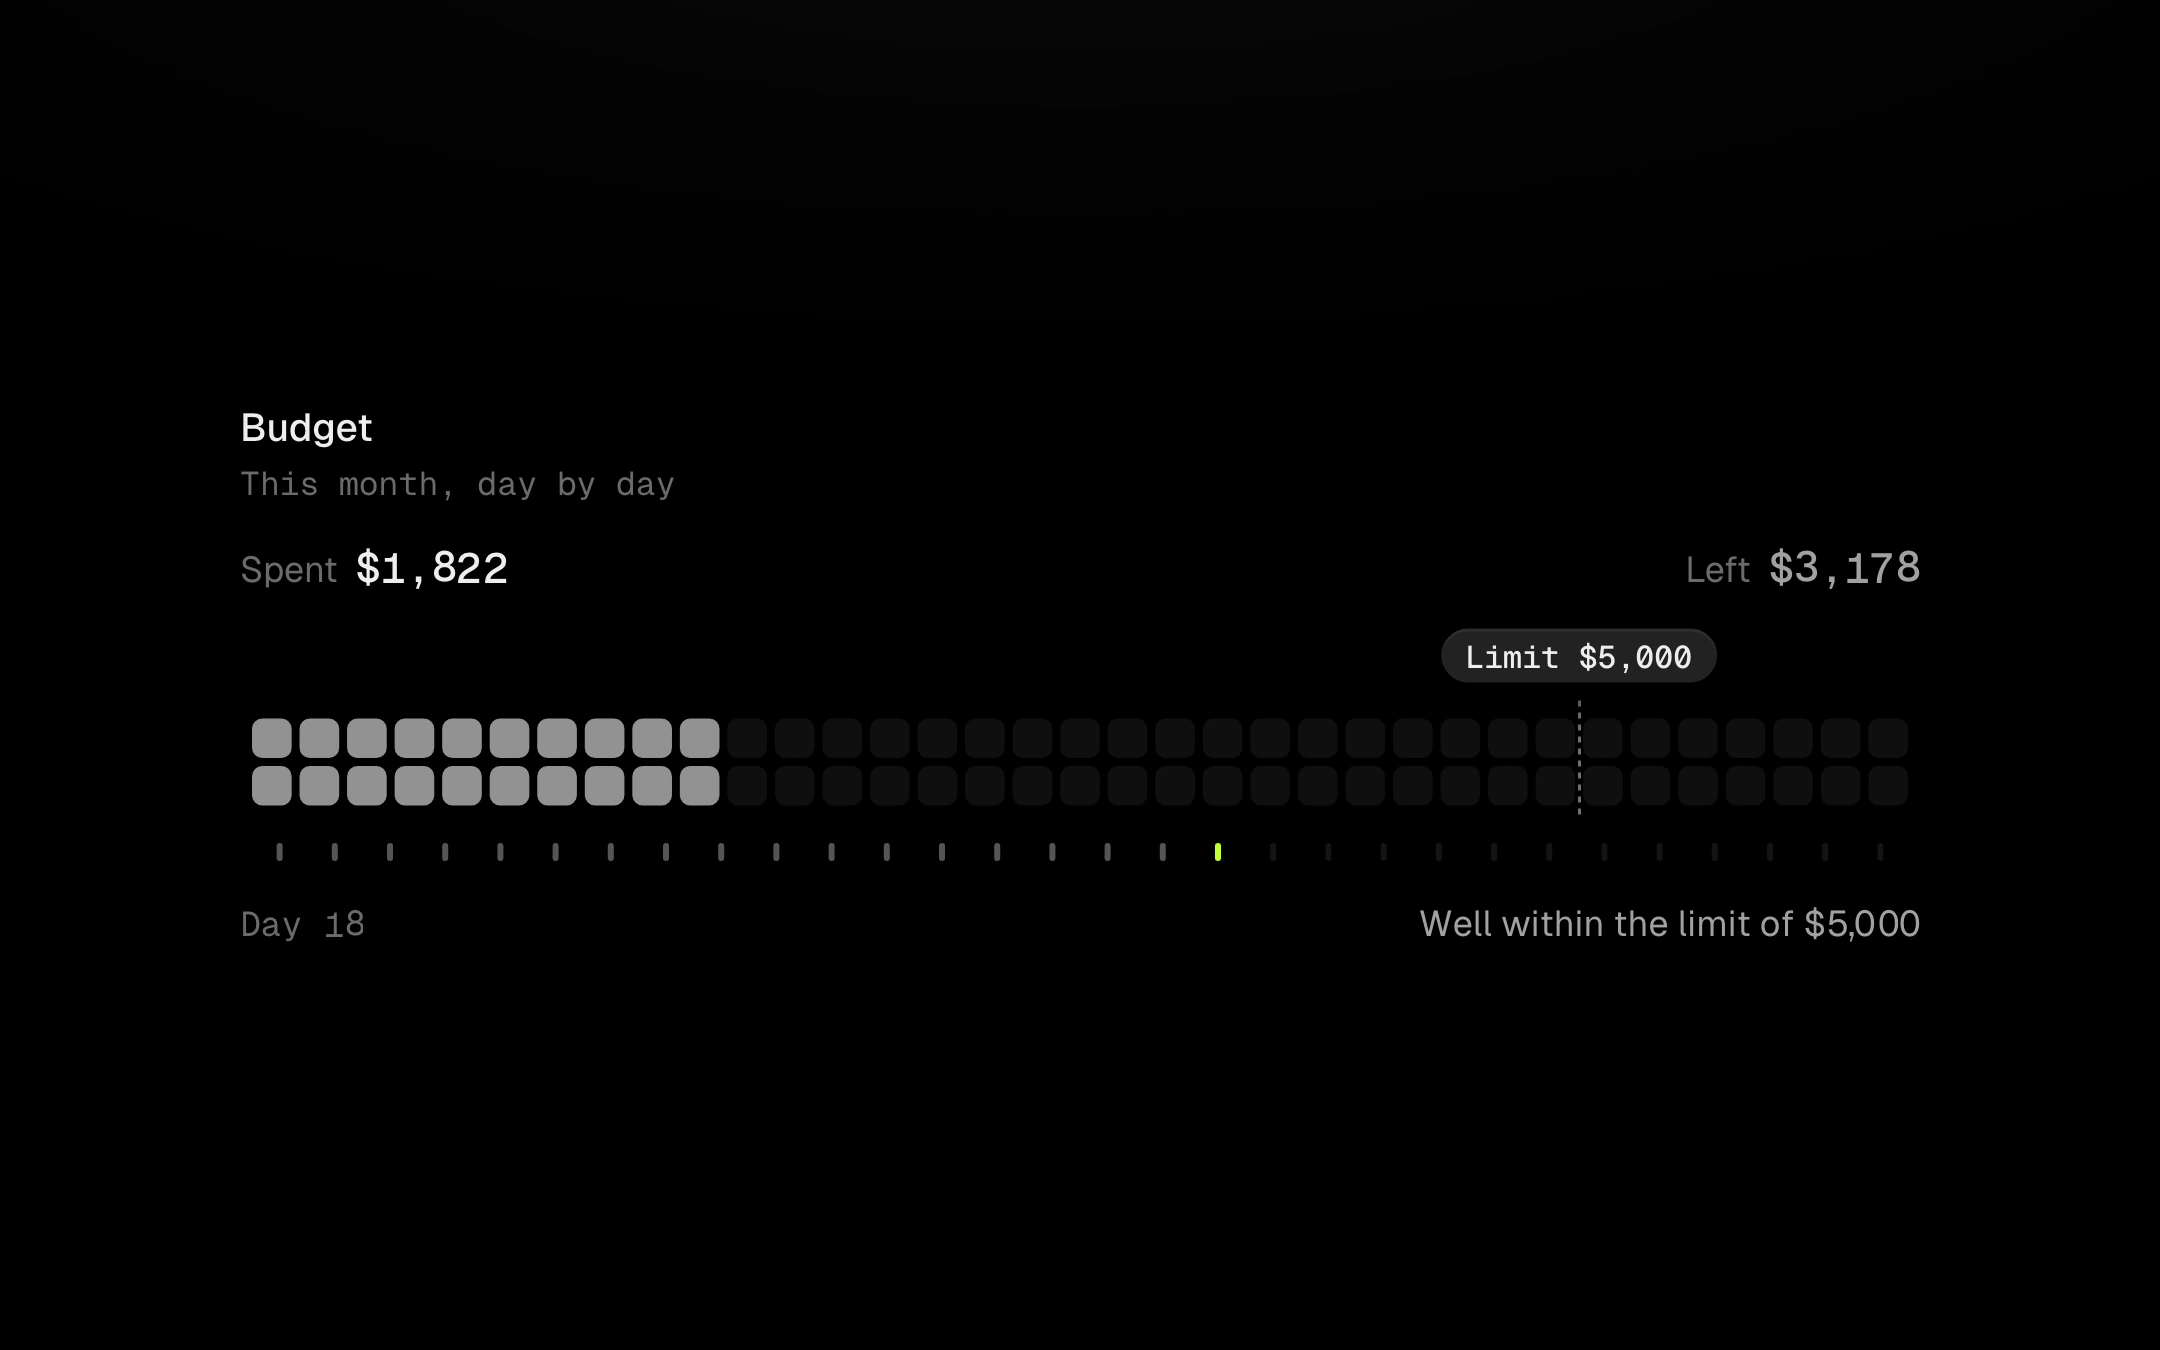
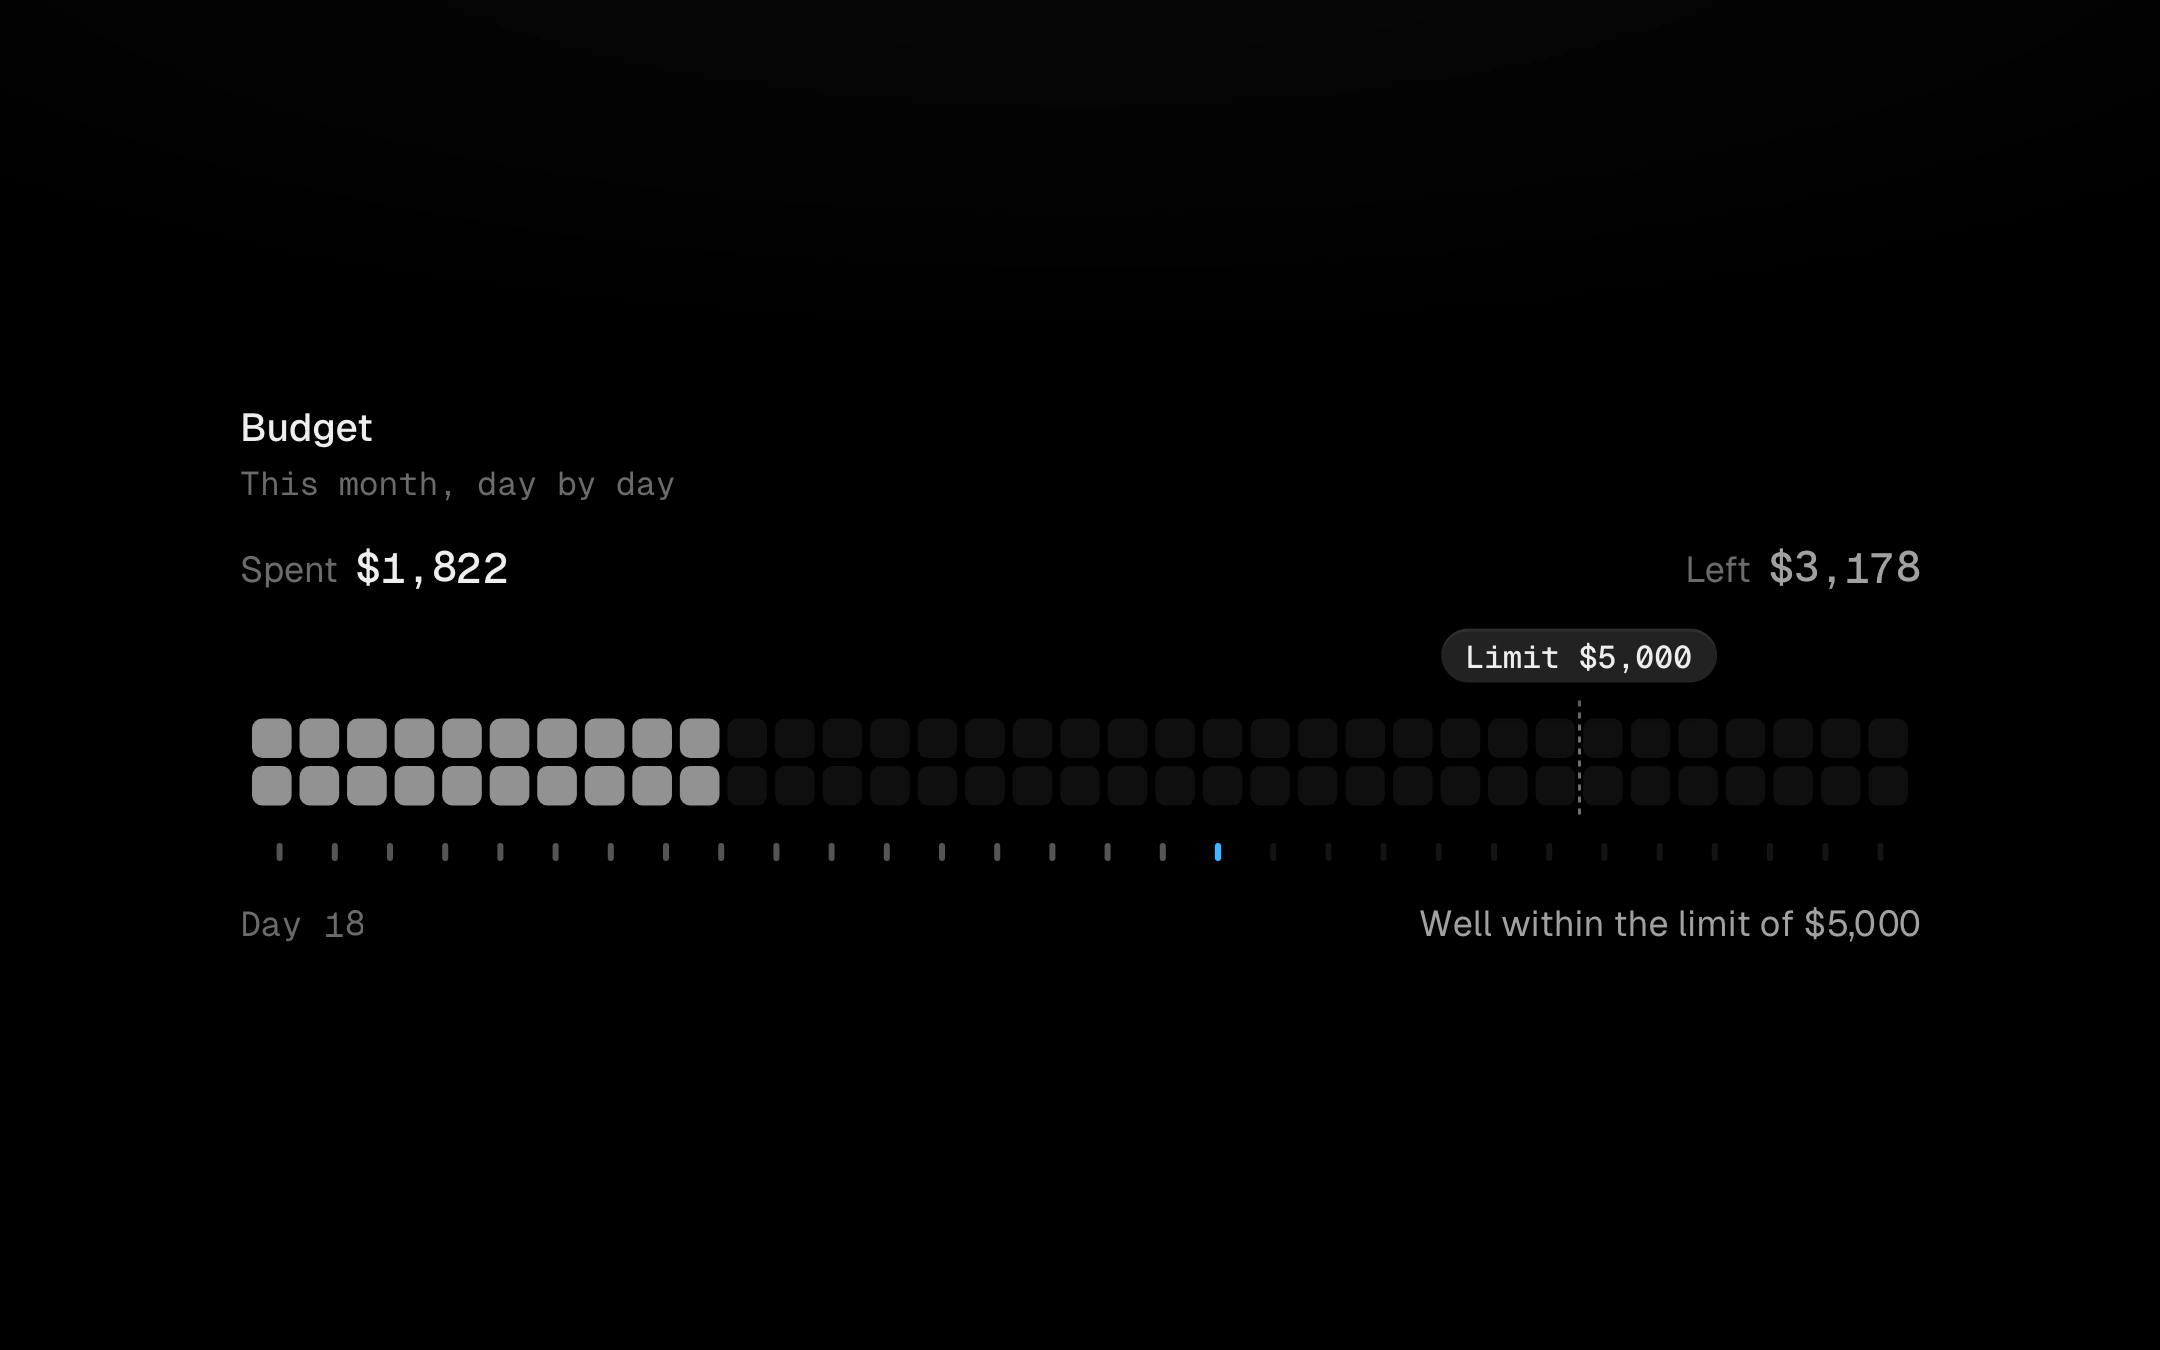
Spending against a limit, counted out in cells that light up as money goes out.
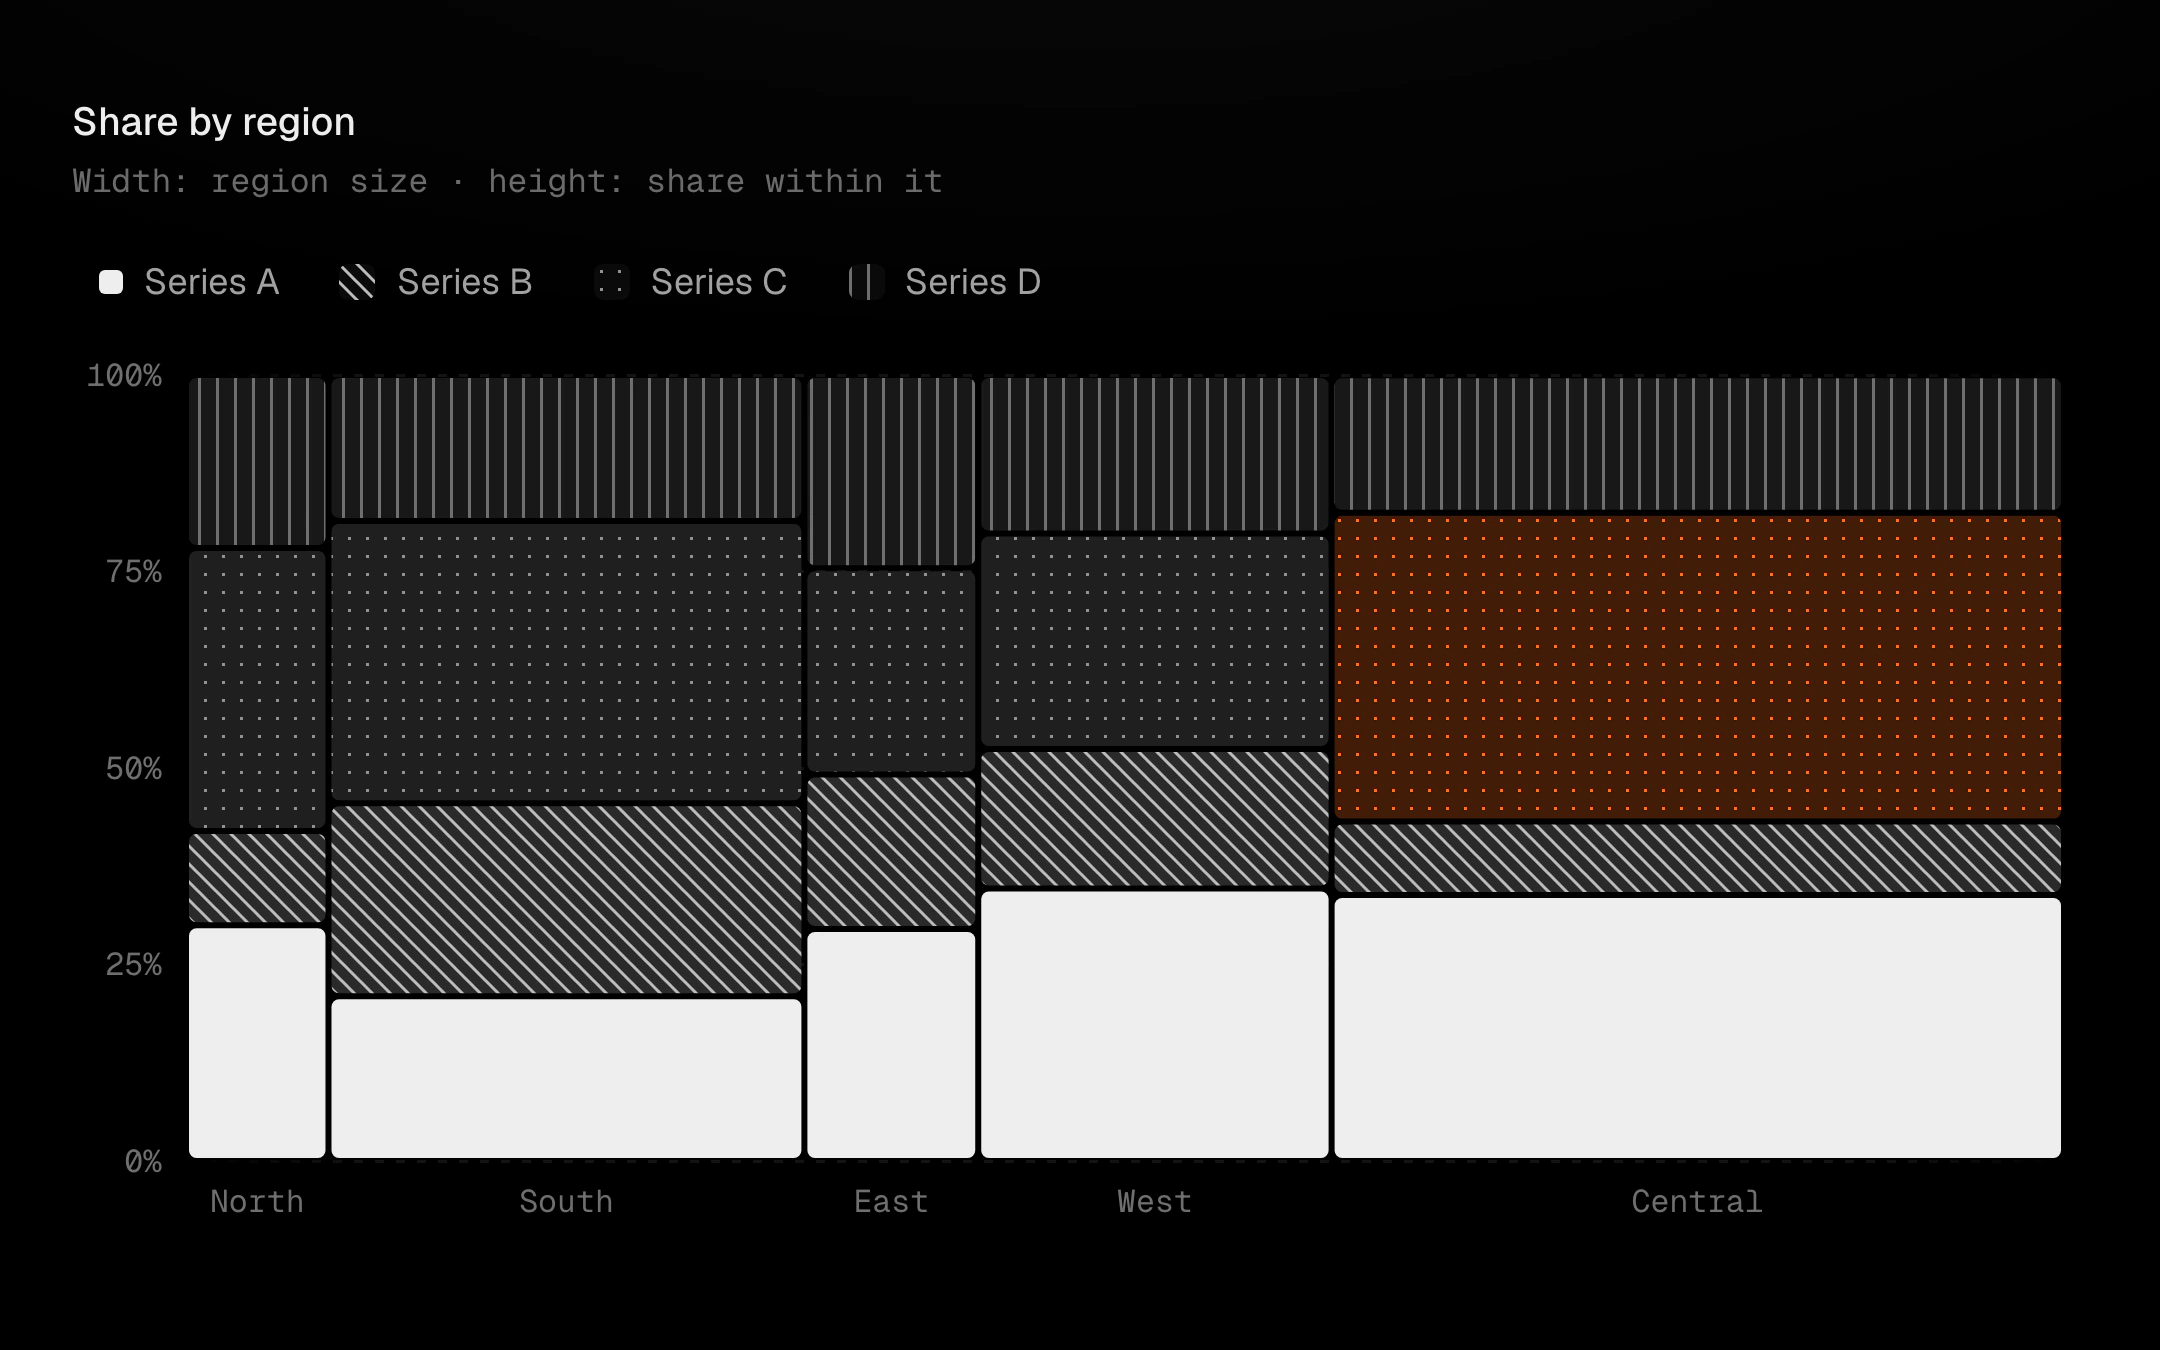
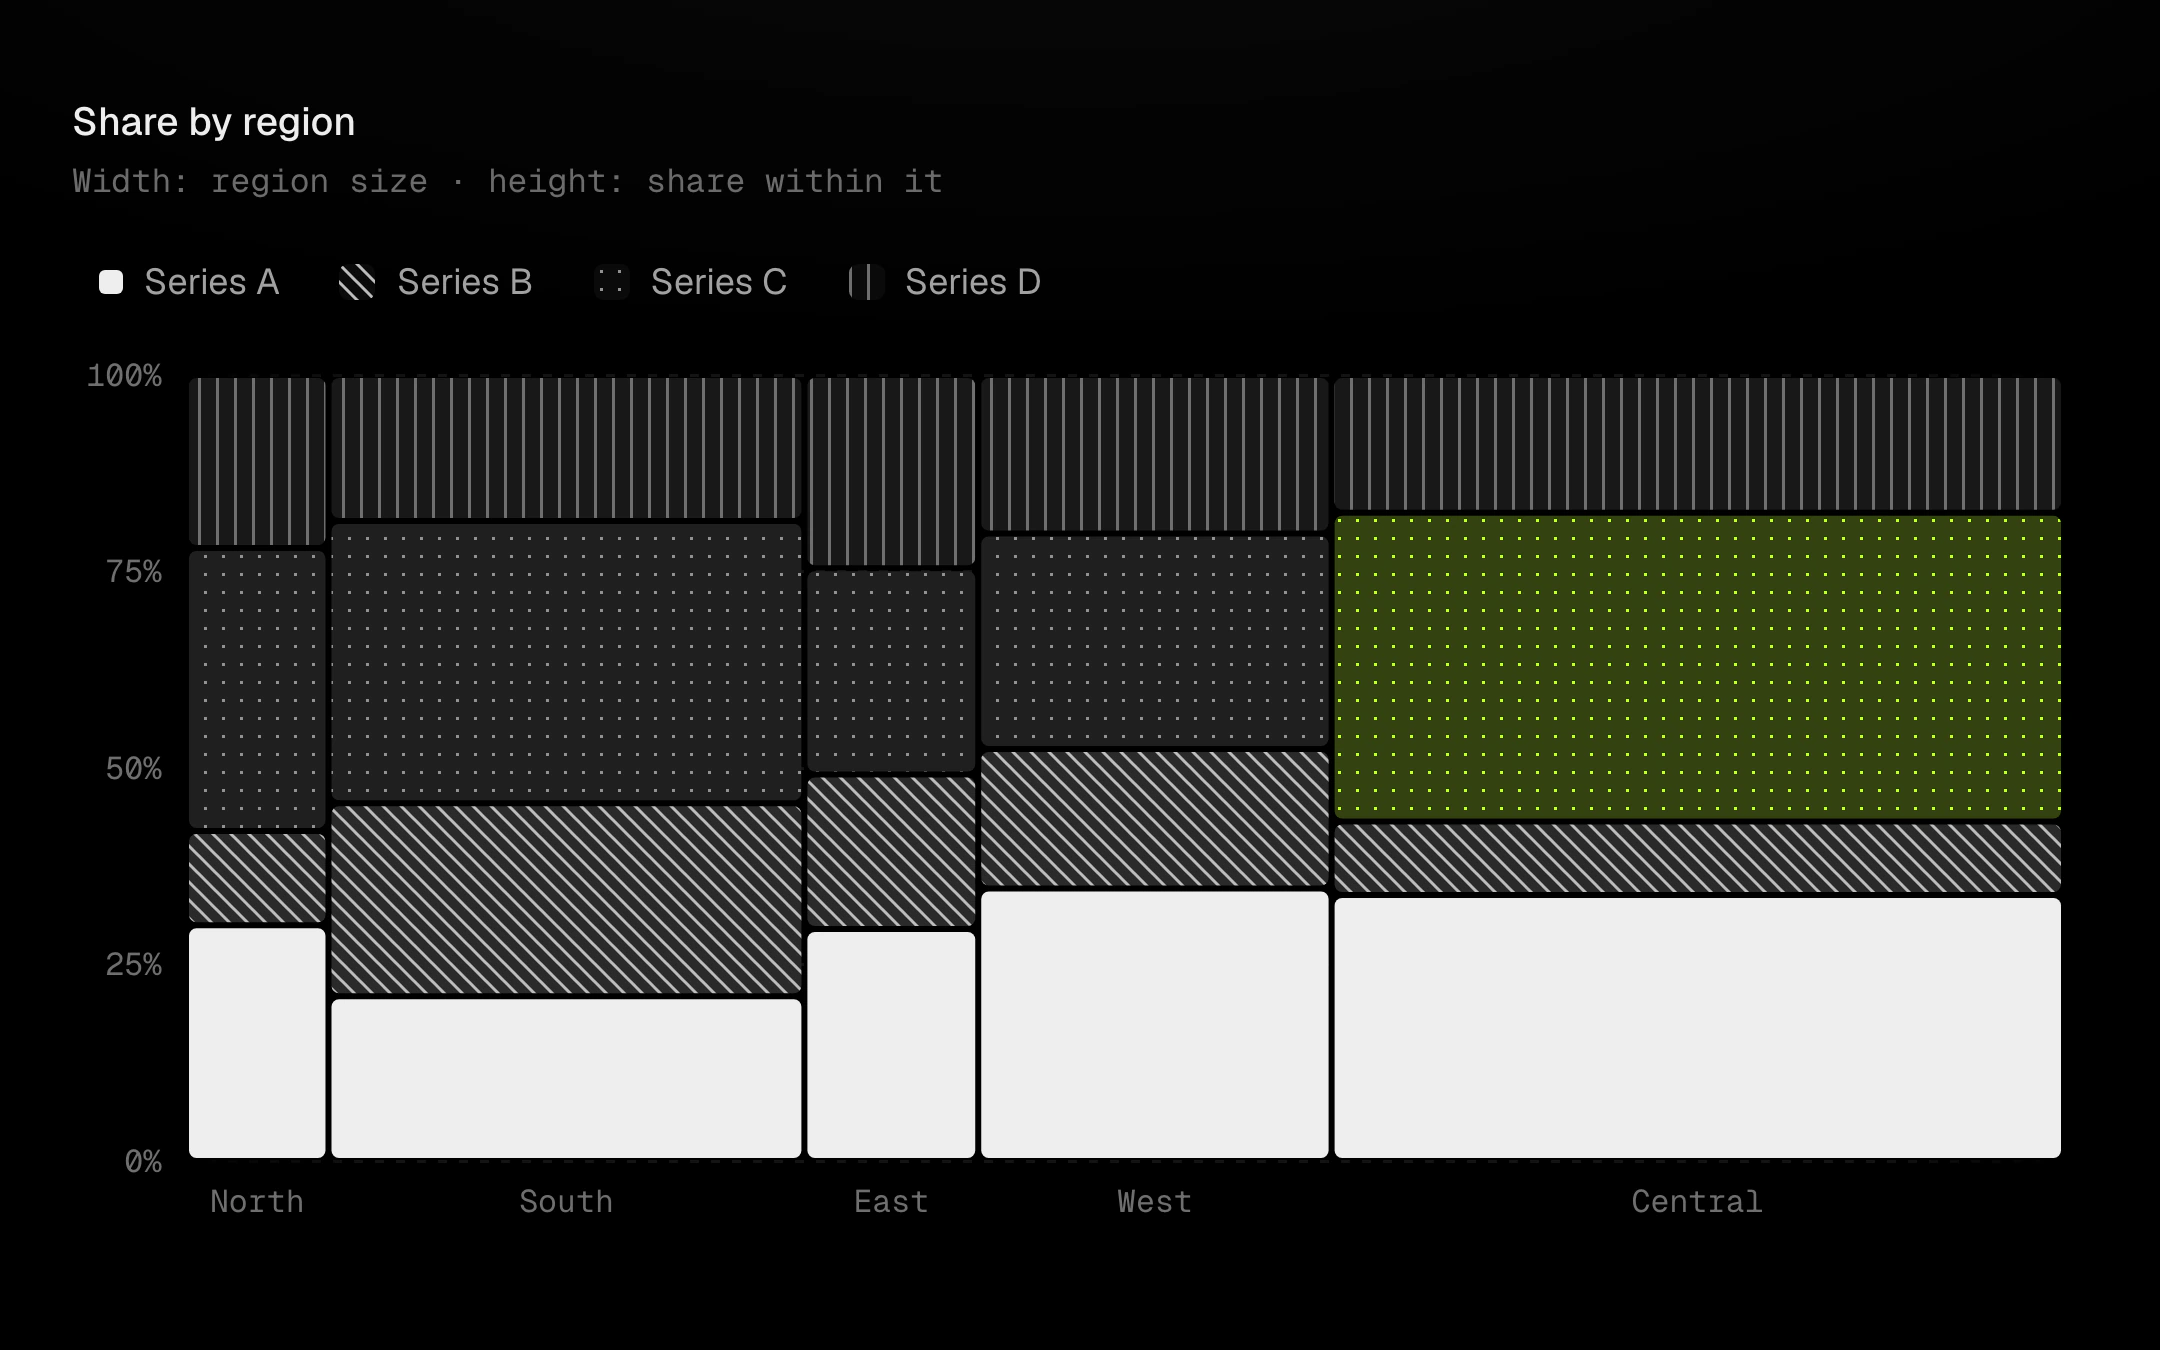
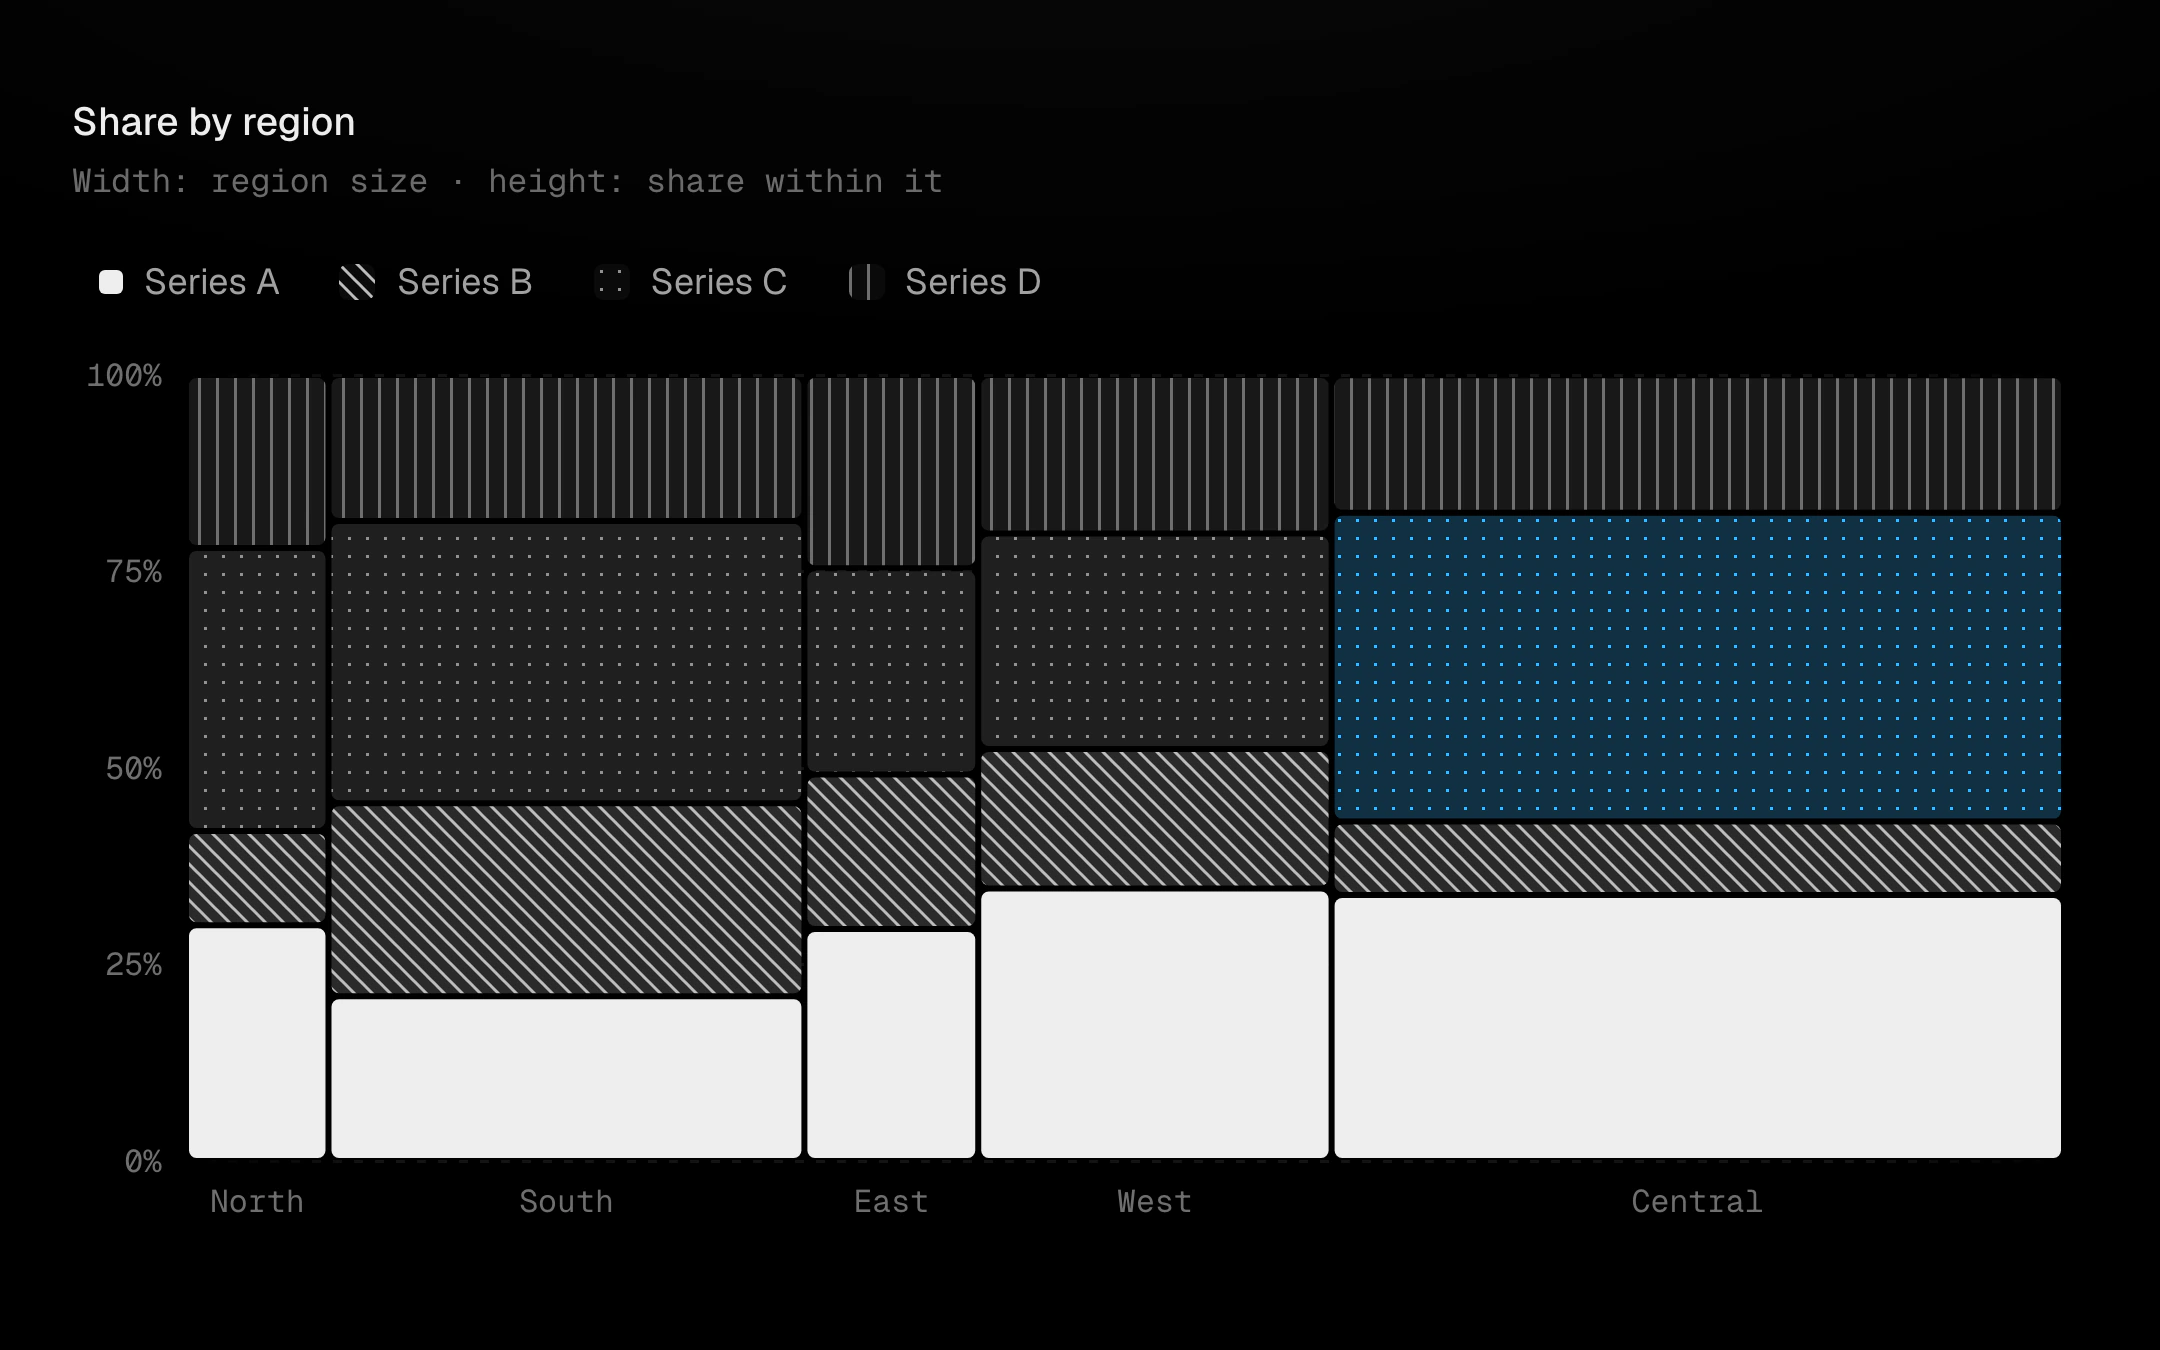
Variable-width stacked columns: each column is as wide as its total and split by share, so area is value.
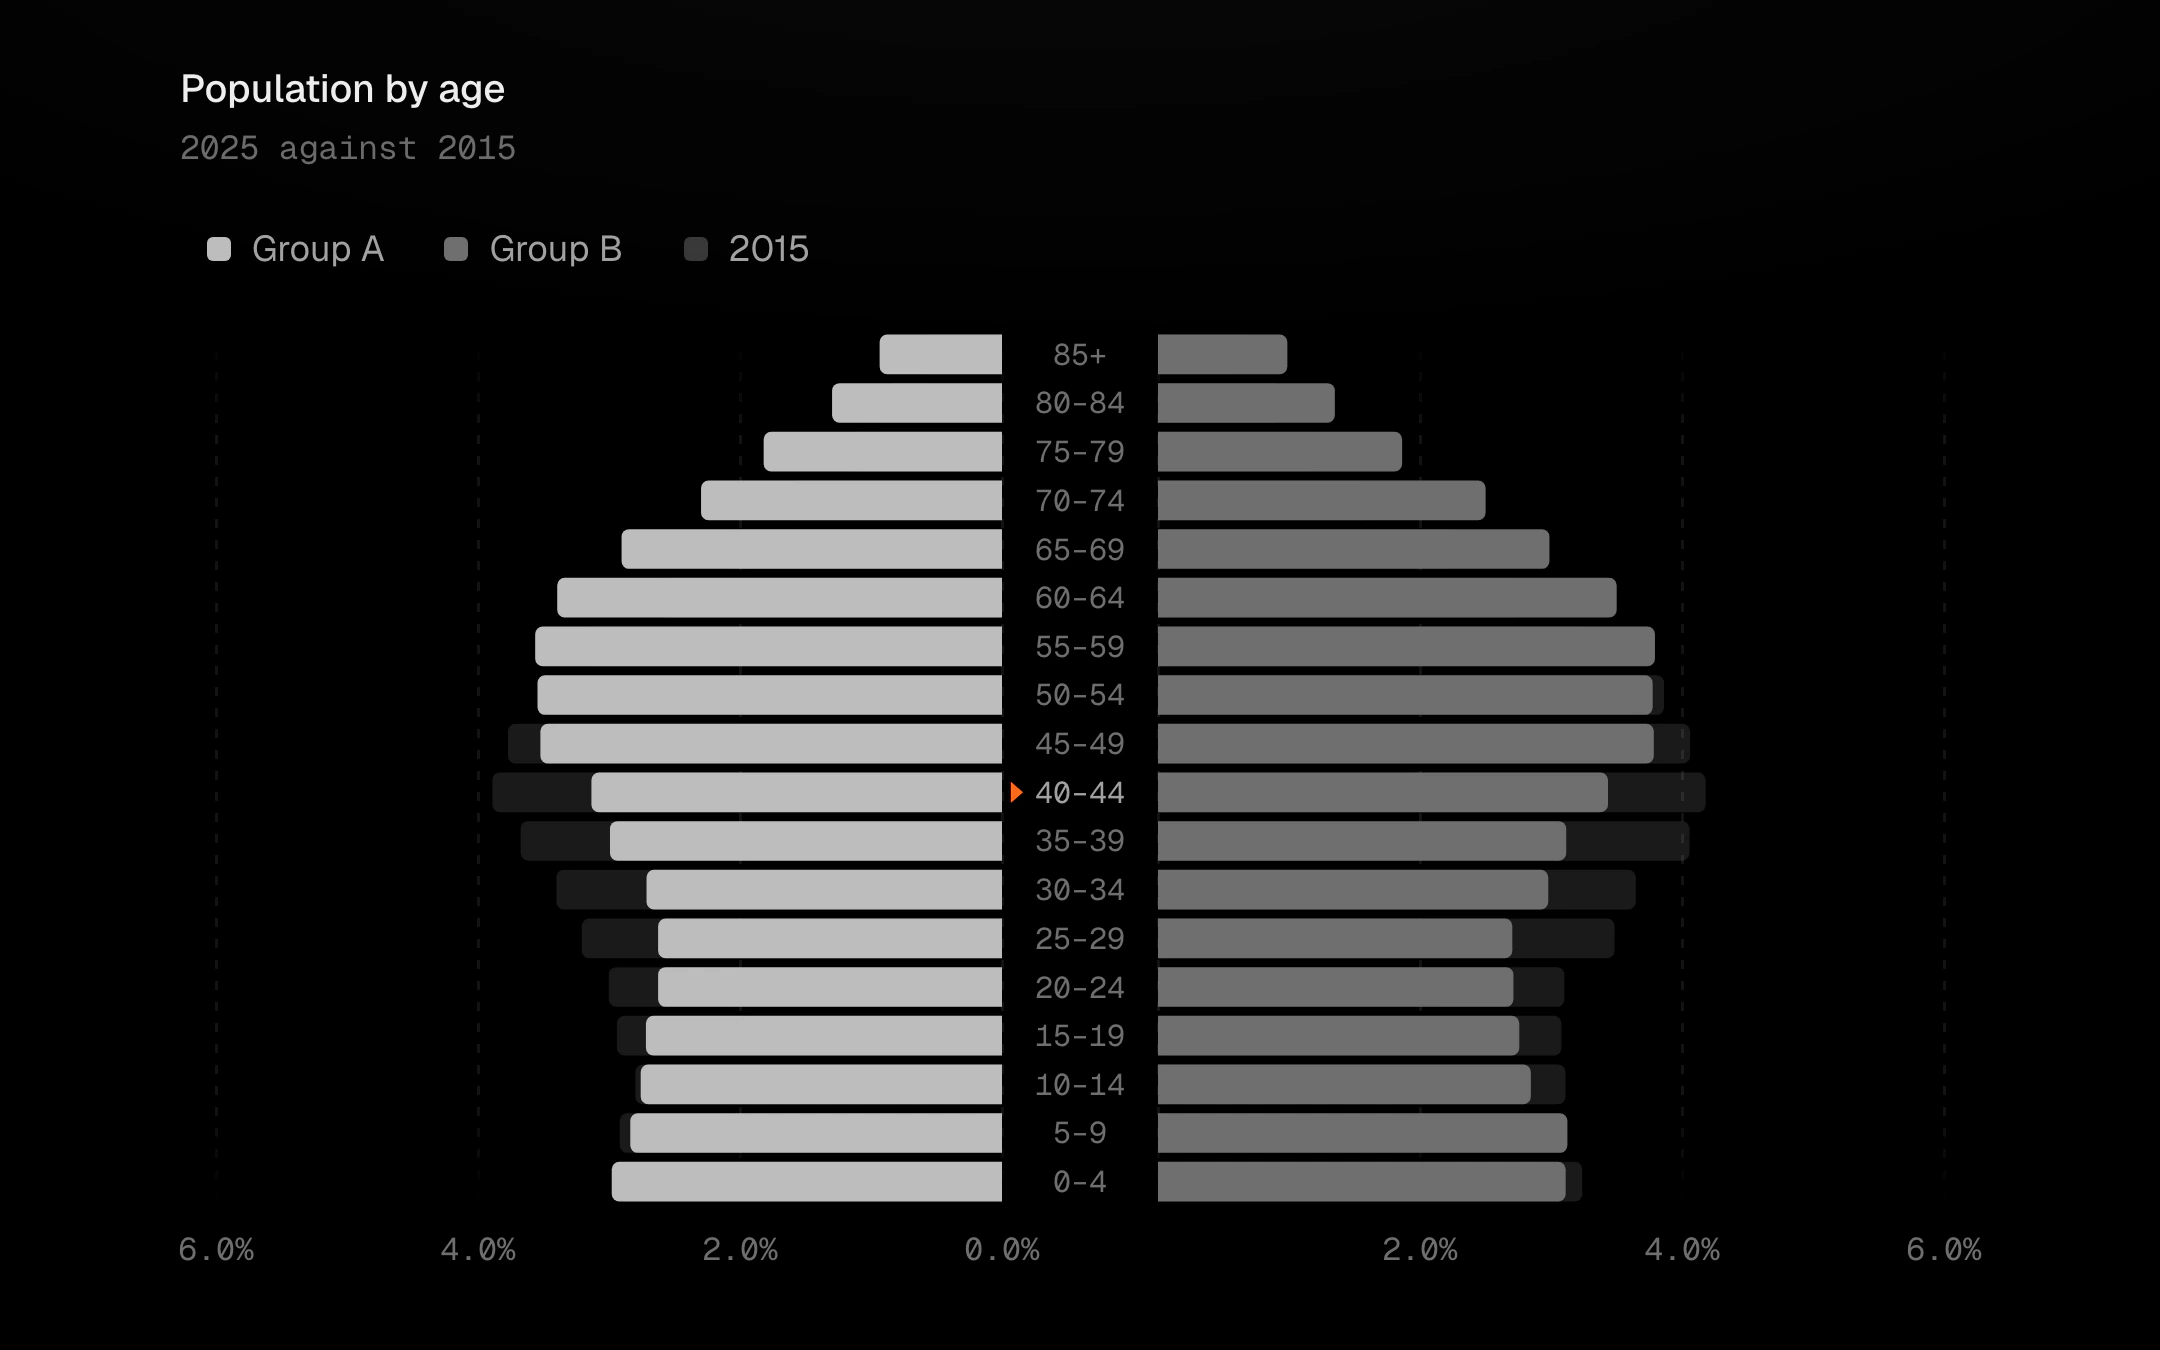
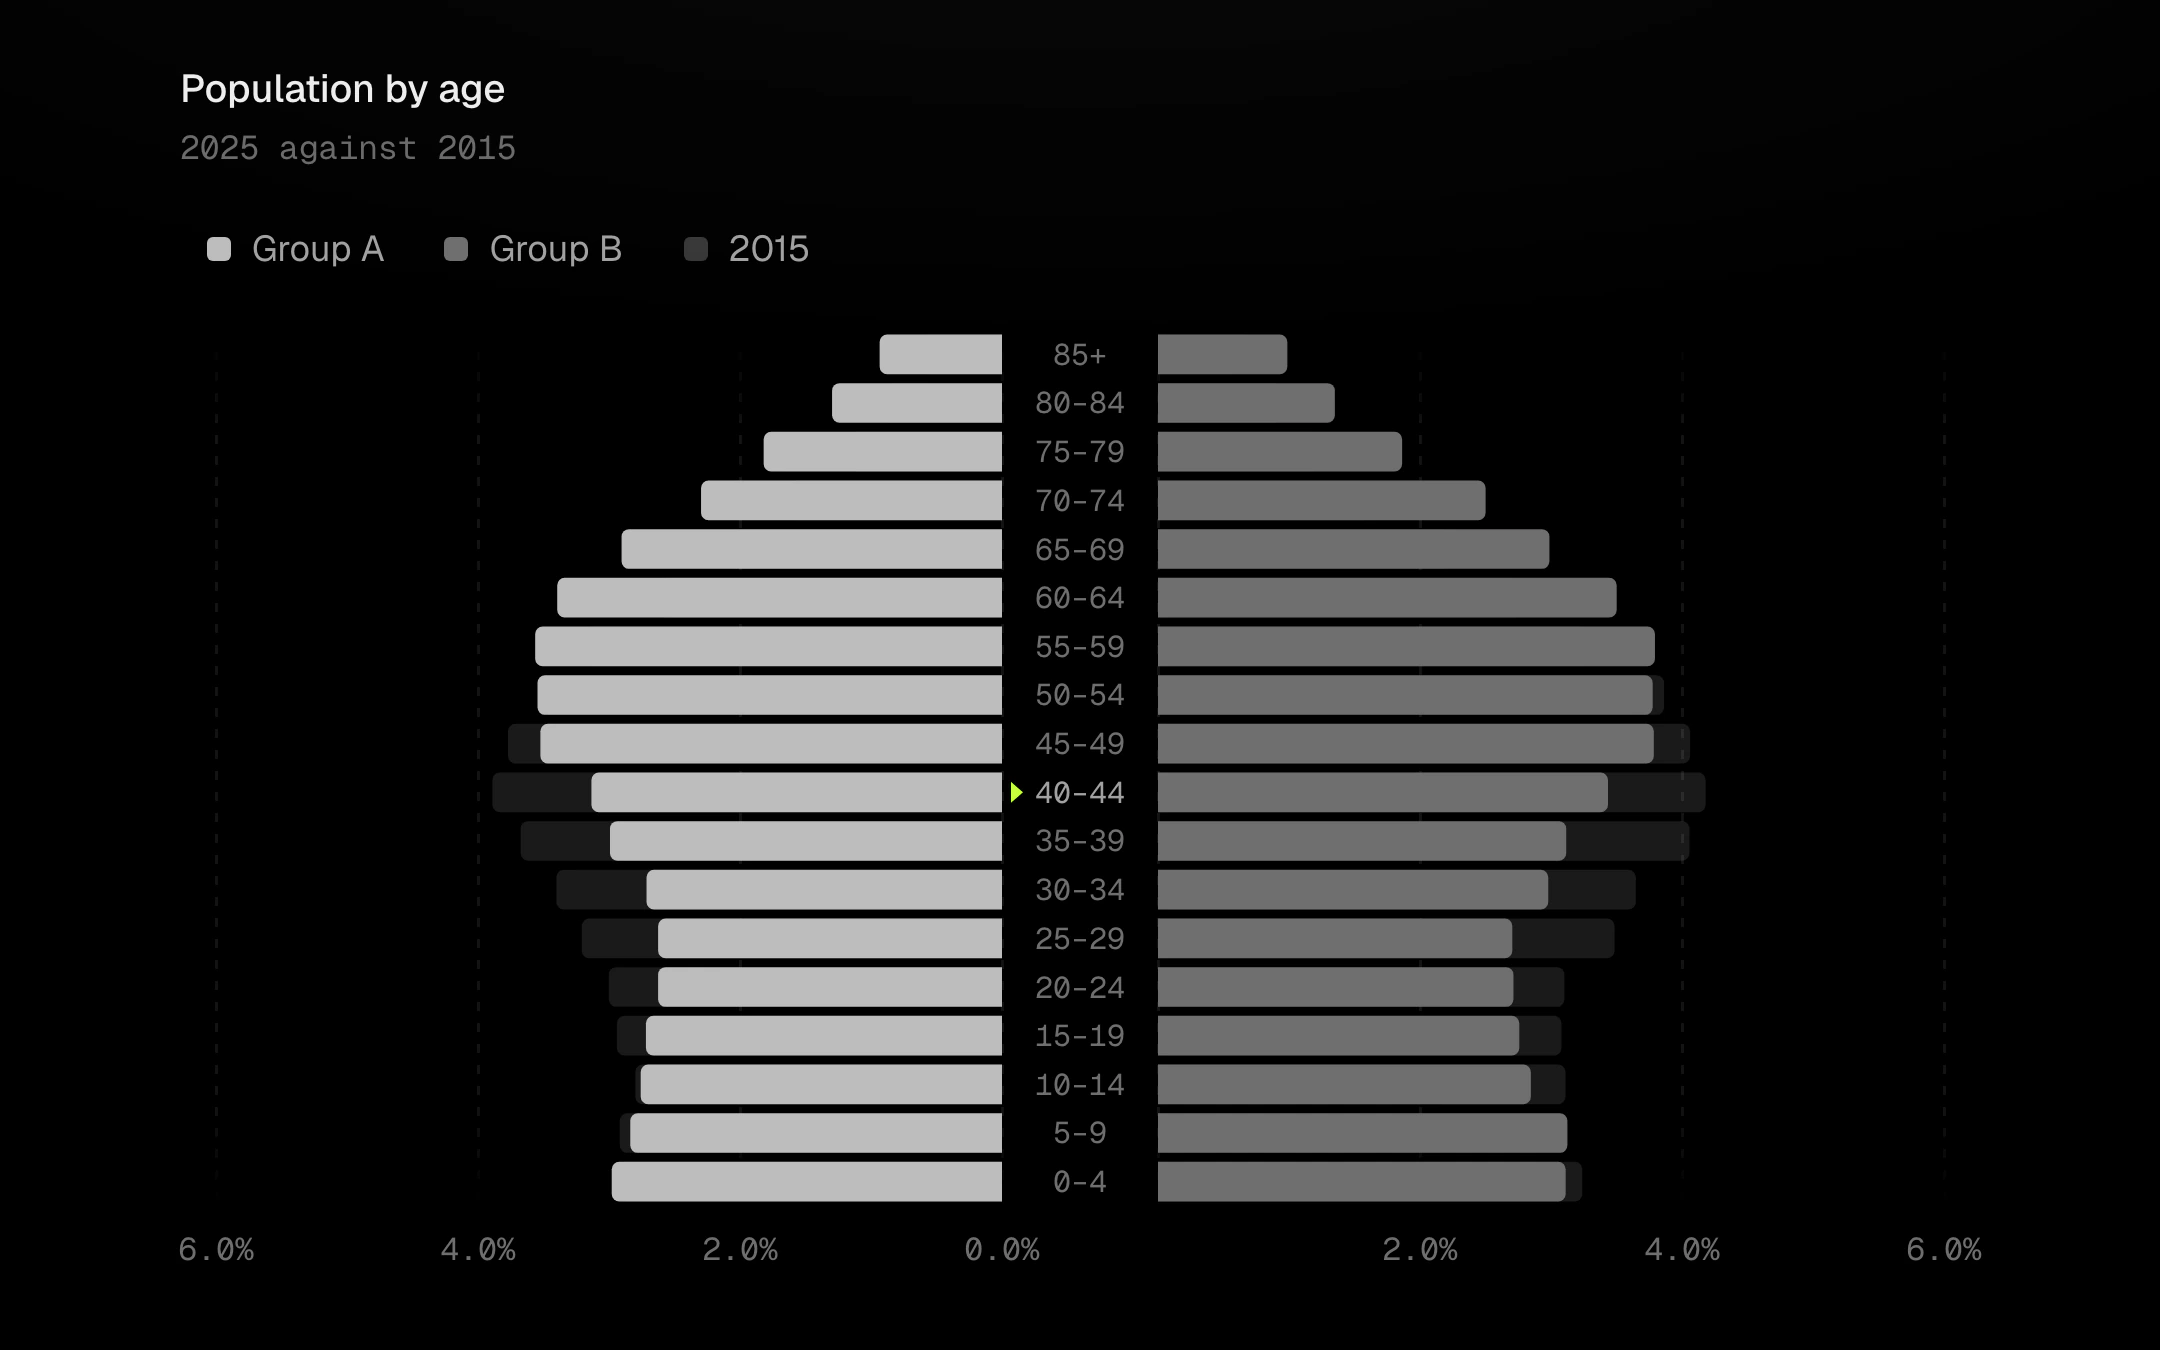
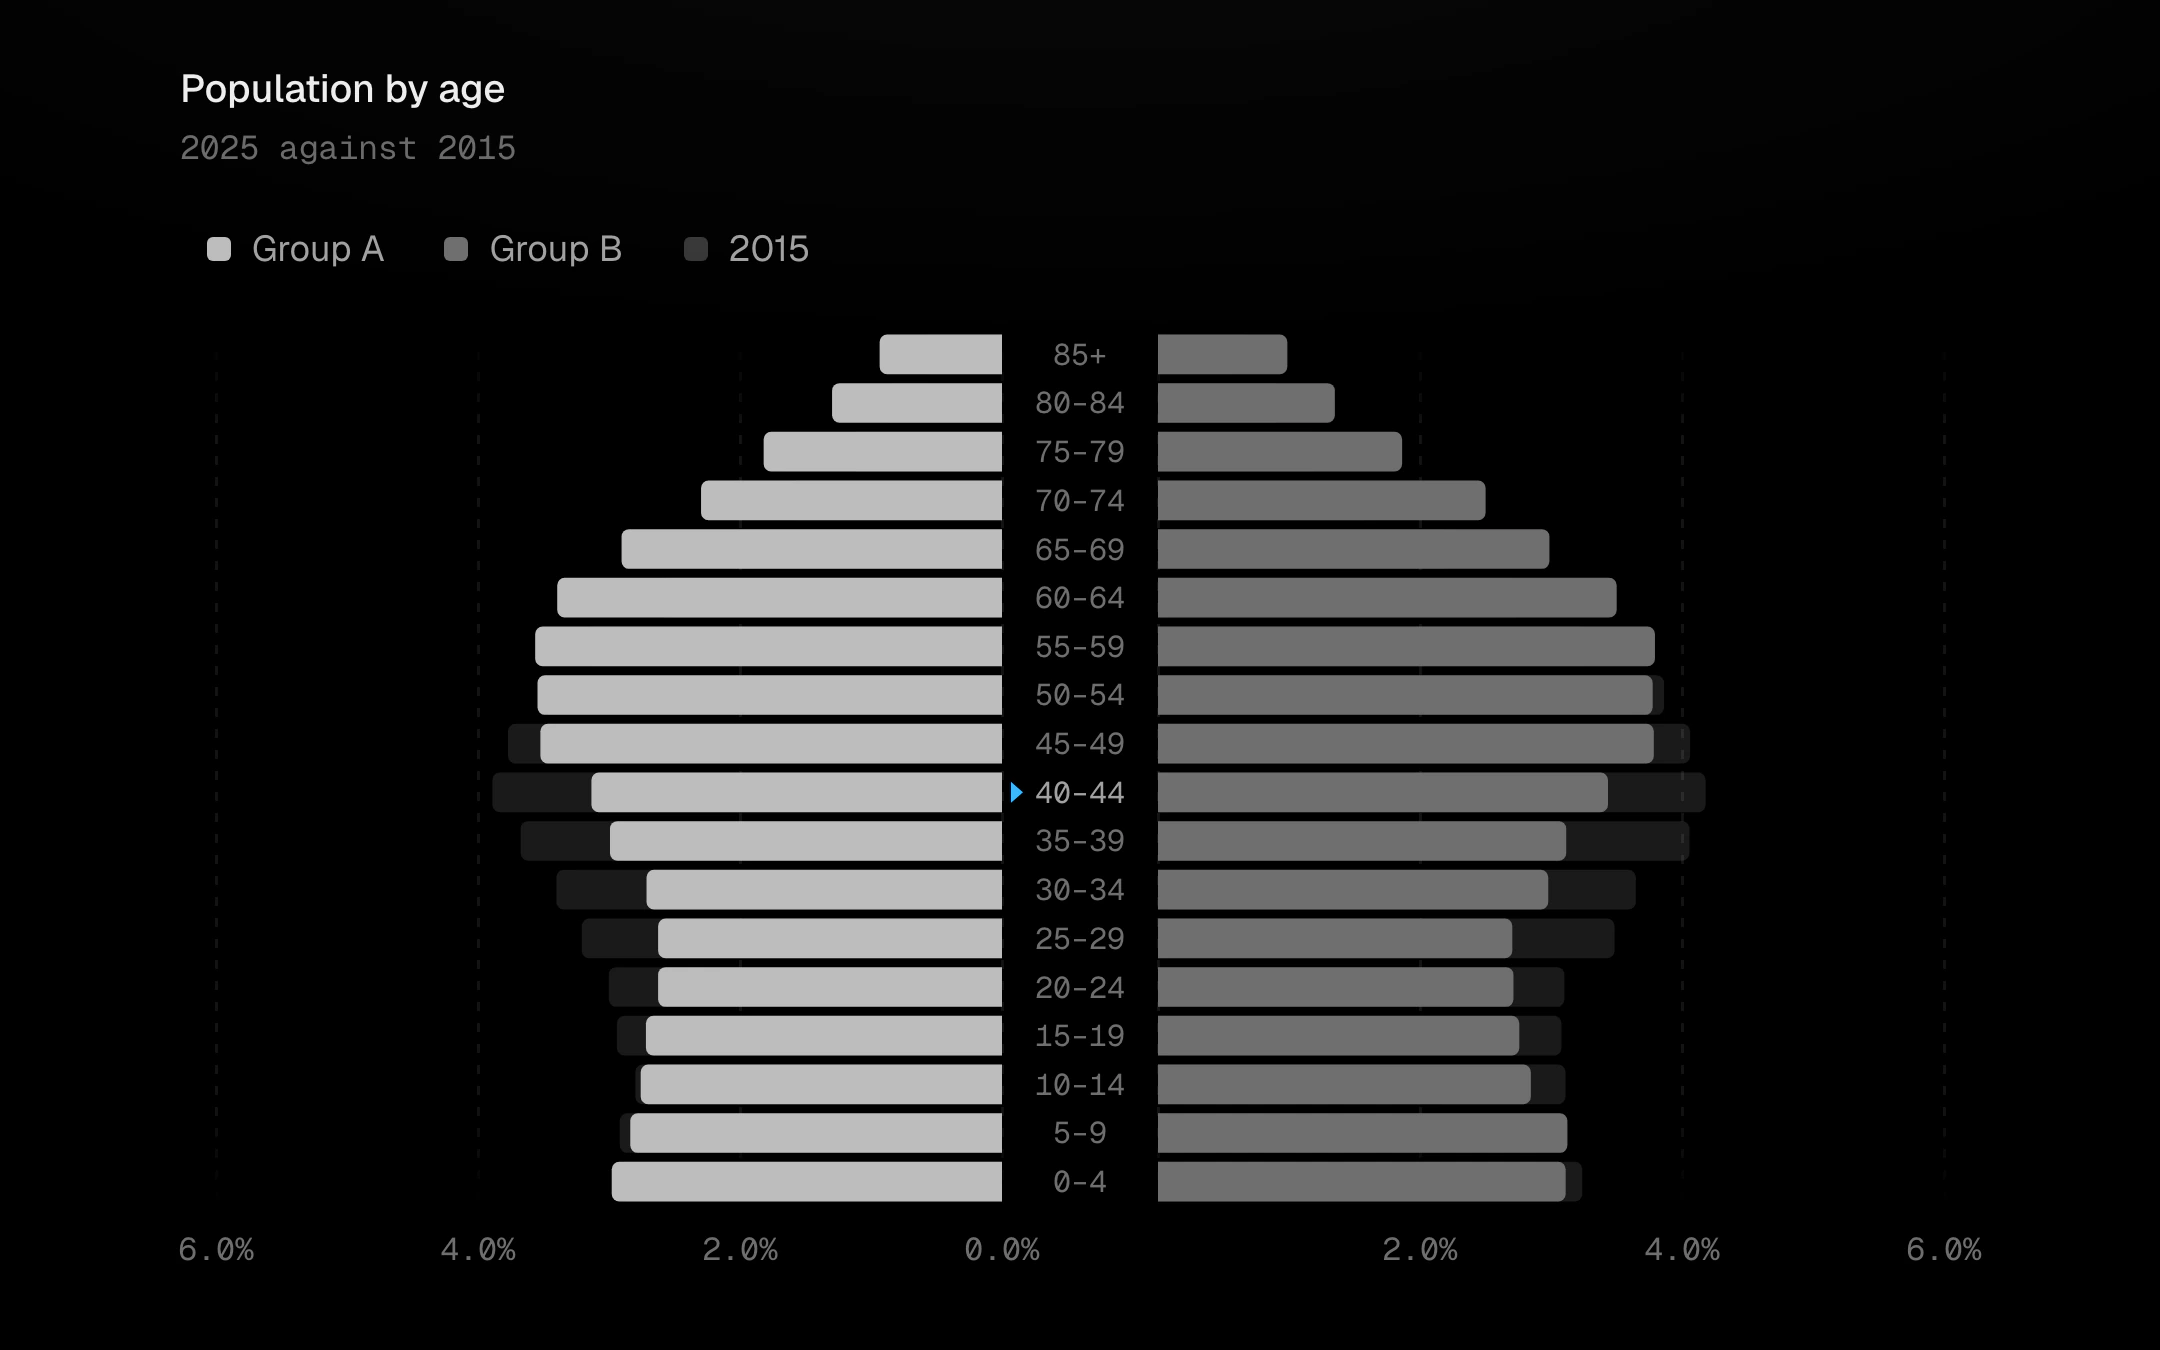
A population (butterfly) chart: two sides grow outward from a centre spine that carries the age bands, oldest on top.
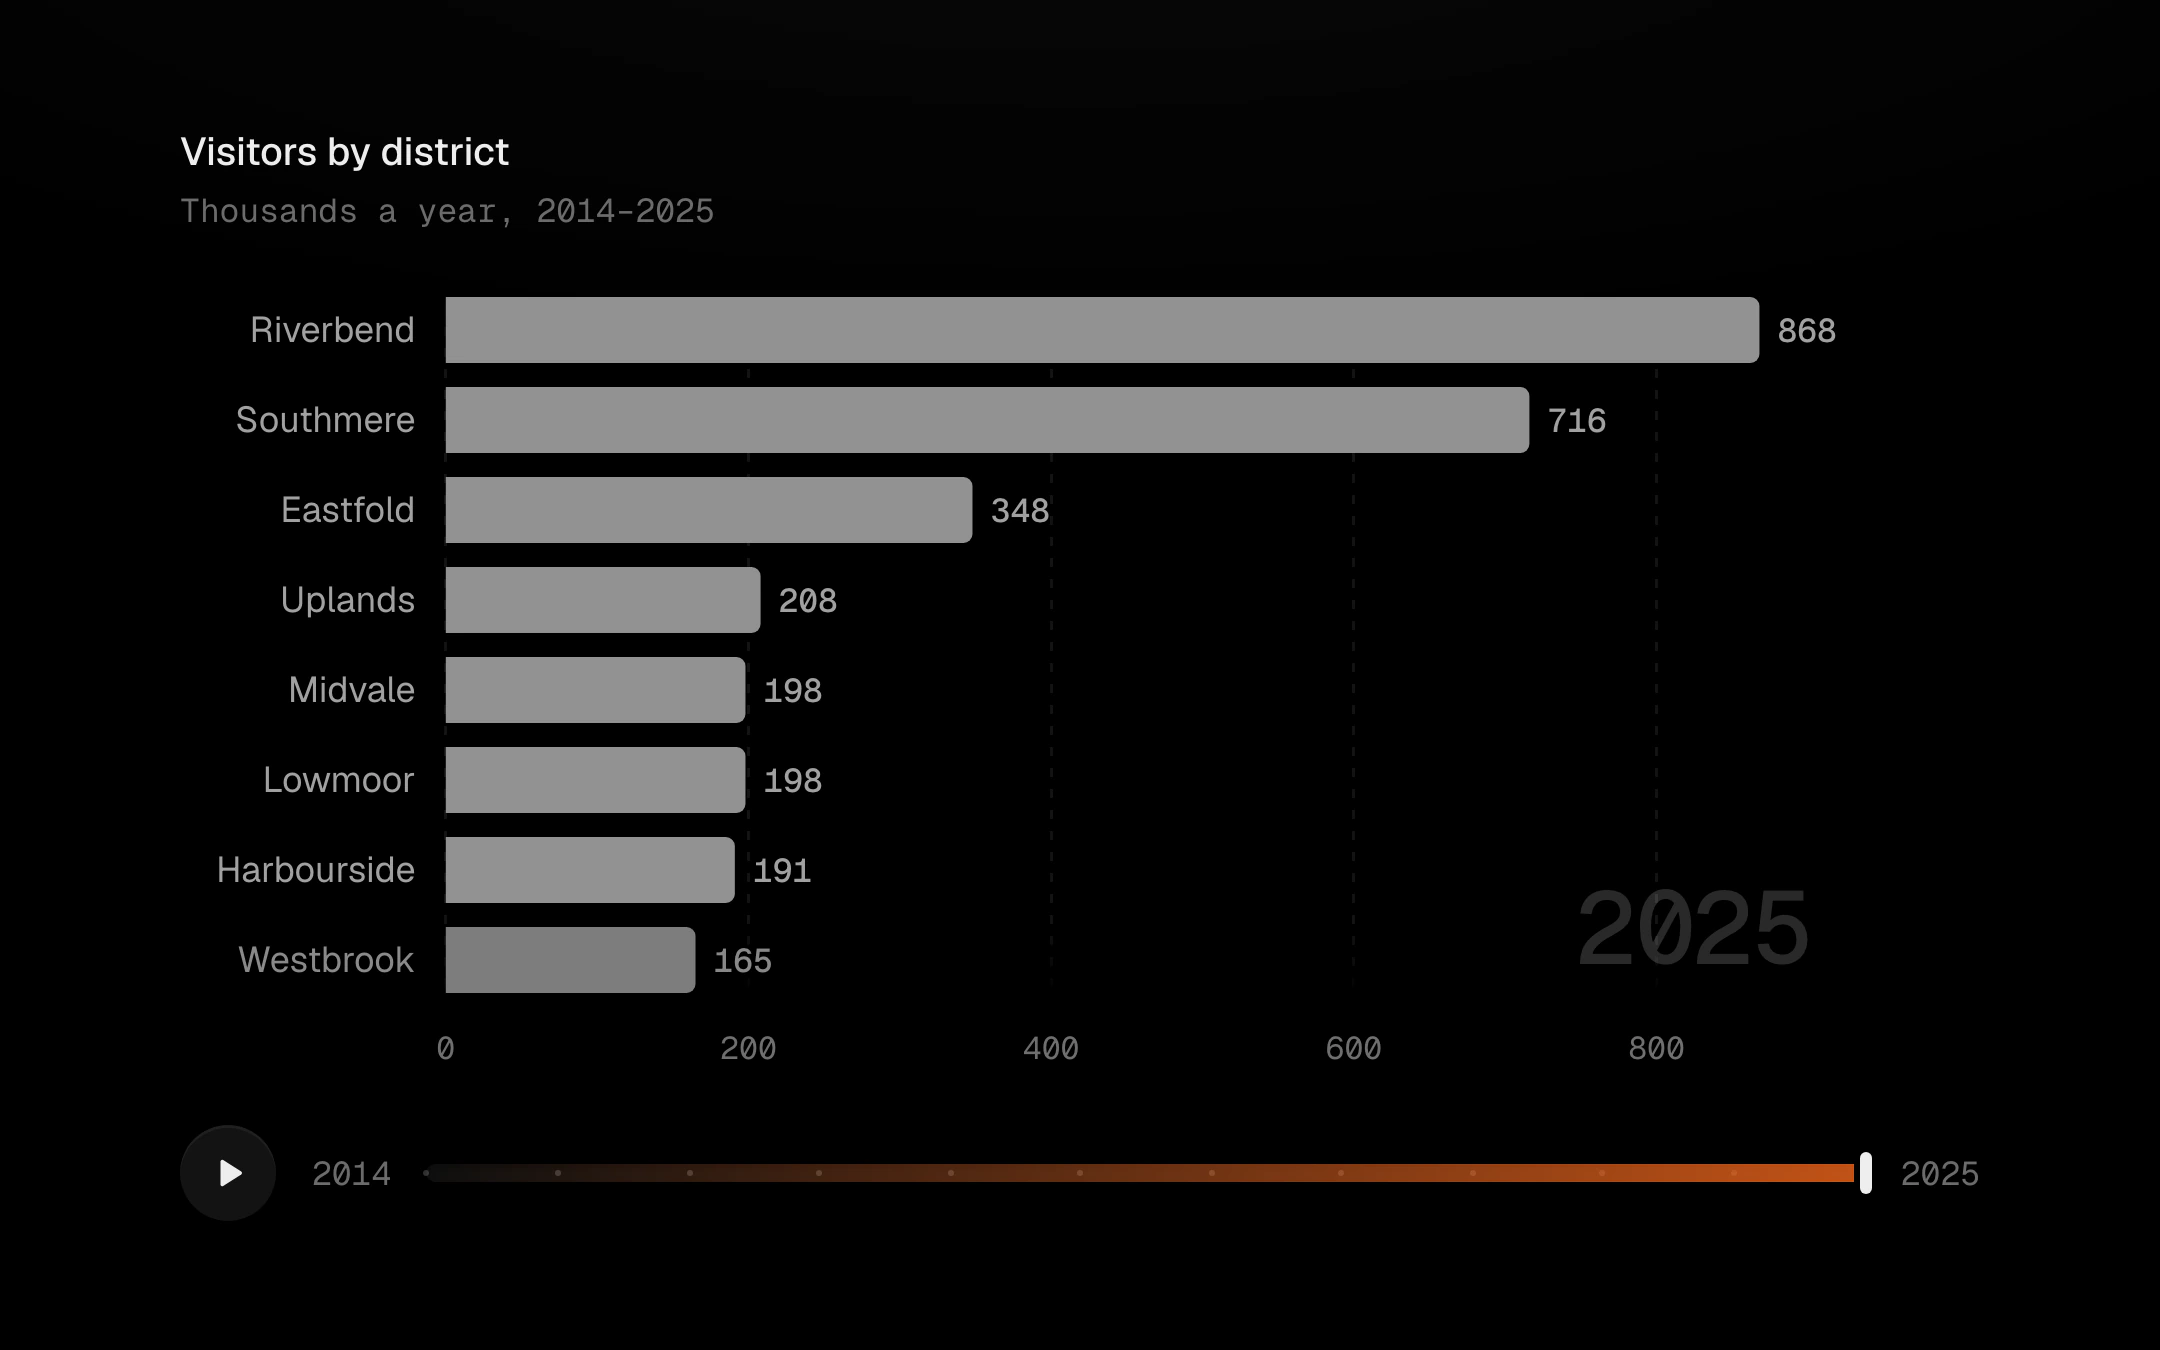
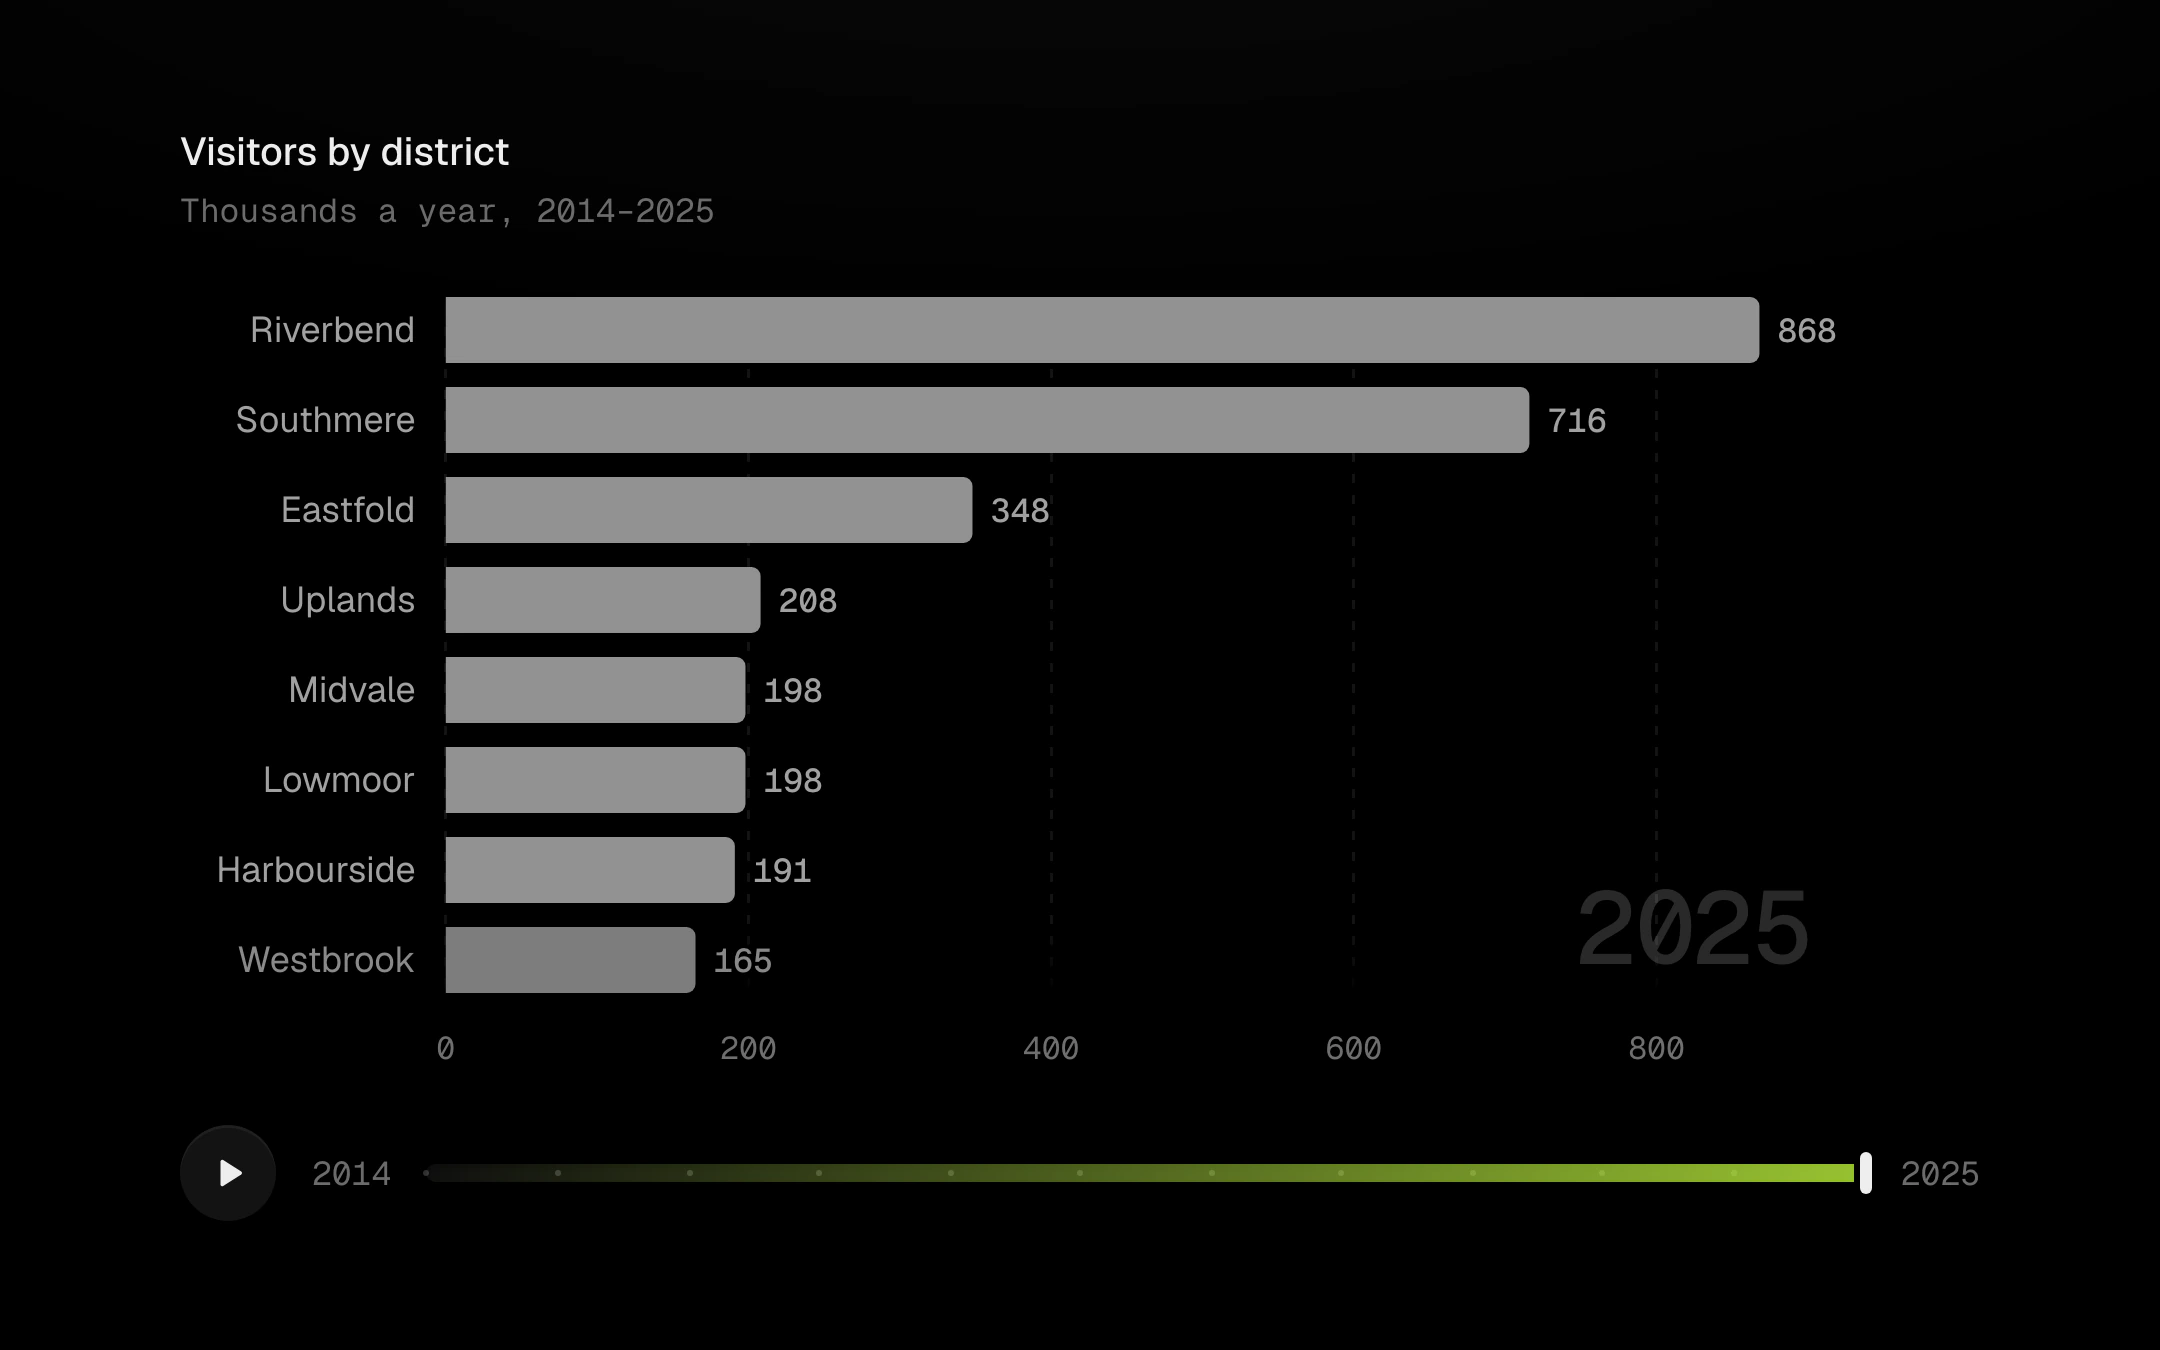
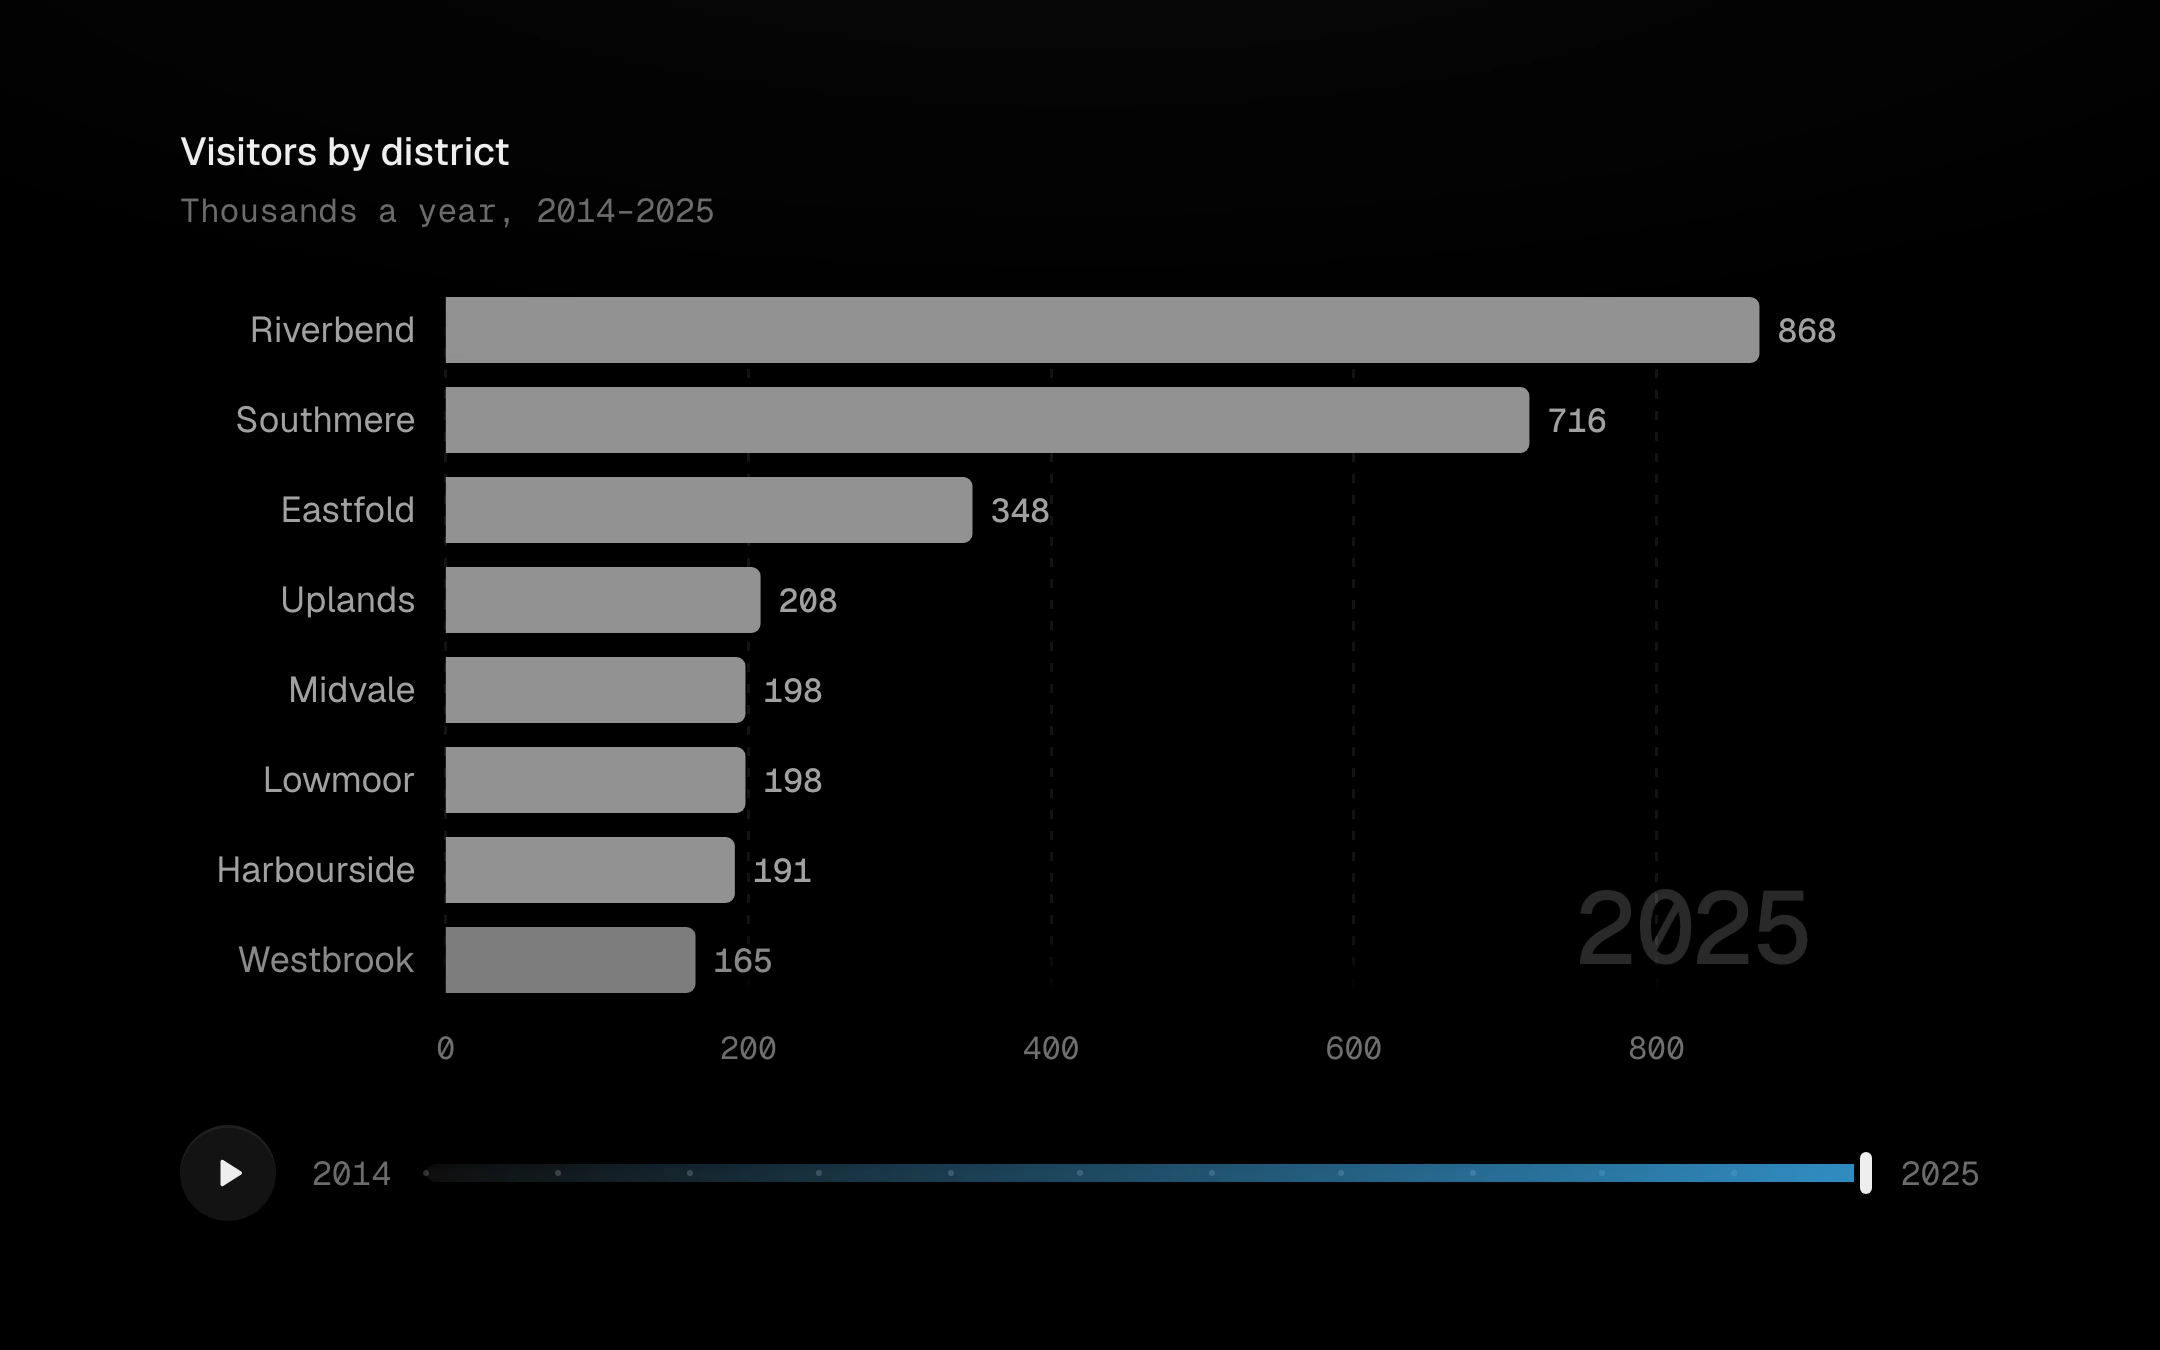
A ranking that moves through time.
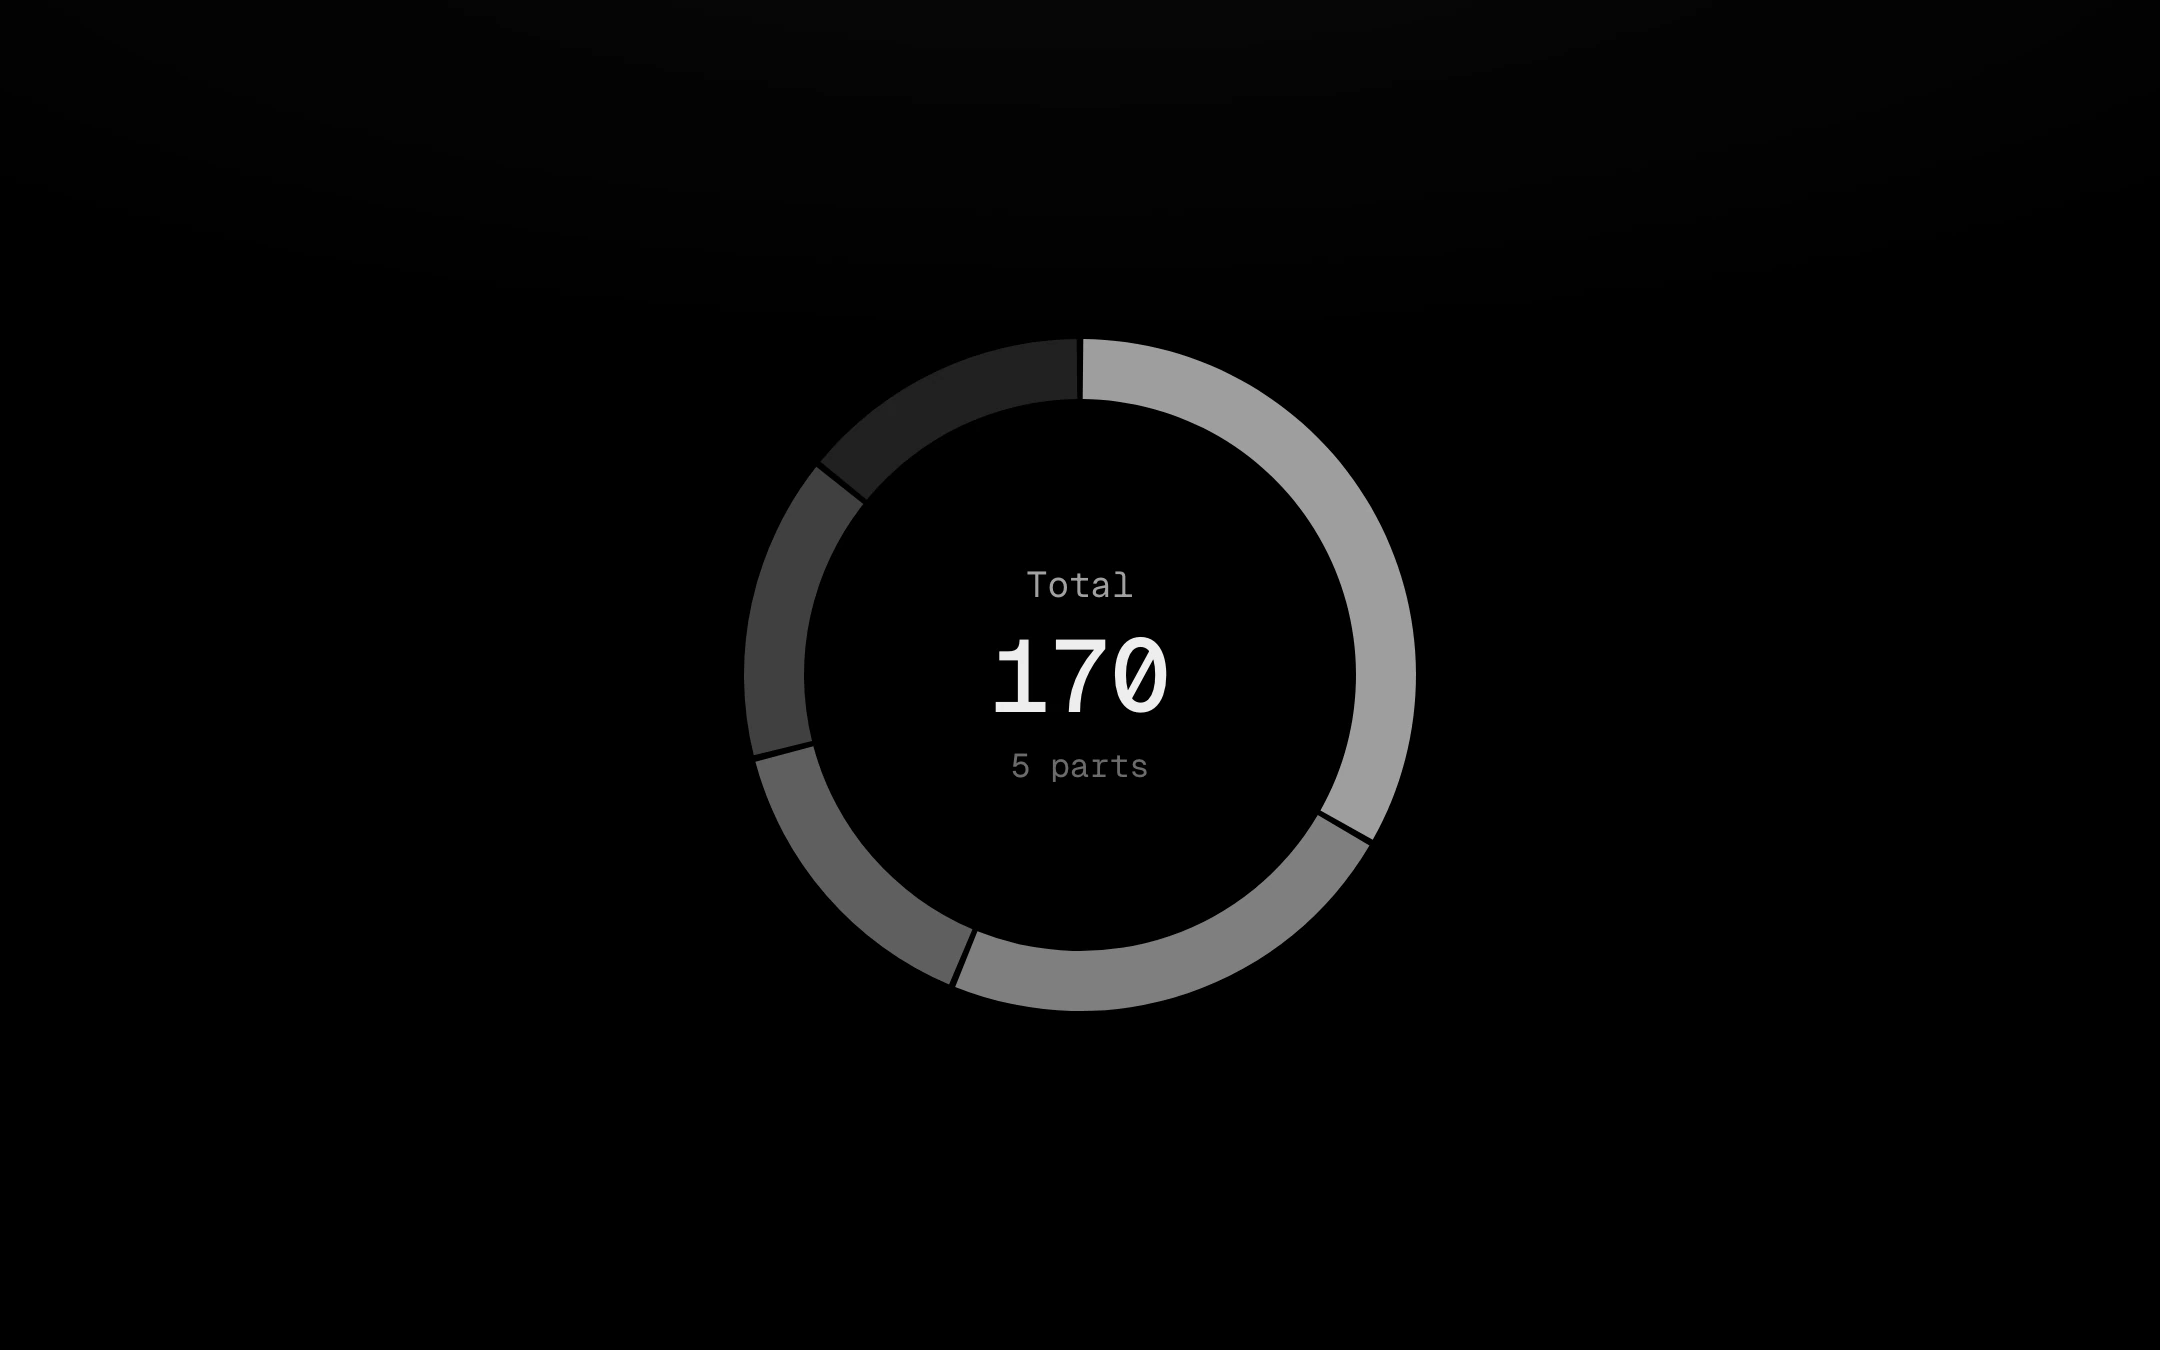
Ring segments in grey steps, cut apart by 2px gaps, that sweep on clockwise on the shared reveal curve.
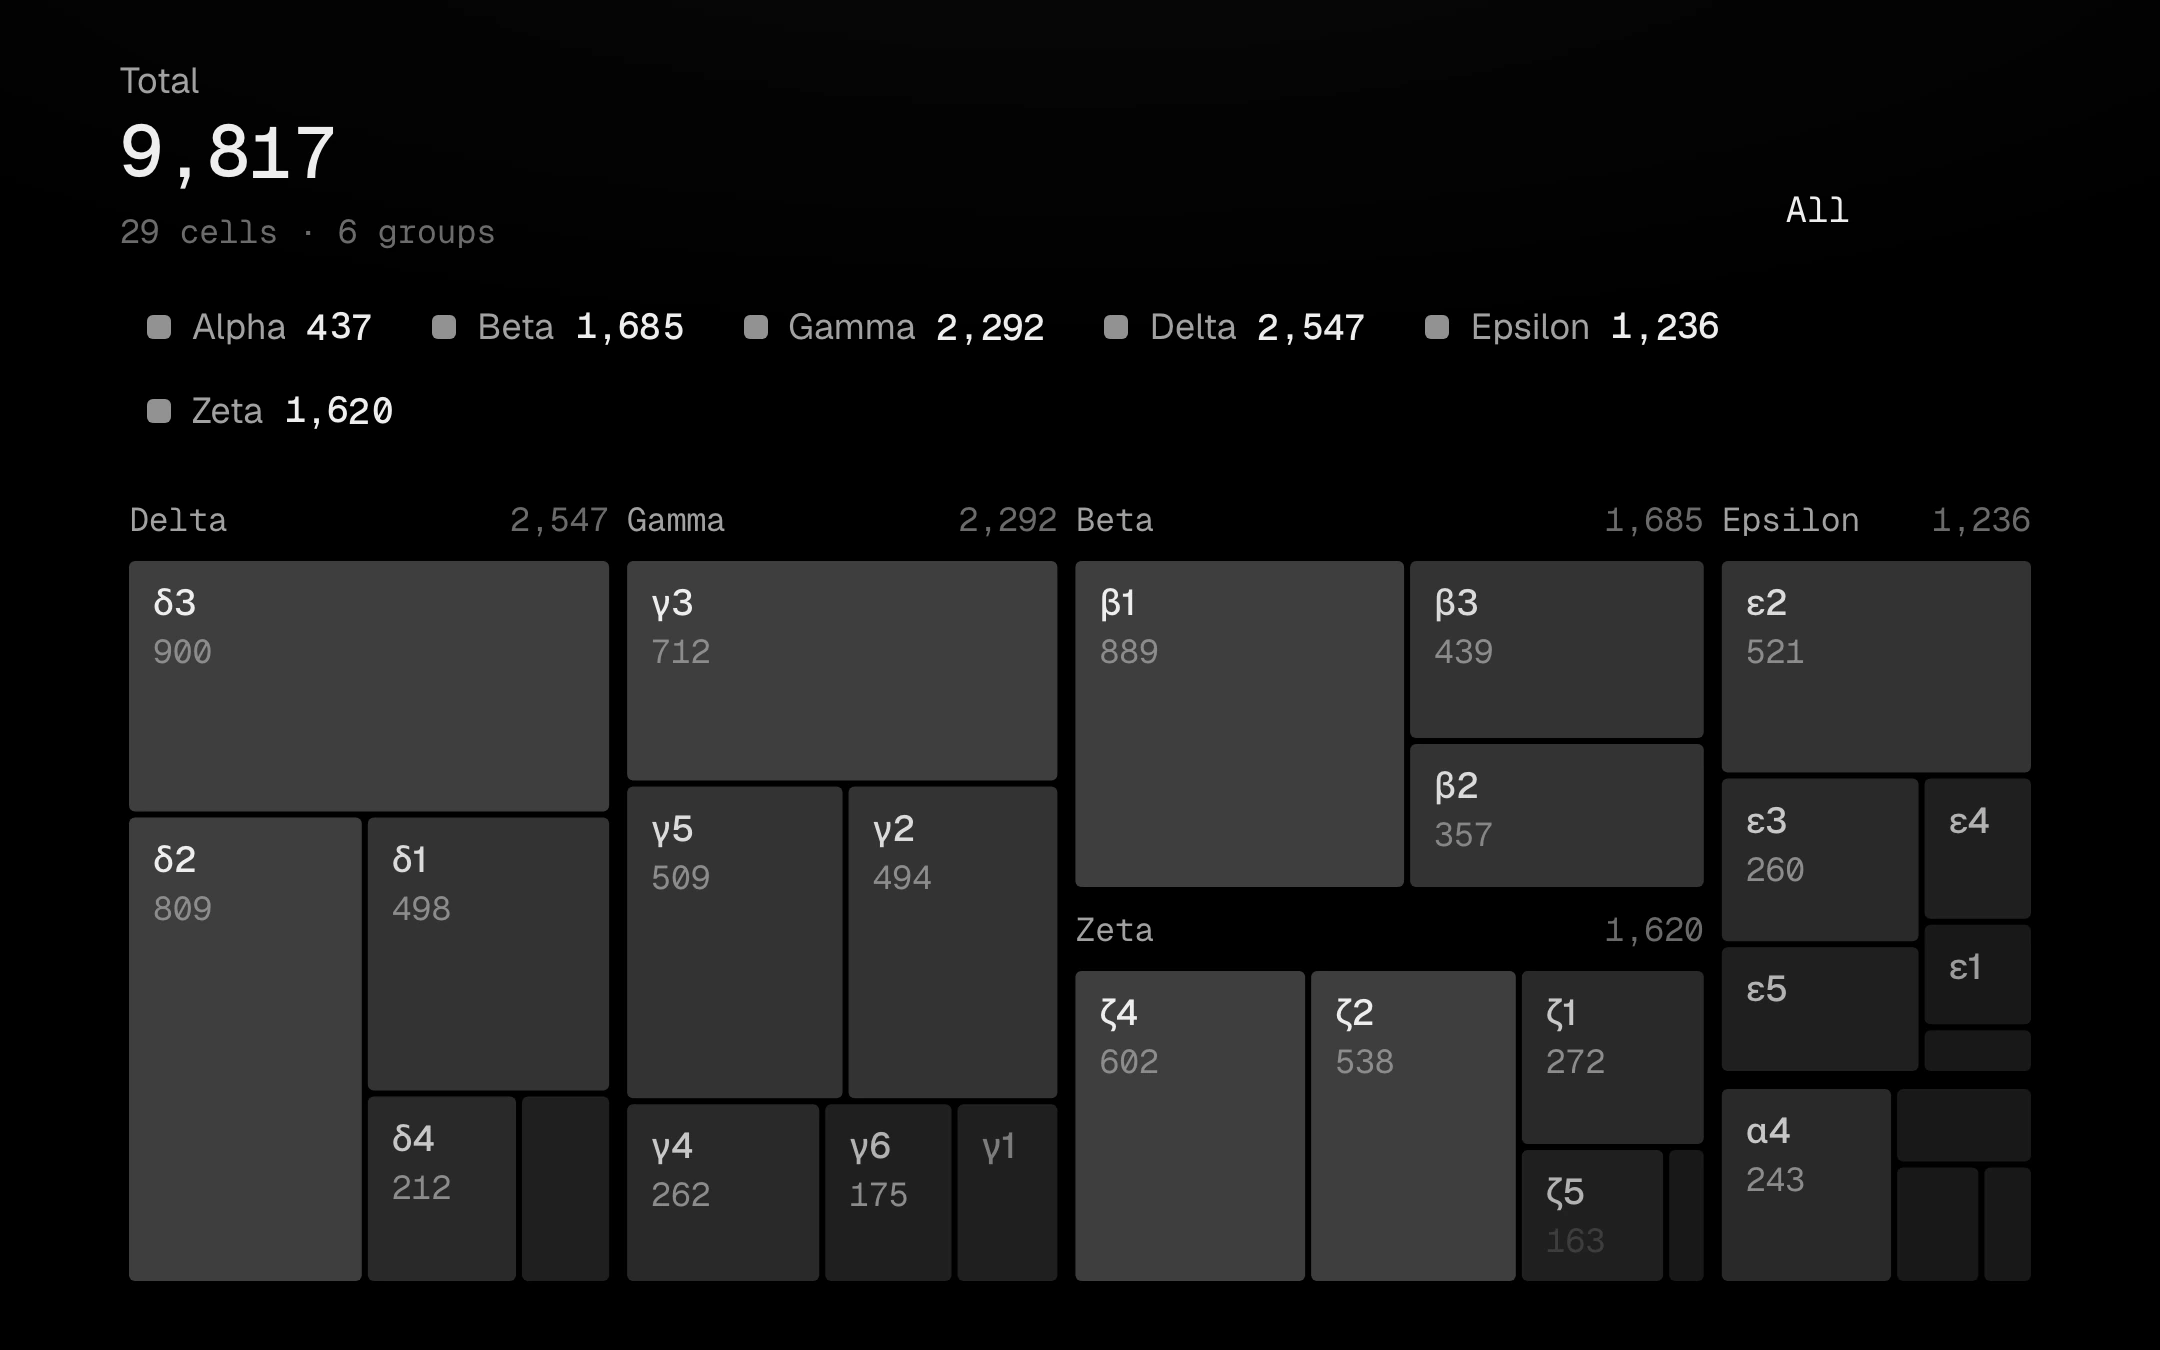
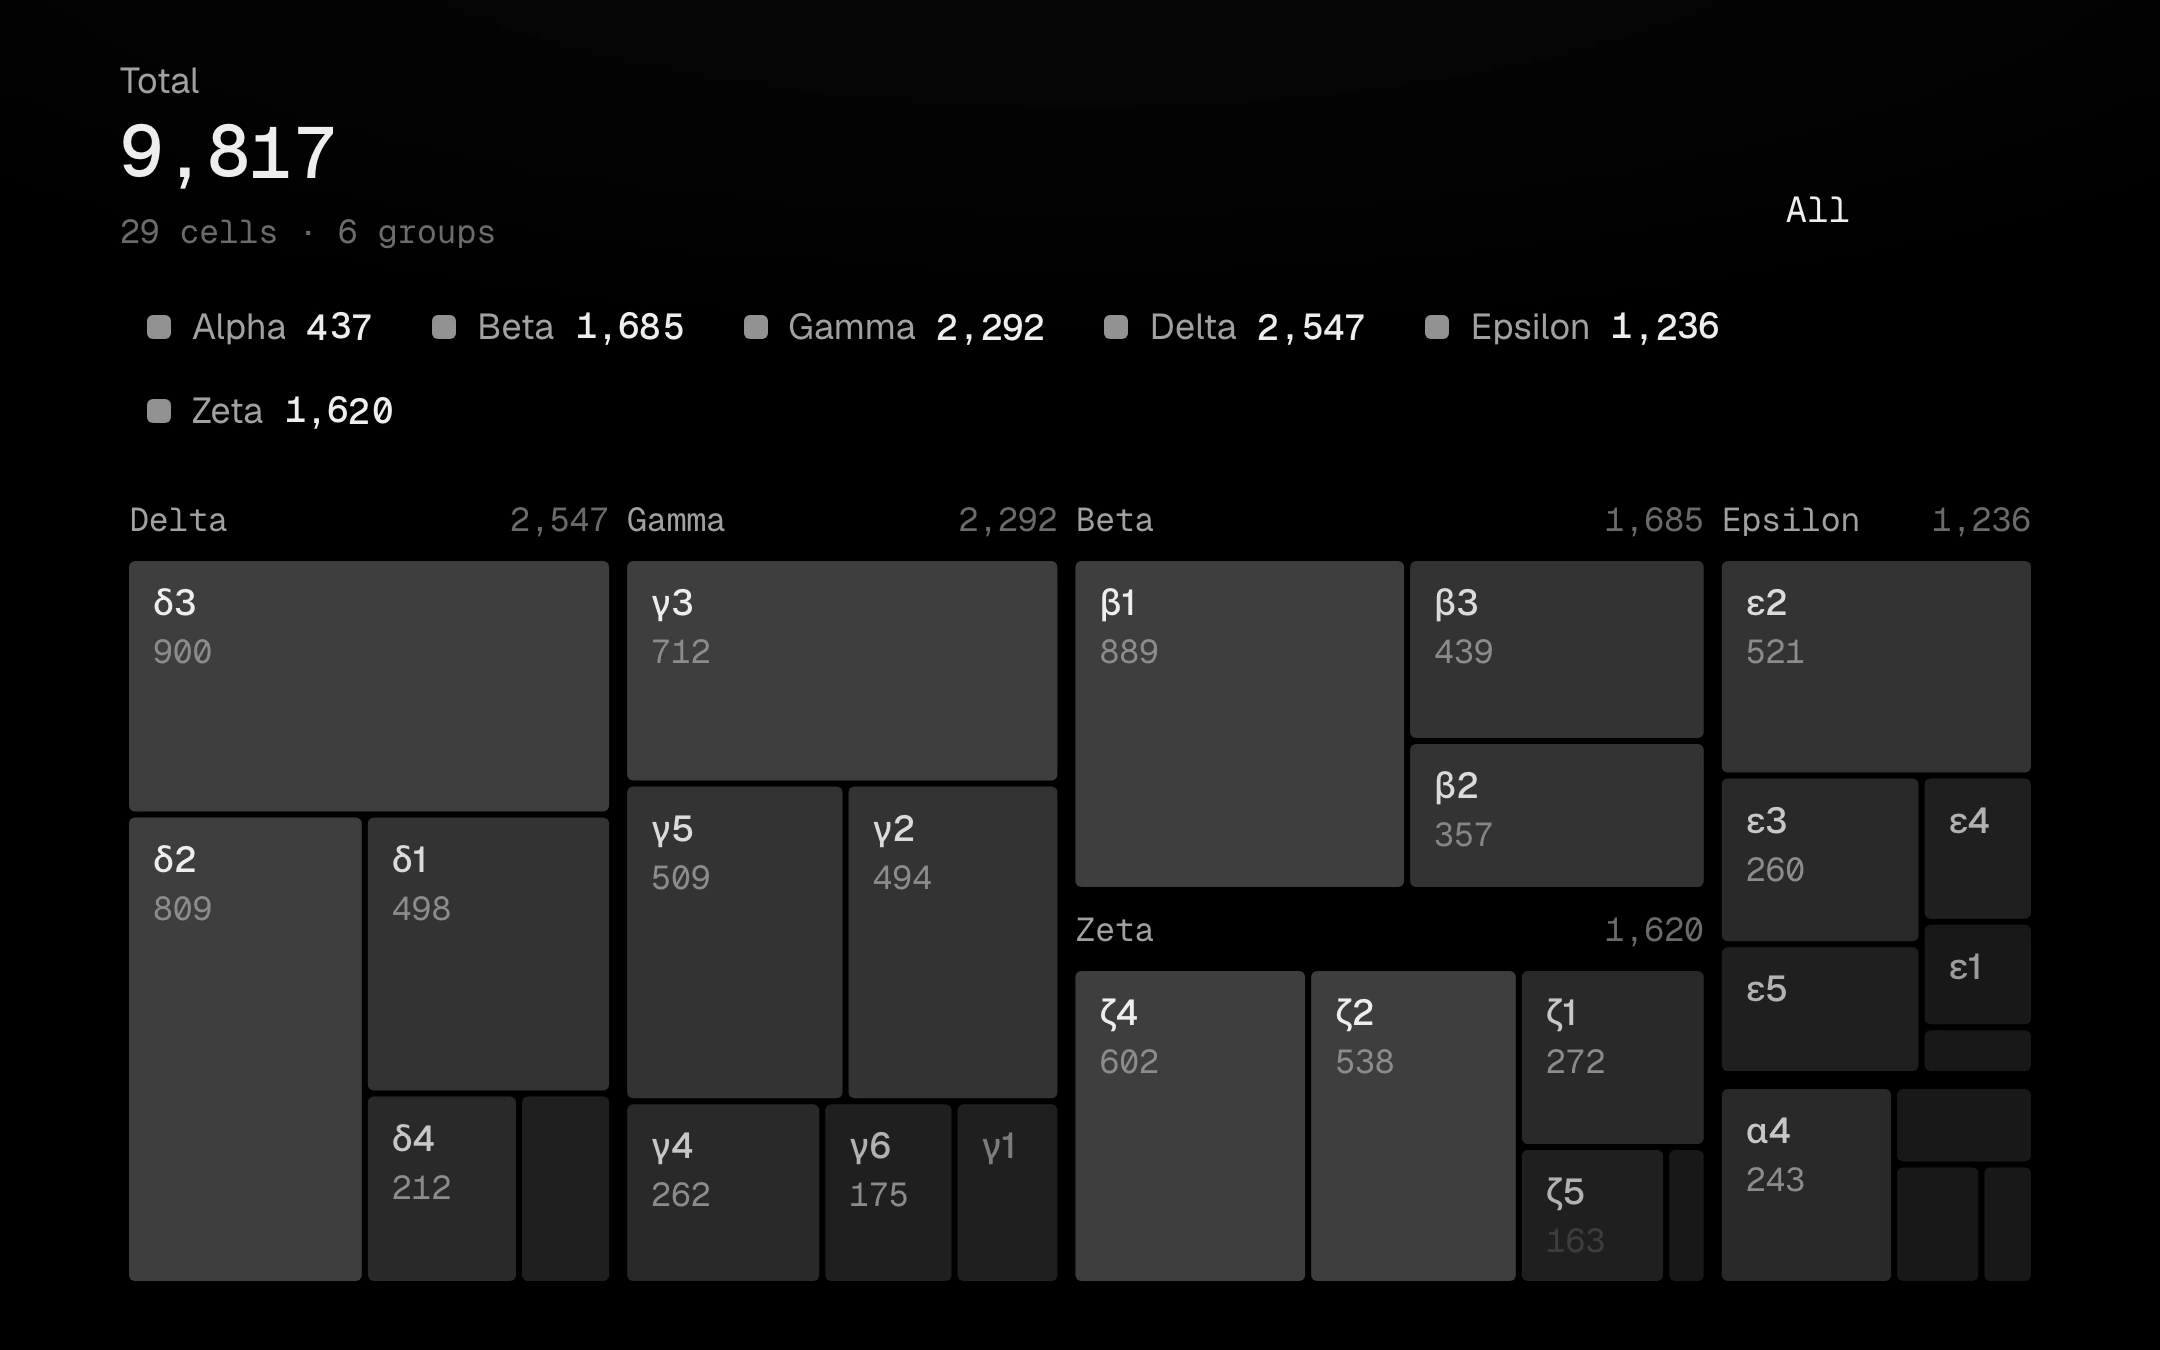
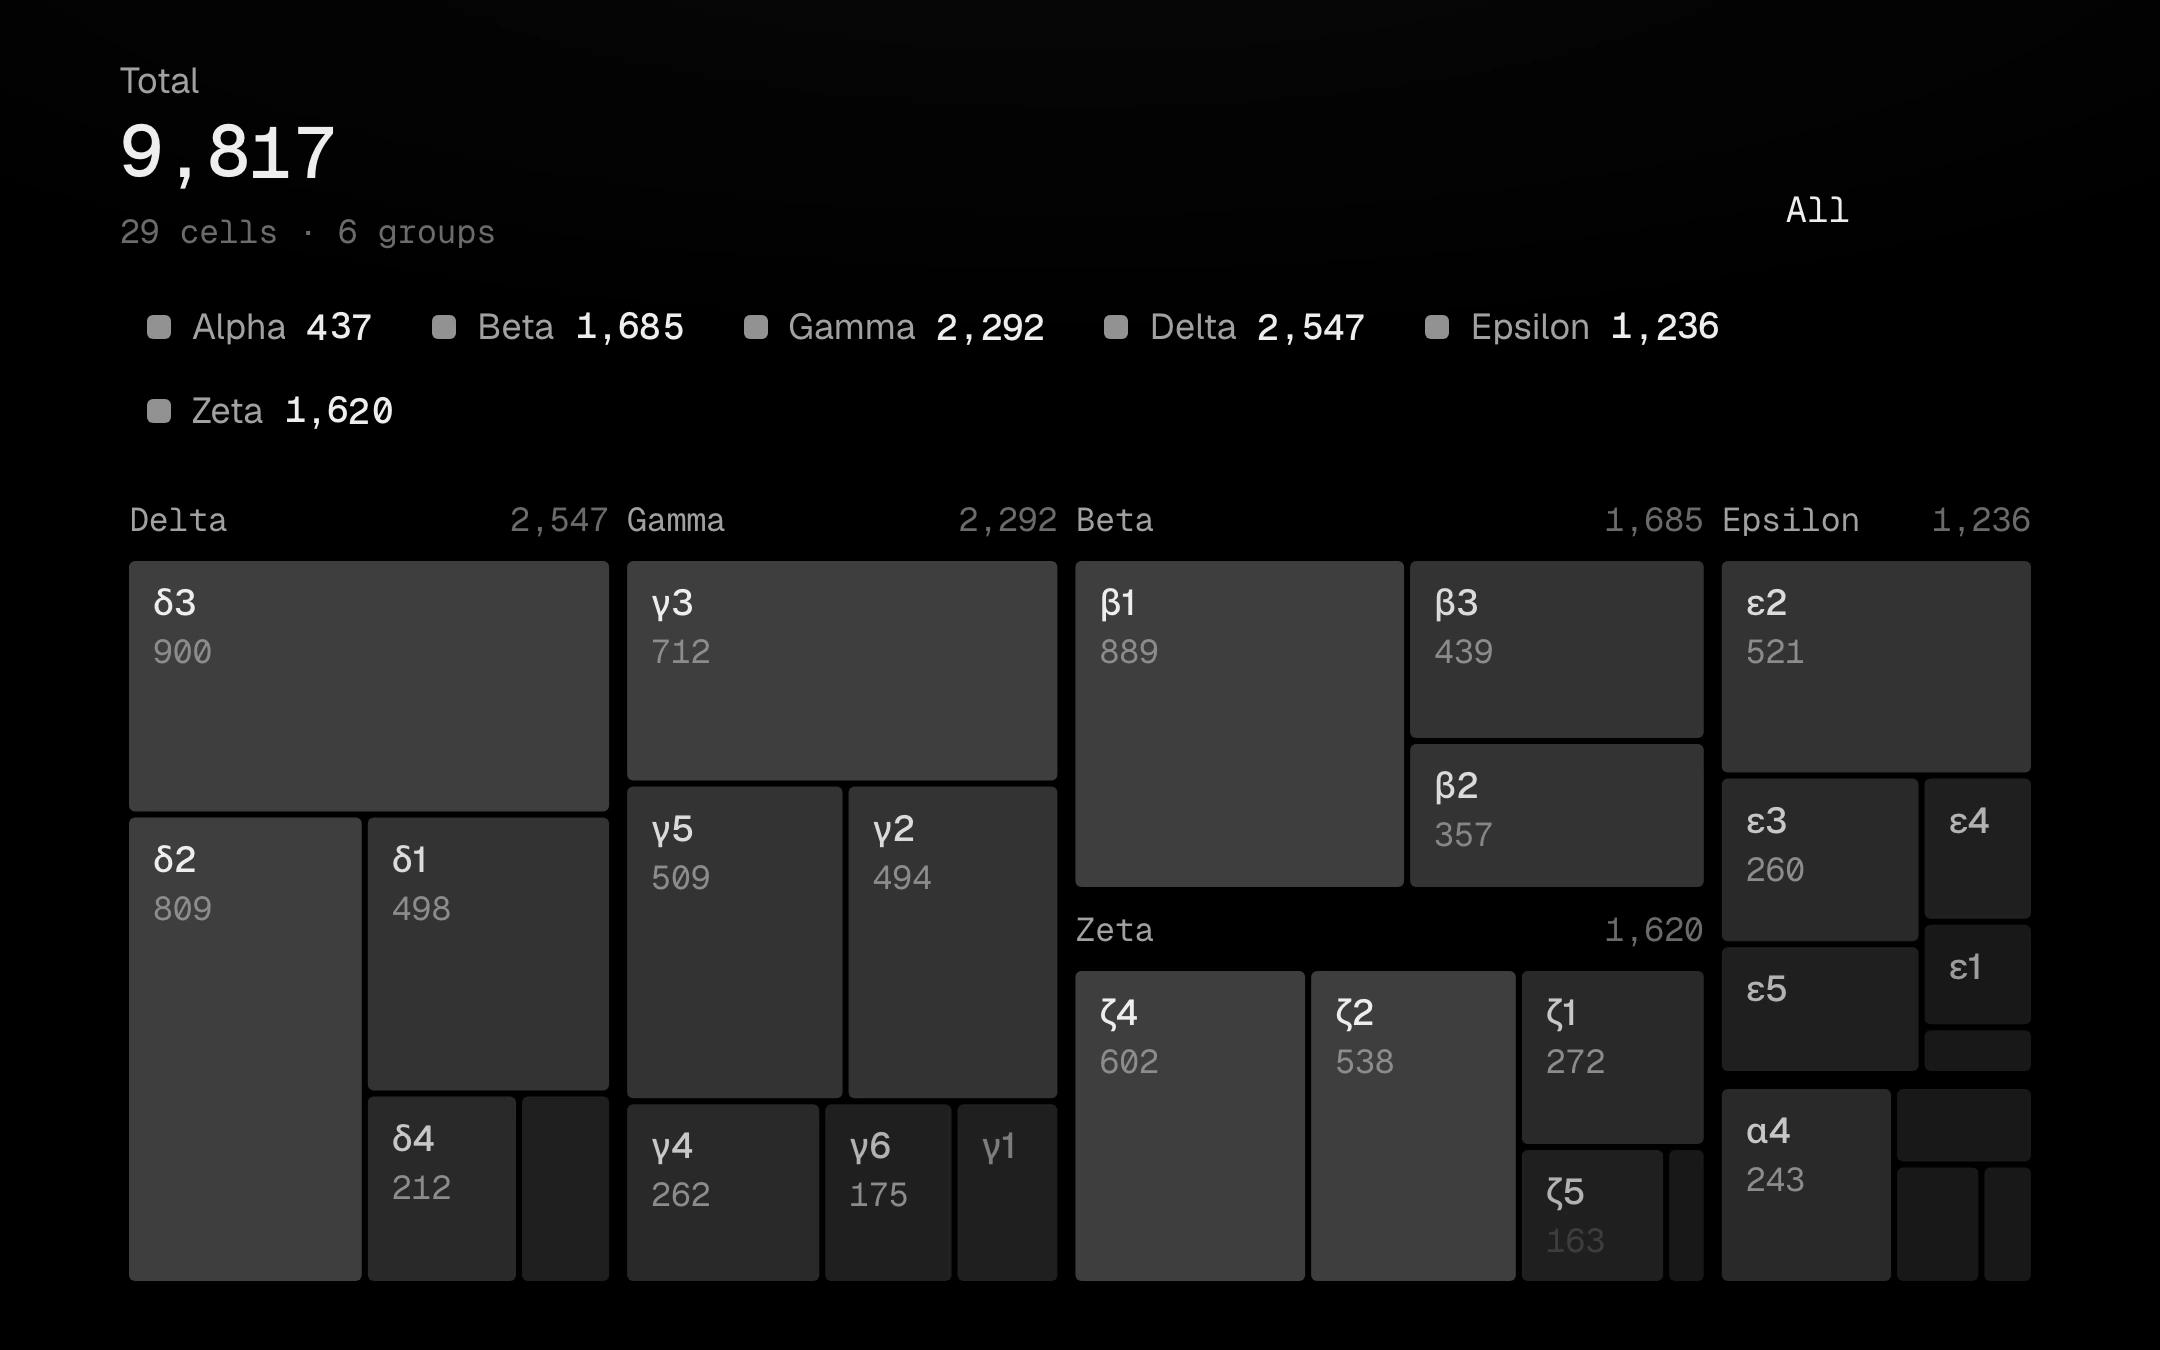
A squarified treemap with 2px gaps, each cell a grey step by its value.
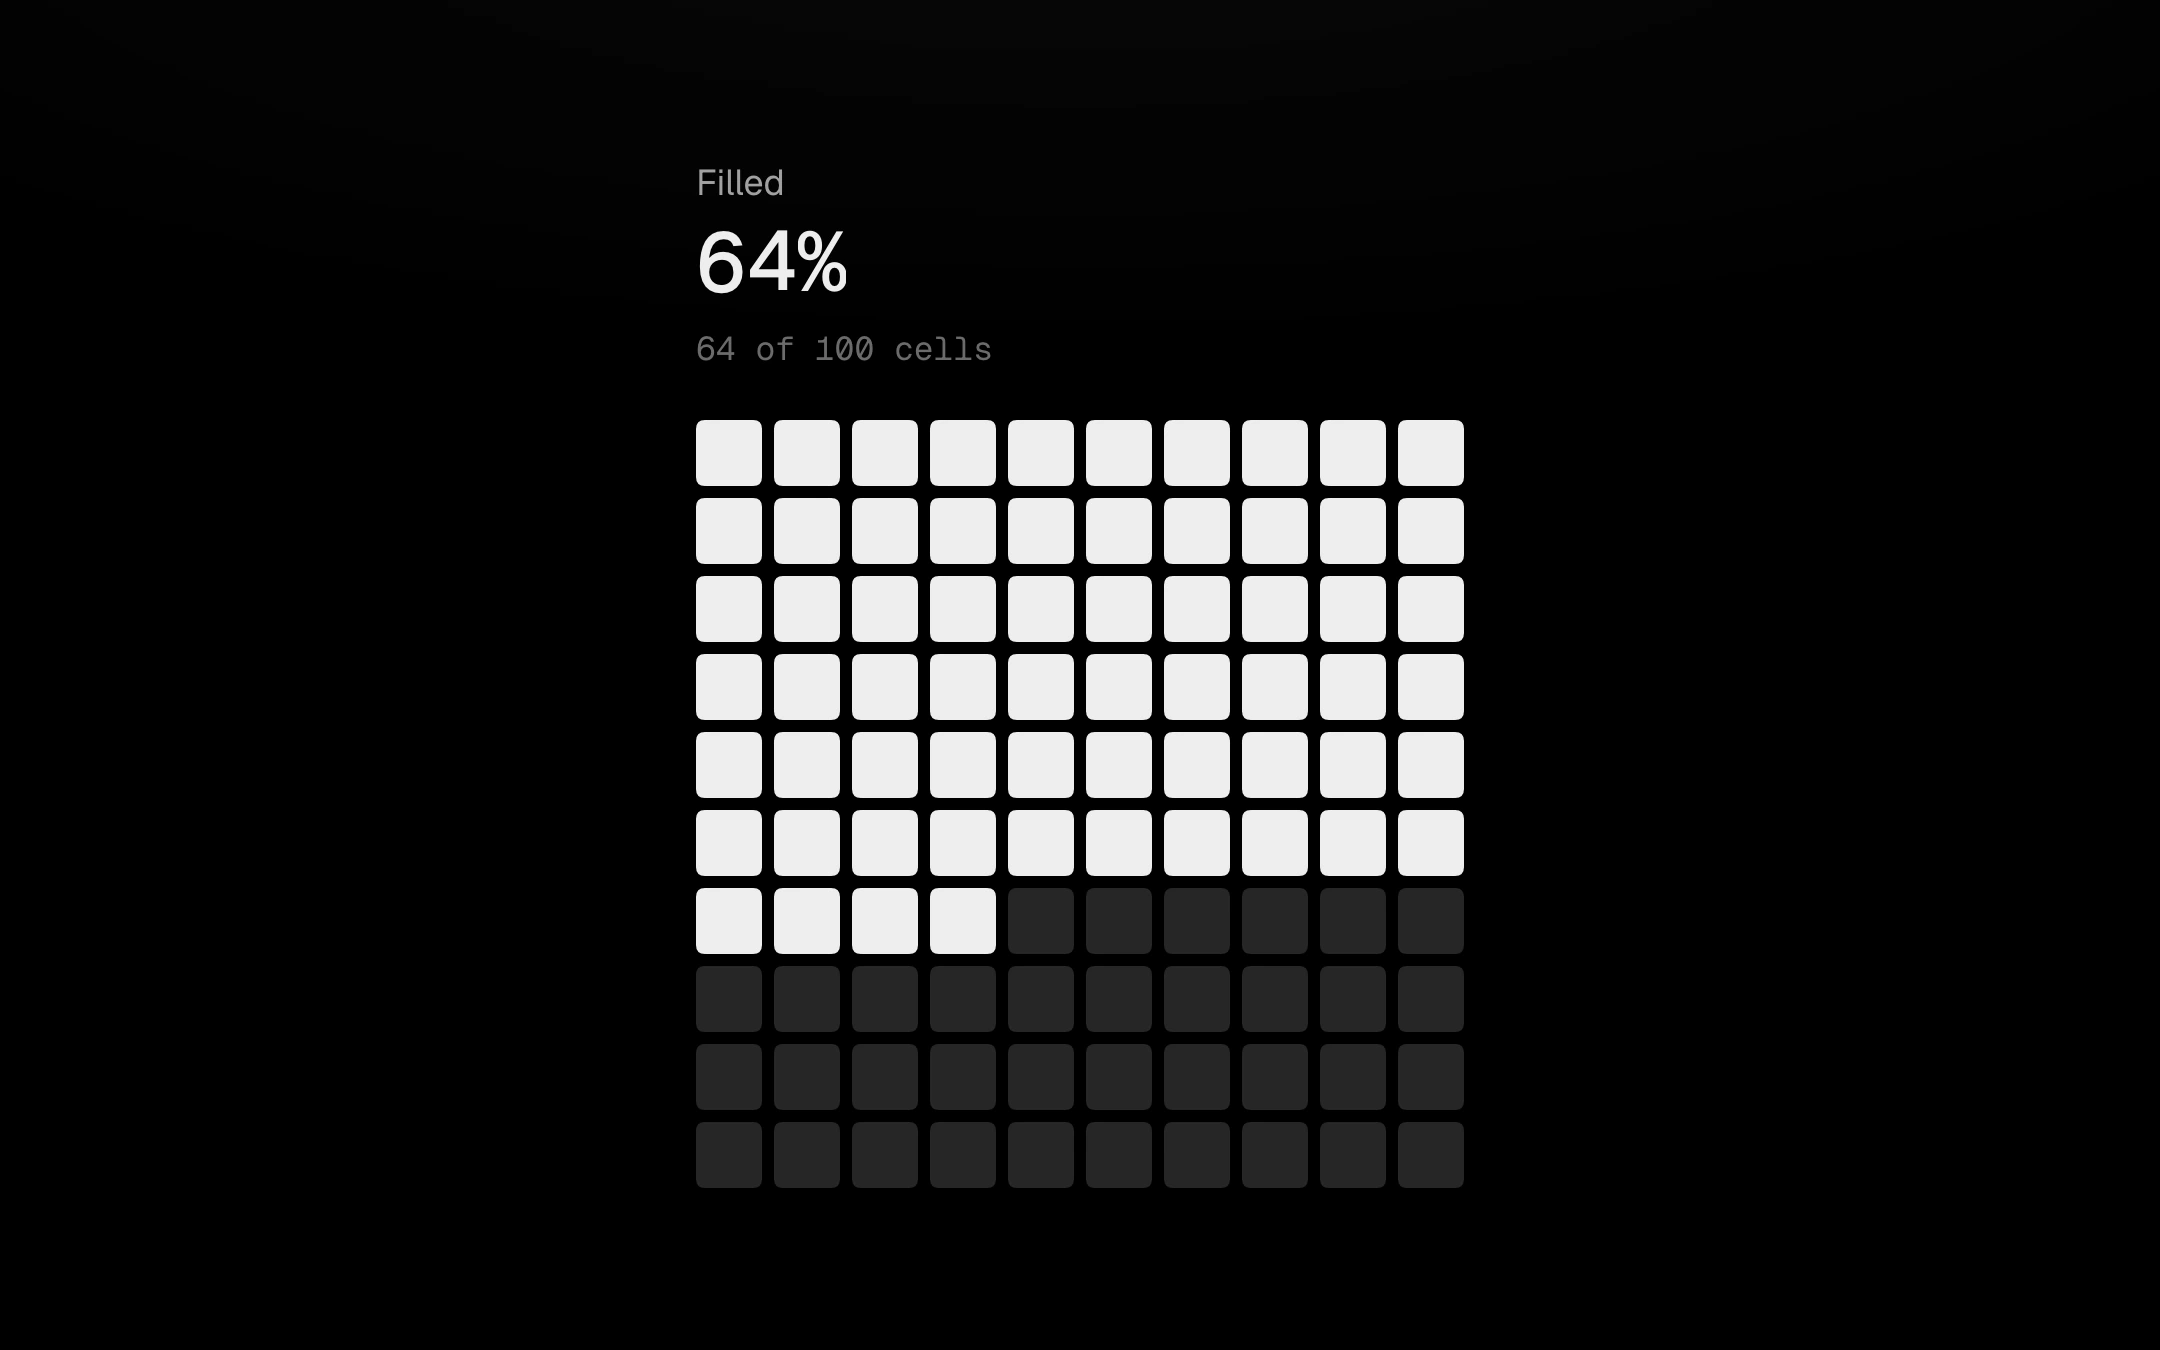
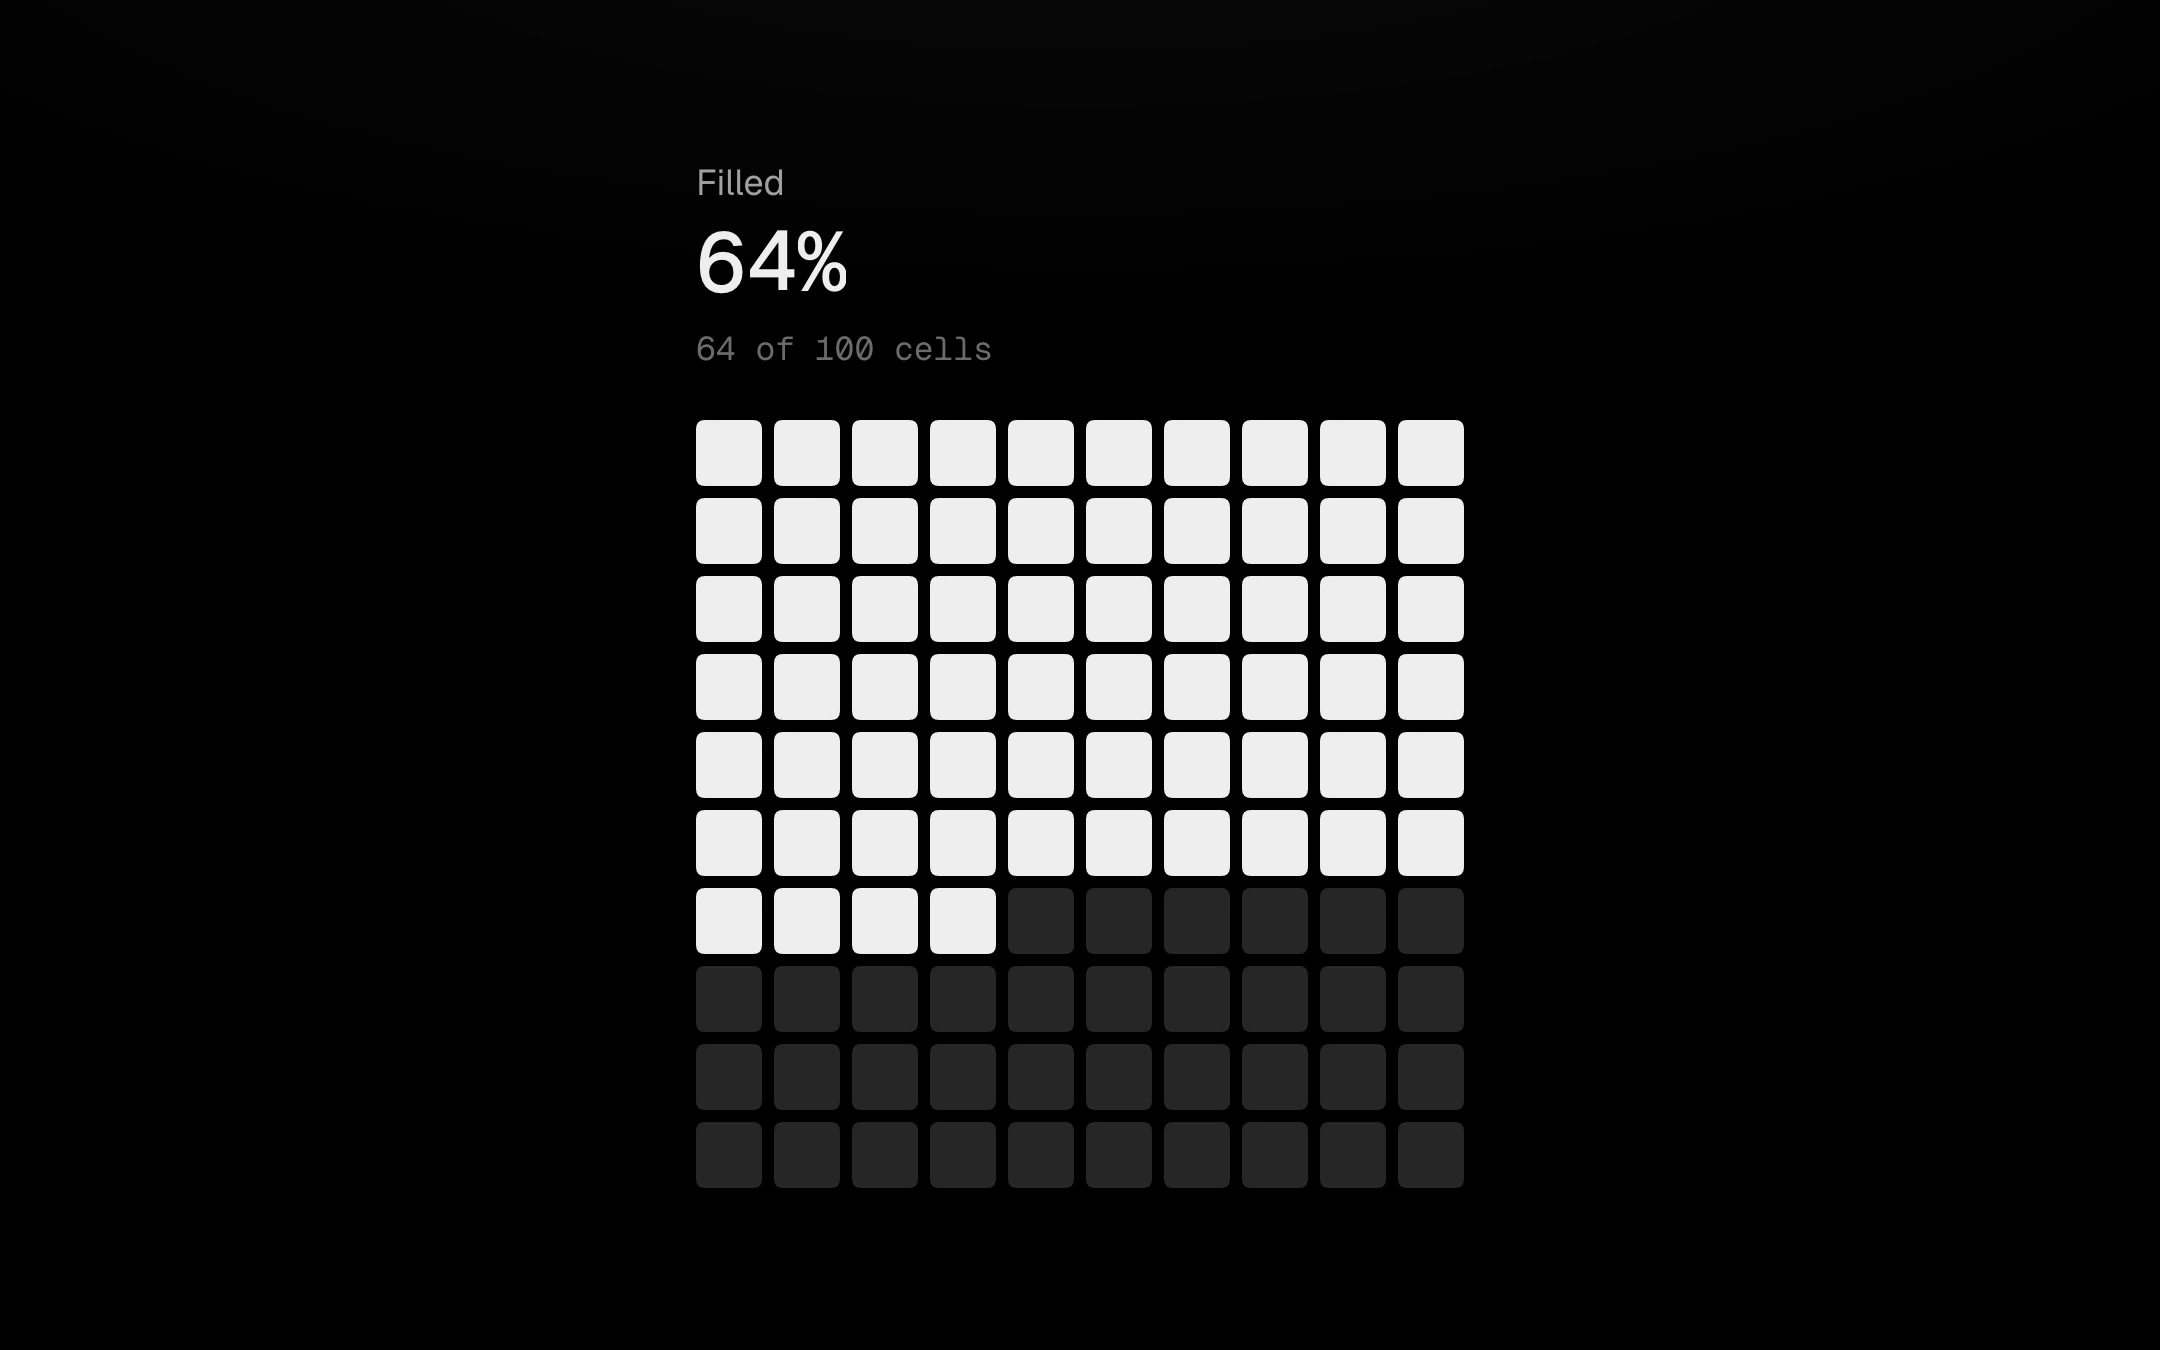
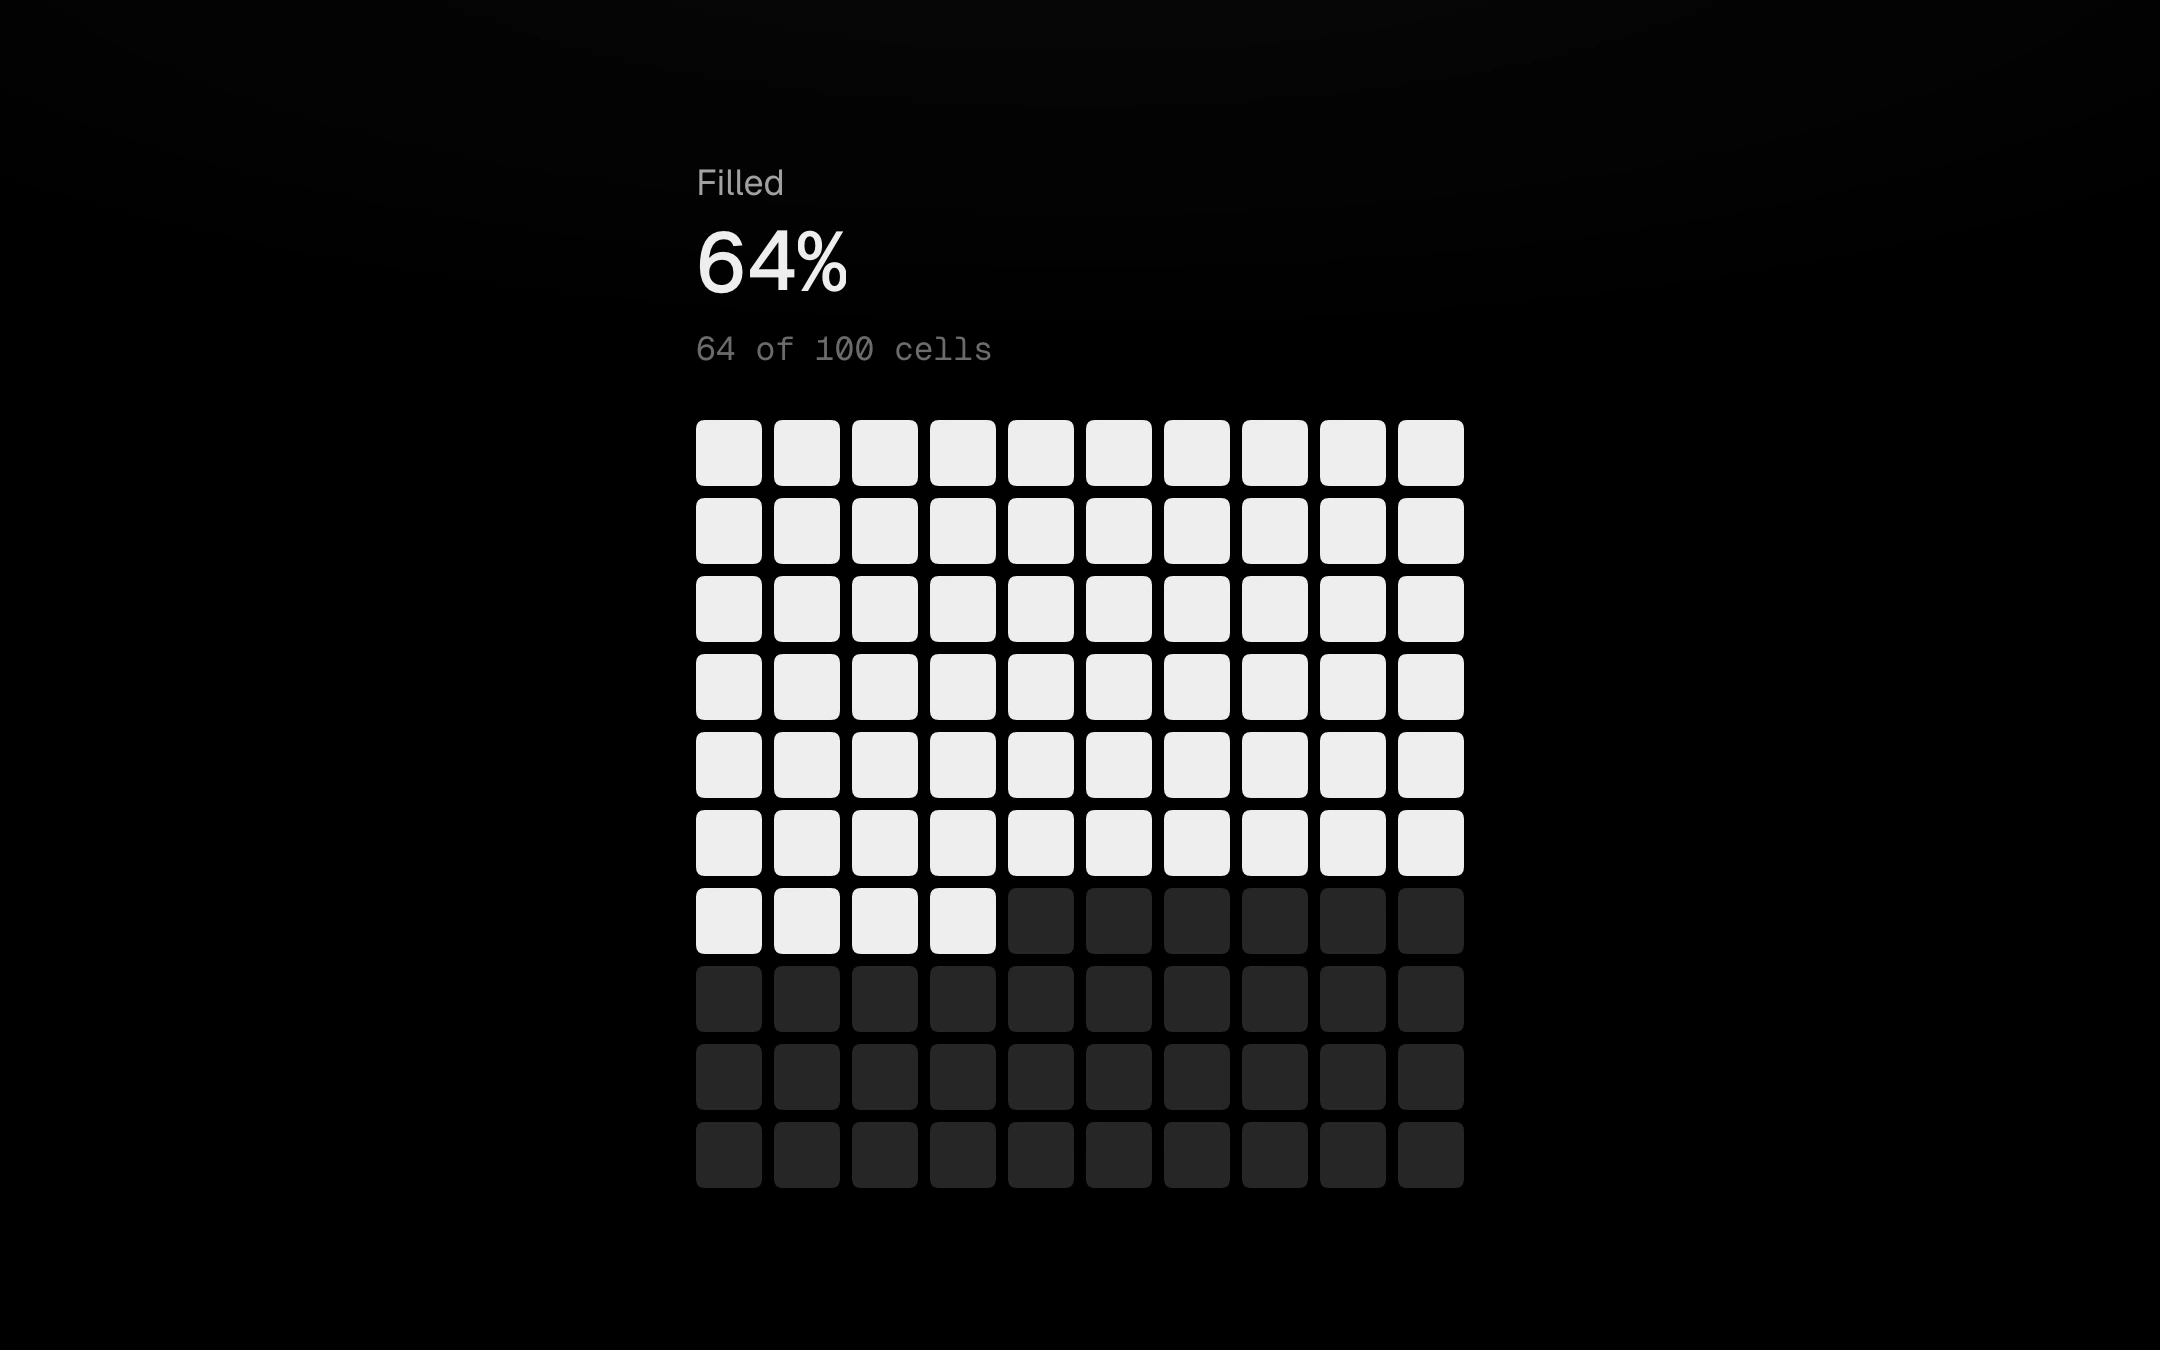
A hundred small cells showing a share of 100.
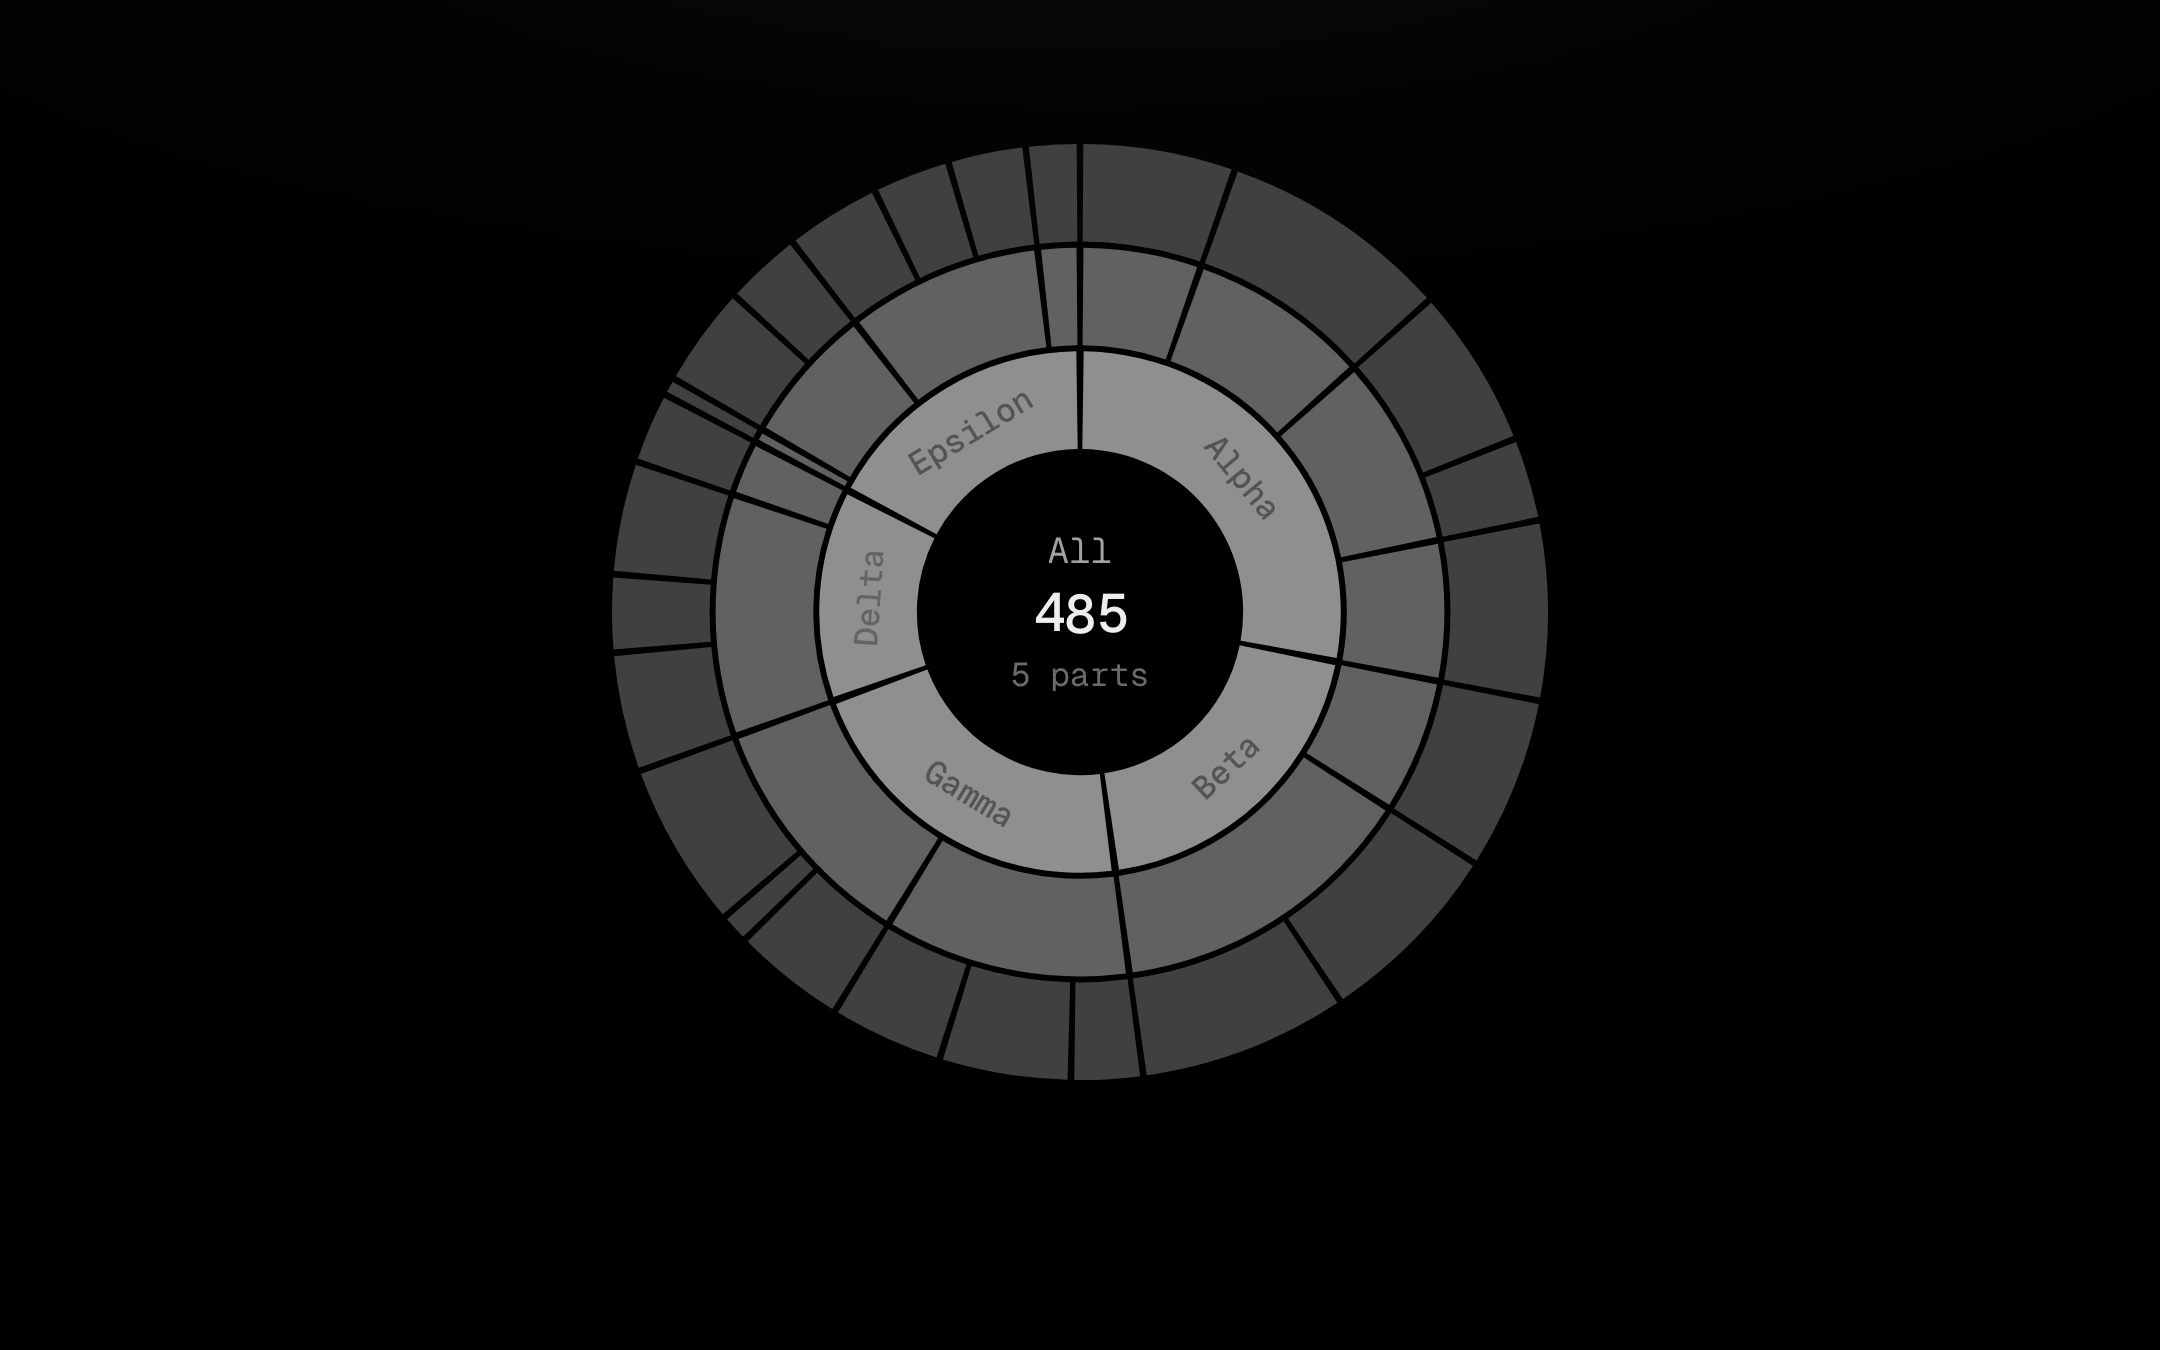
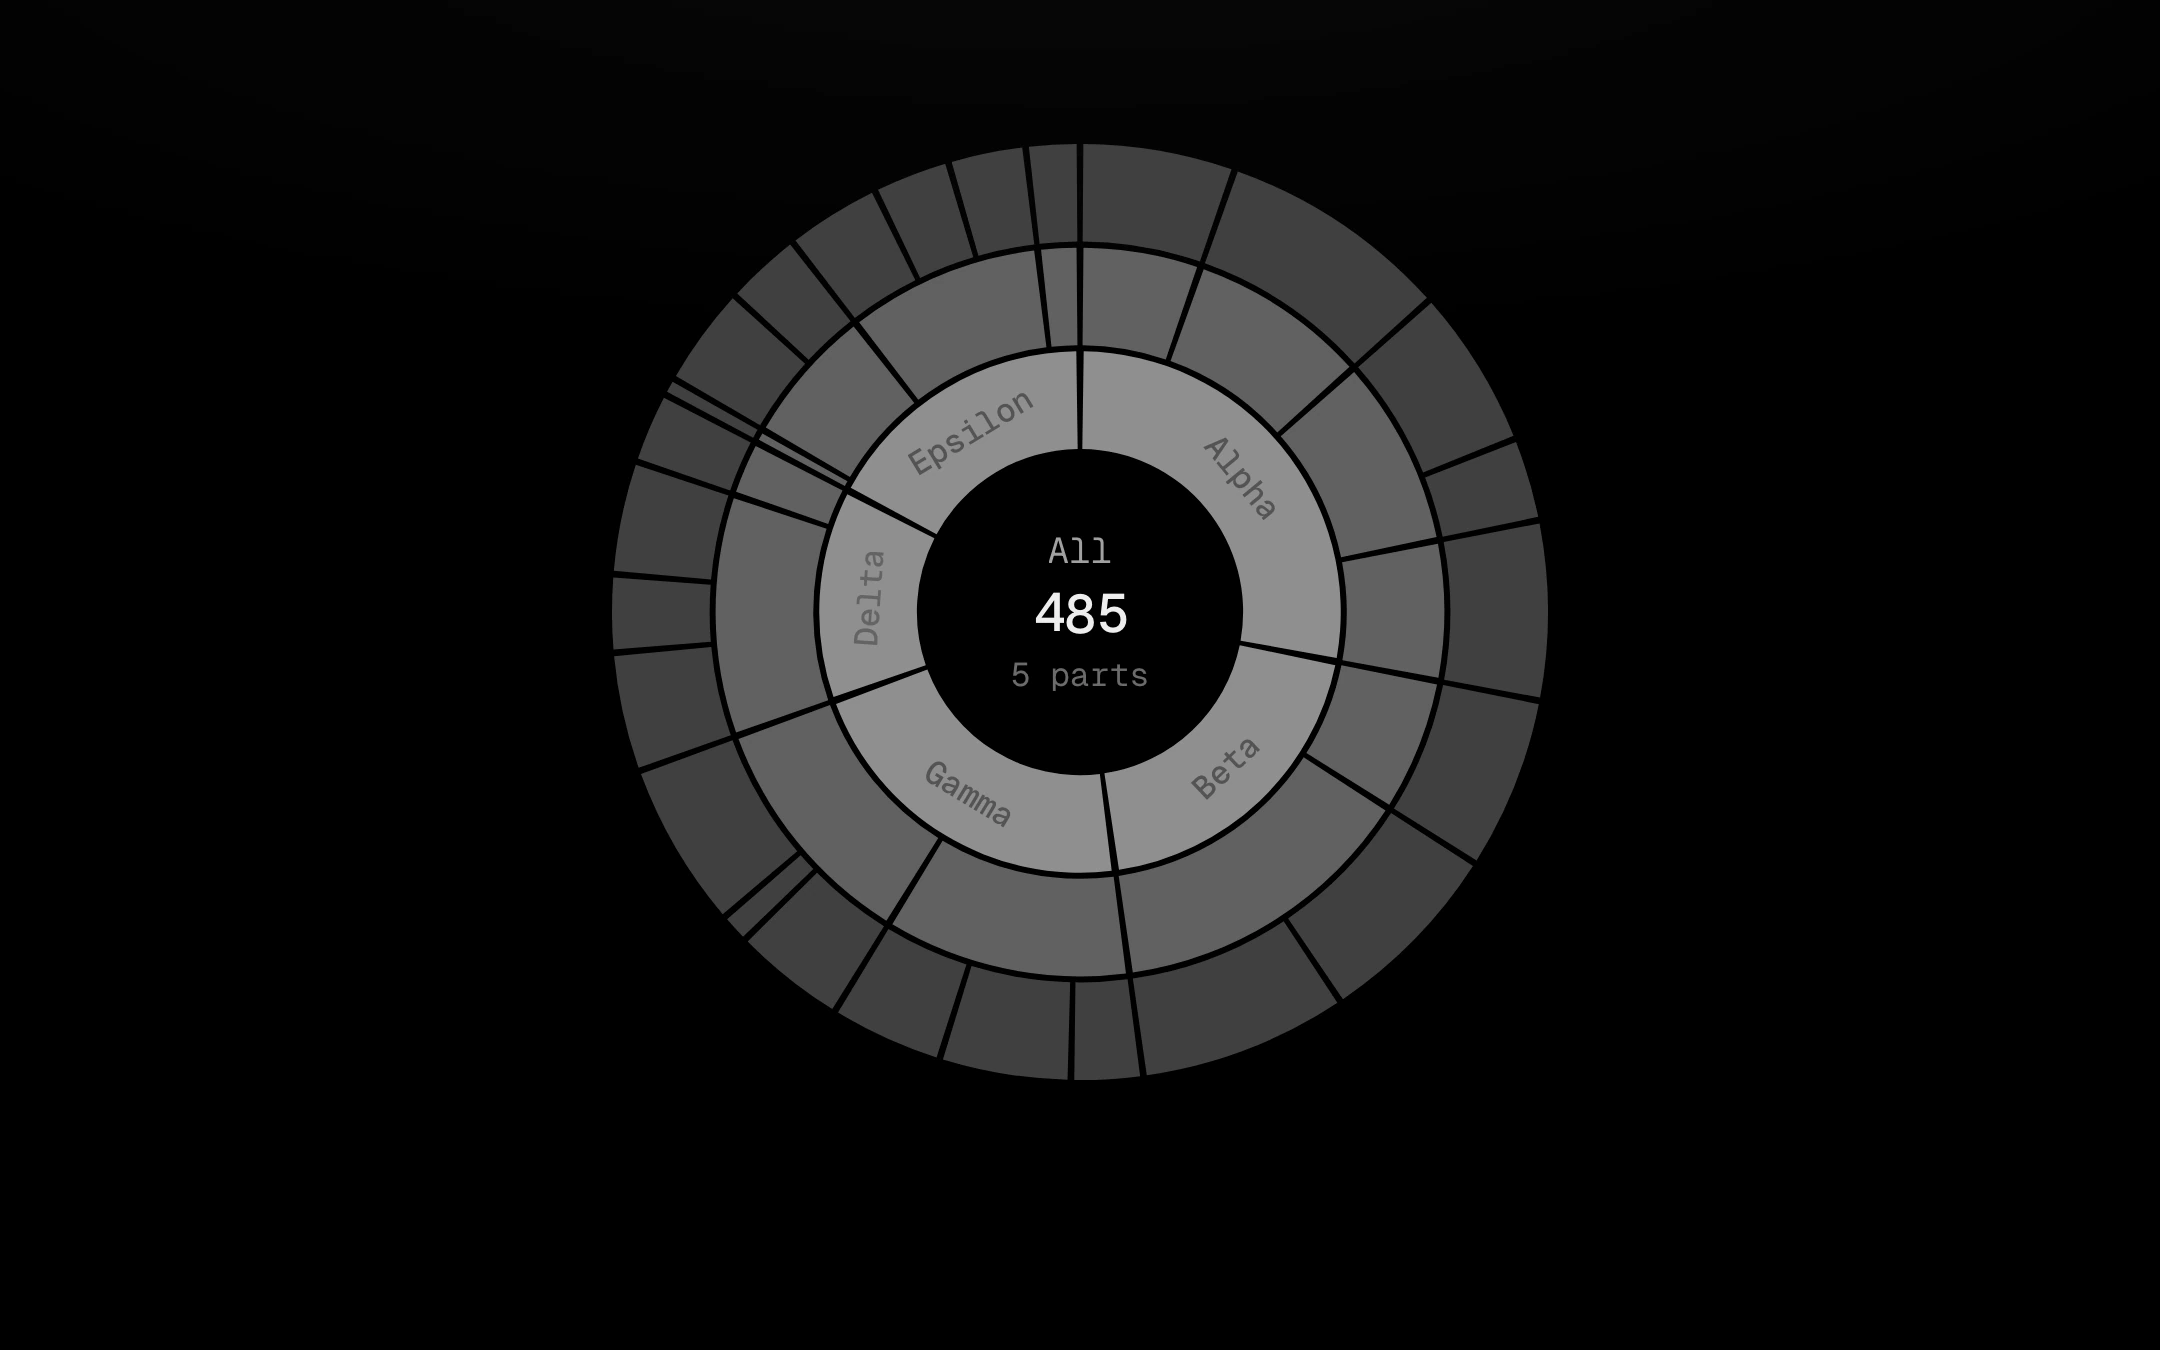
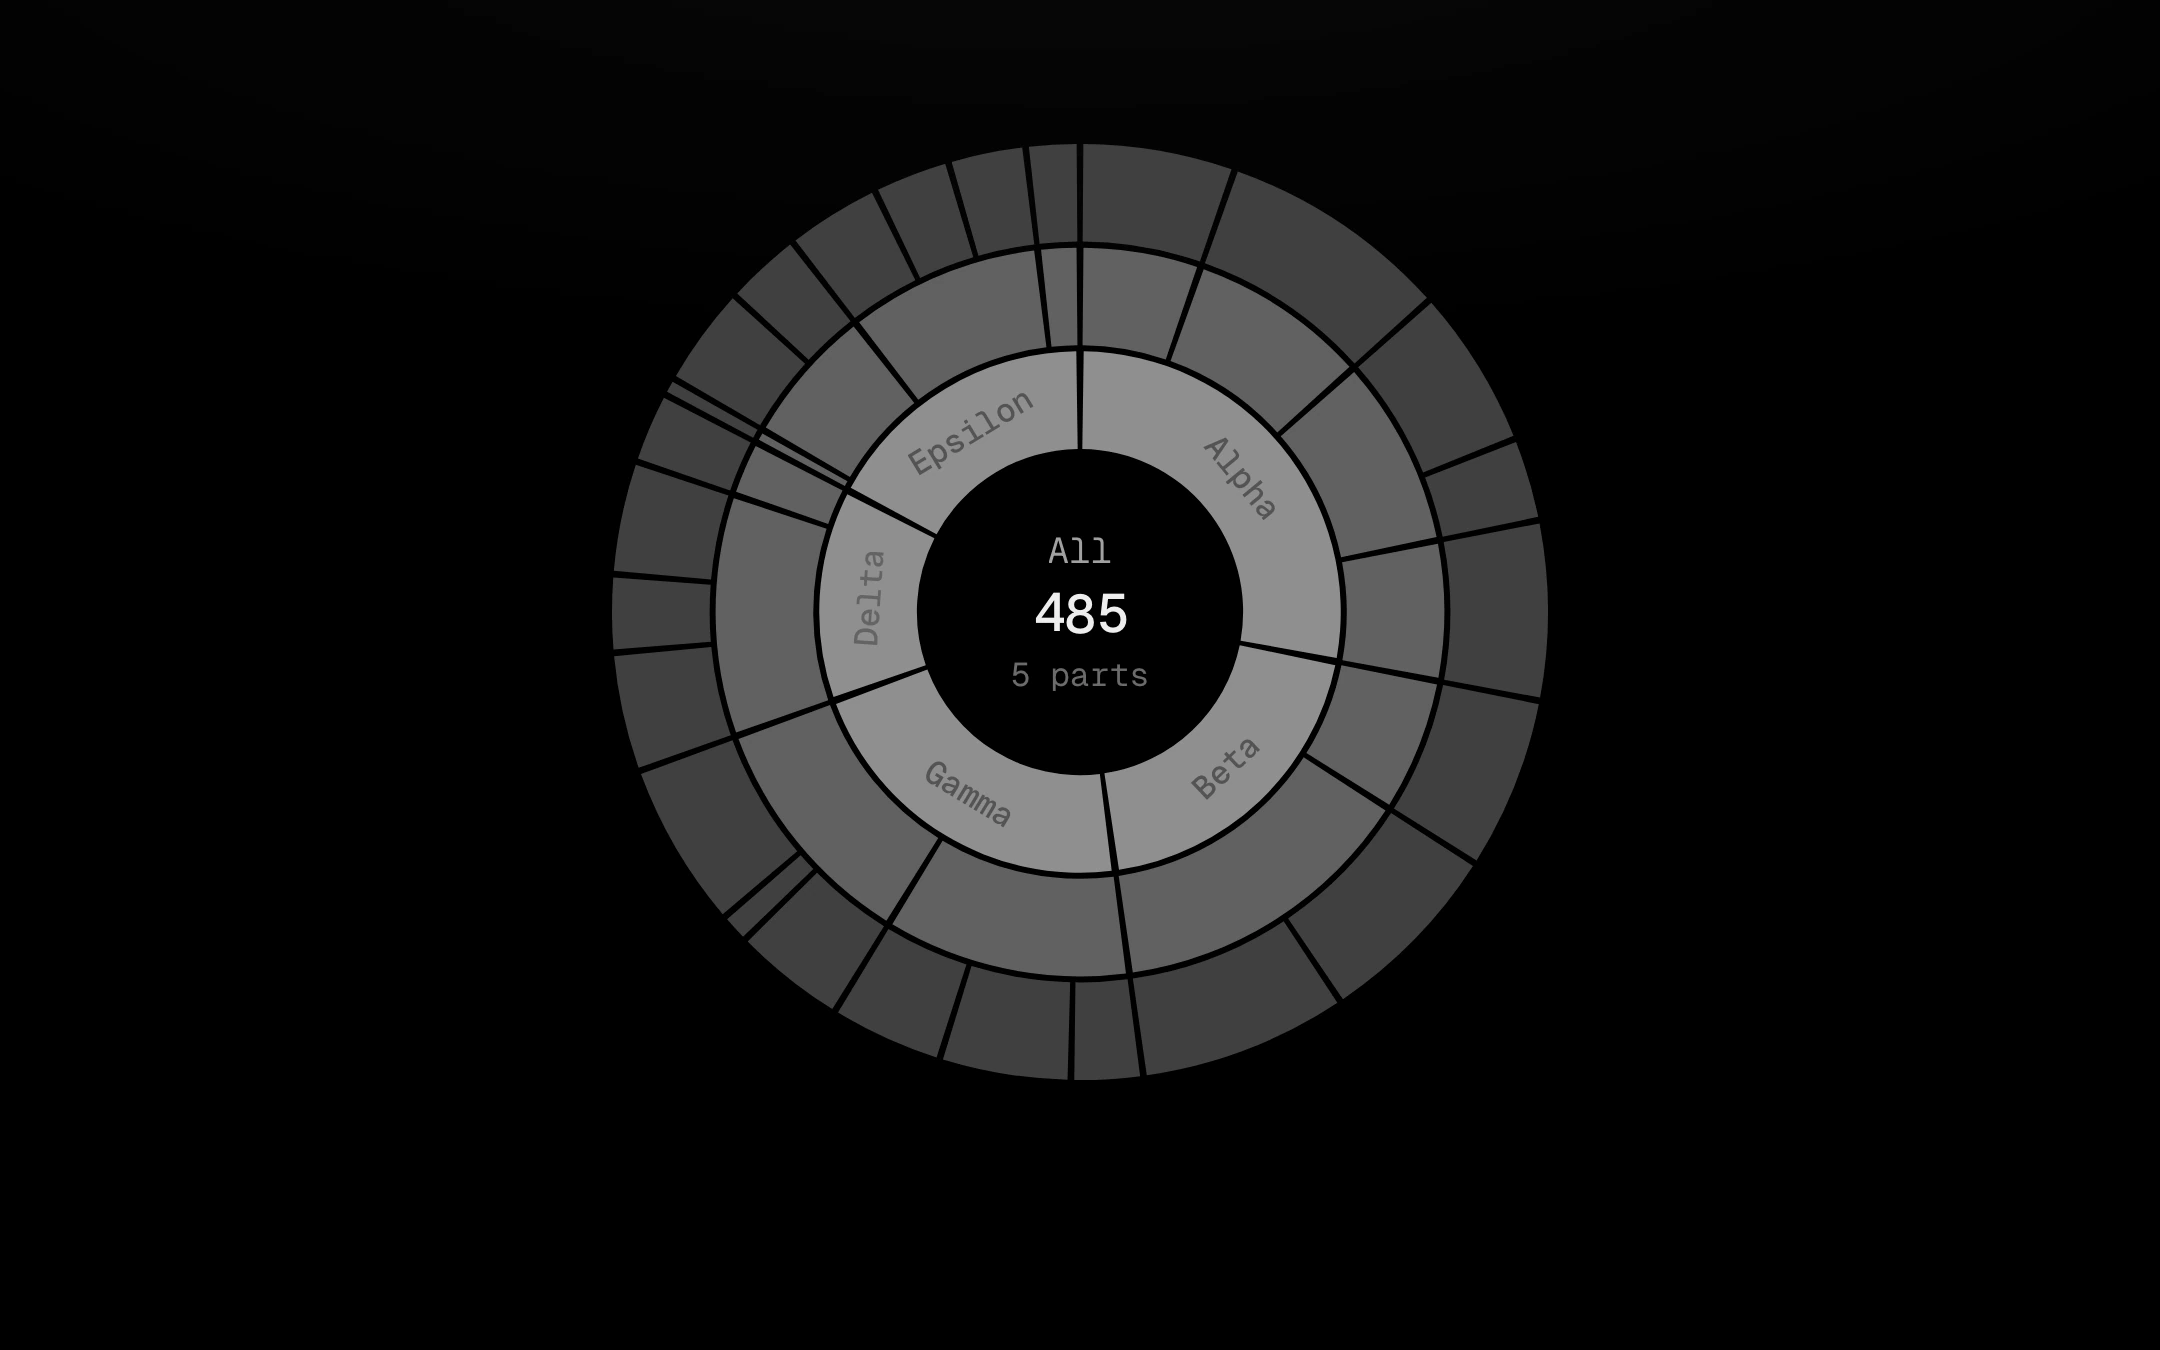
A hierarchy as rings around a centre, one grey step per depth, cut apart by 2px gaps, sweeping on clockwise.
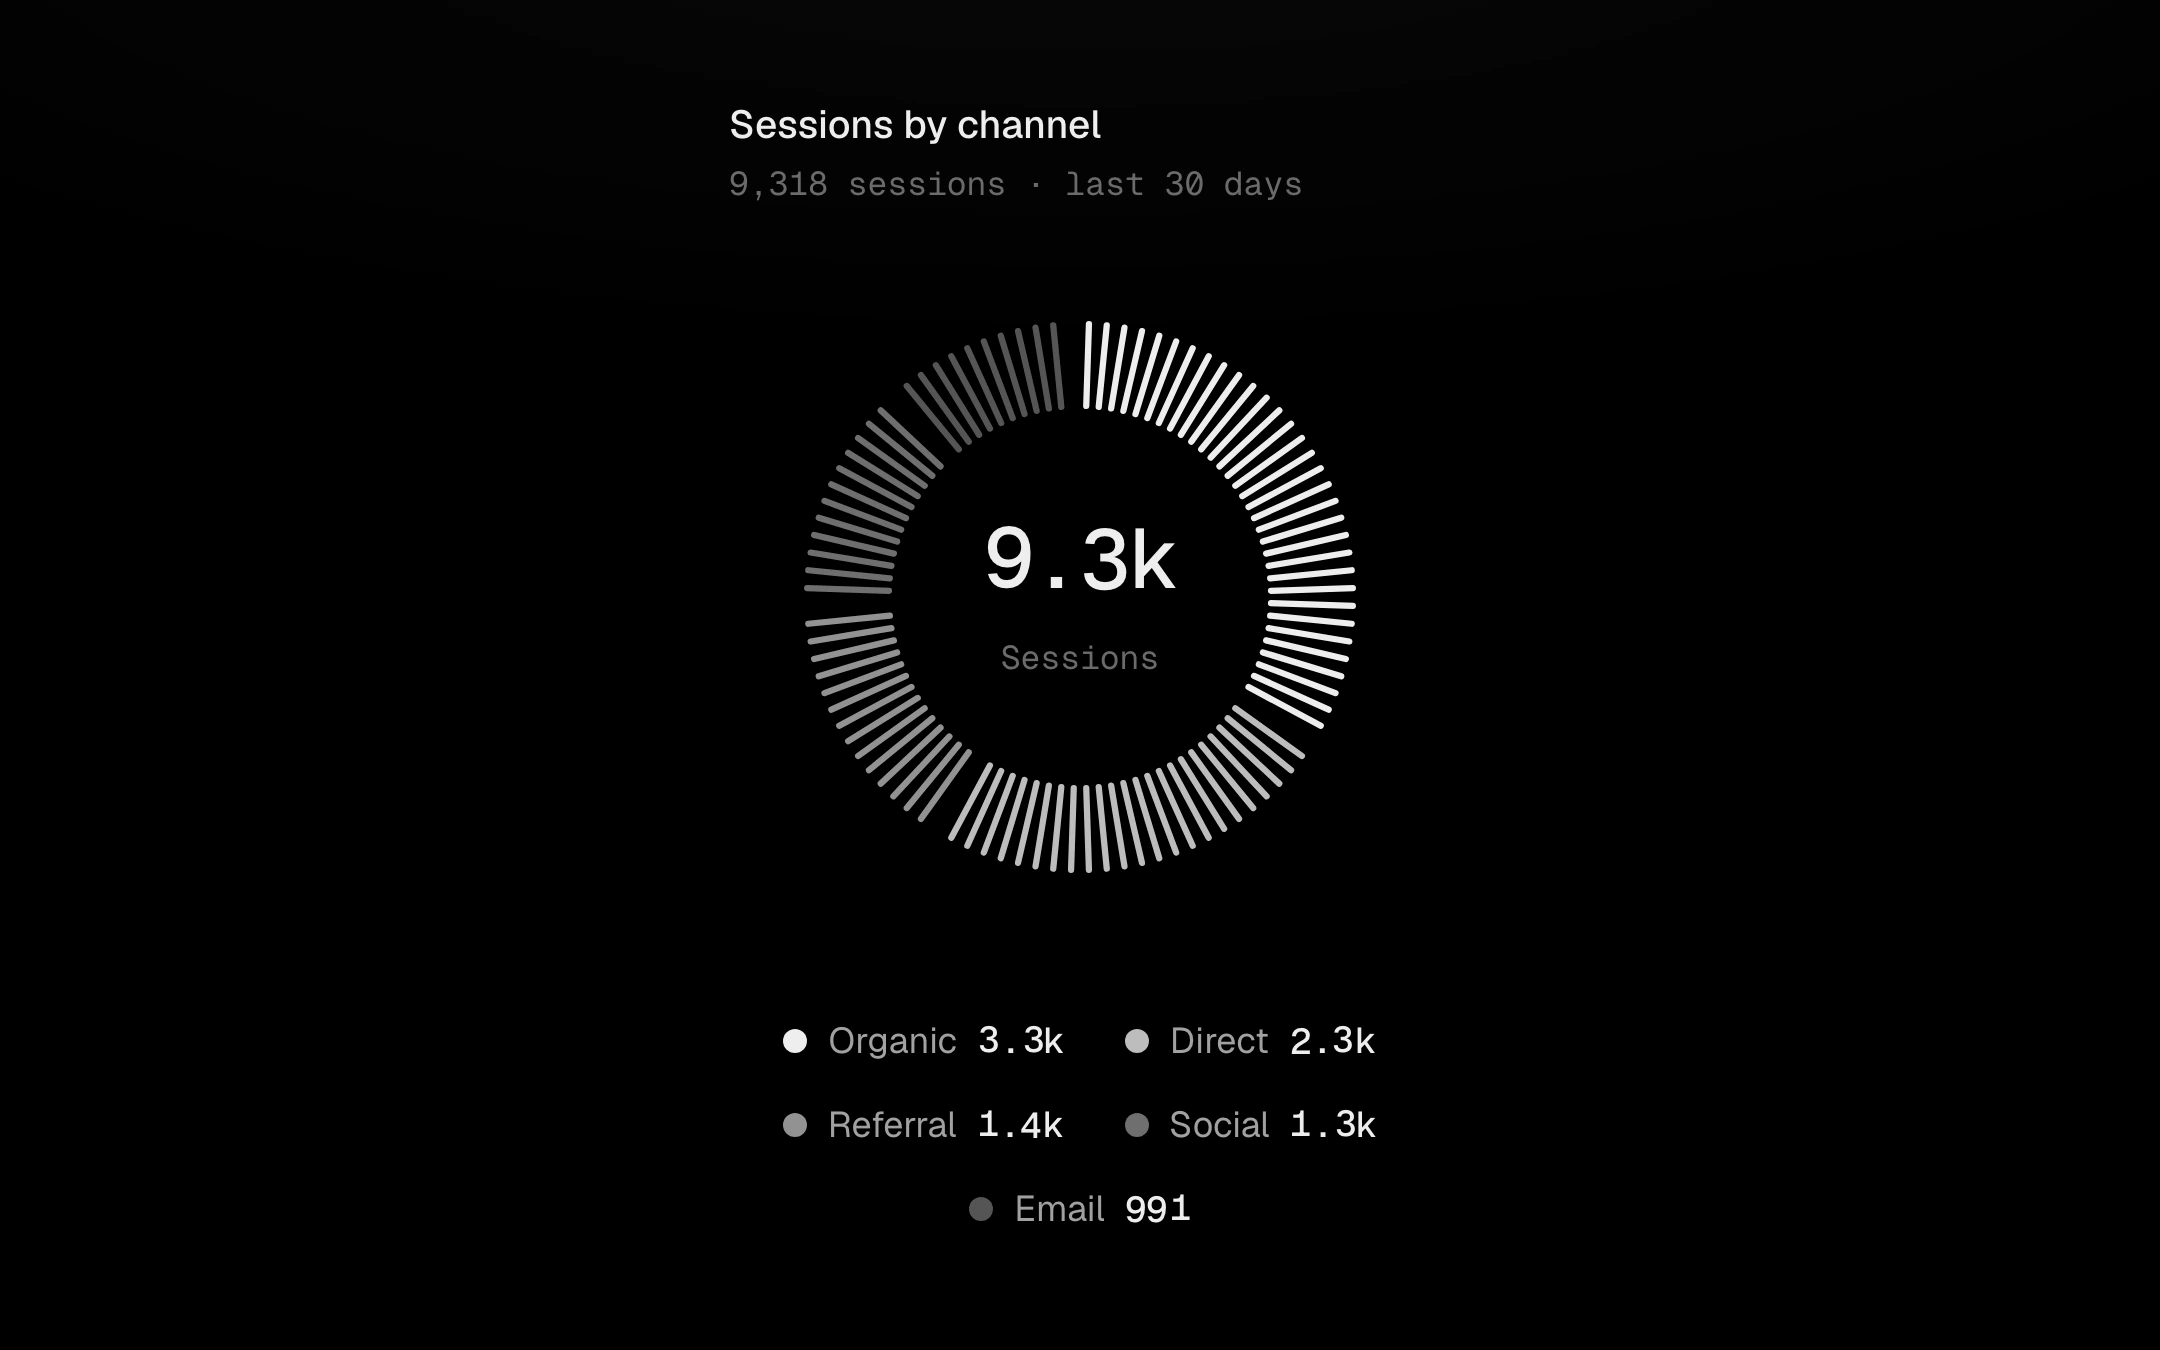
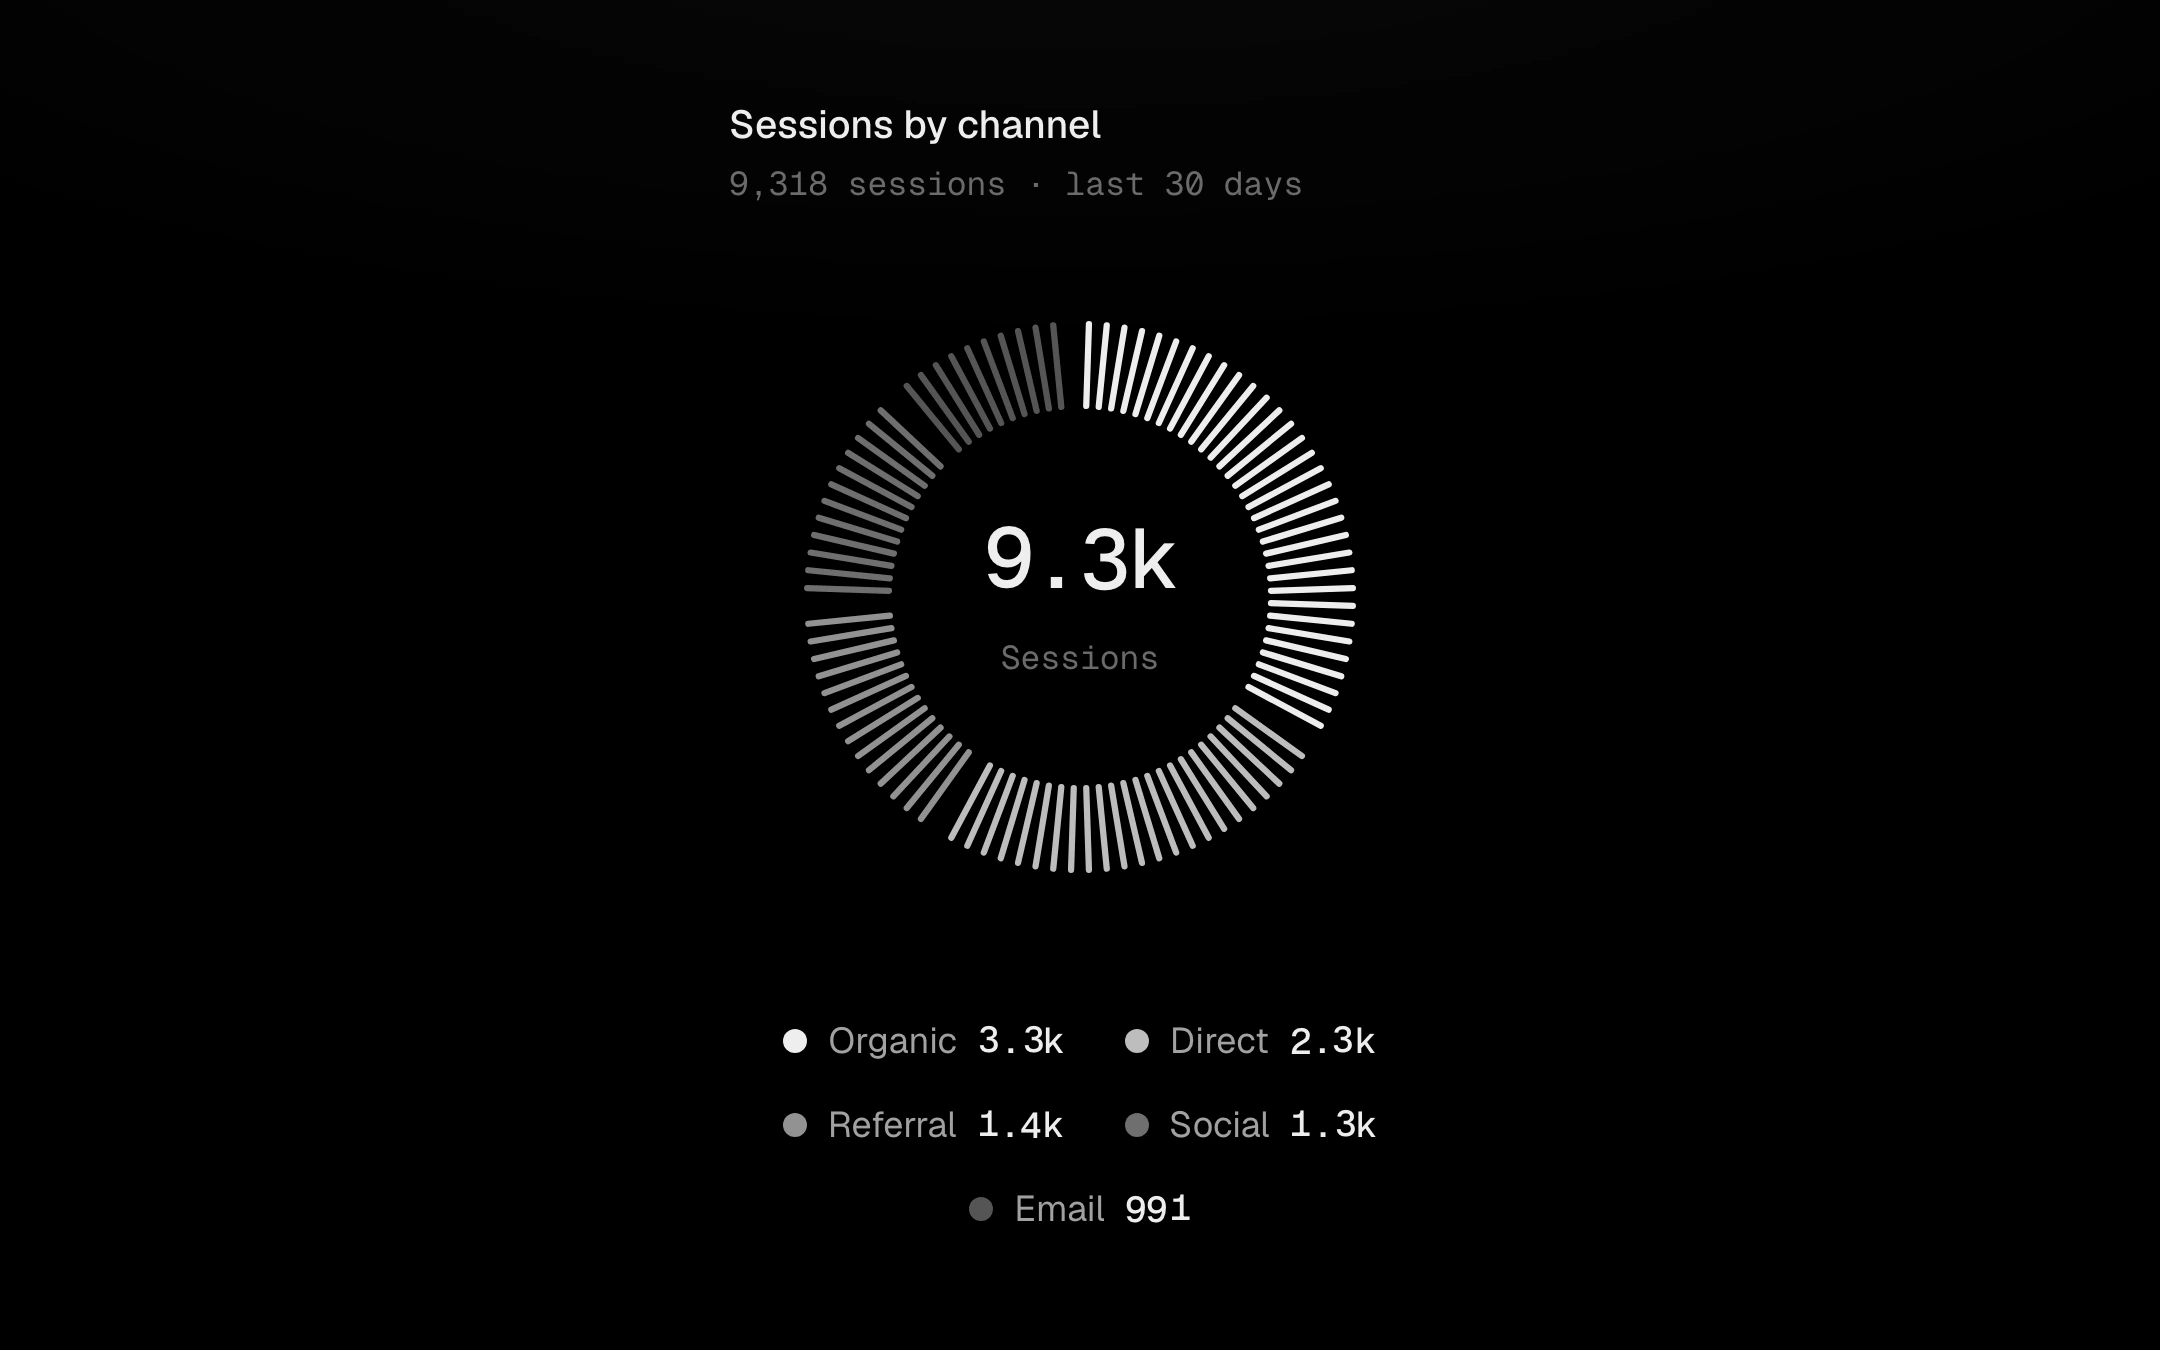
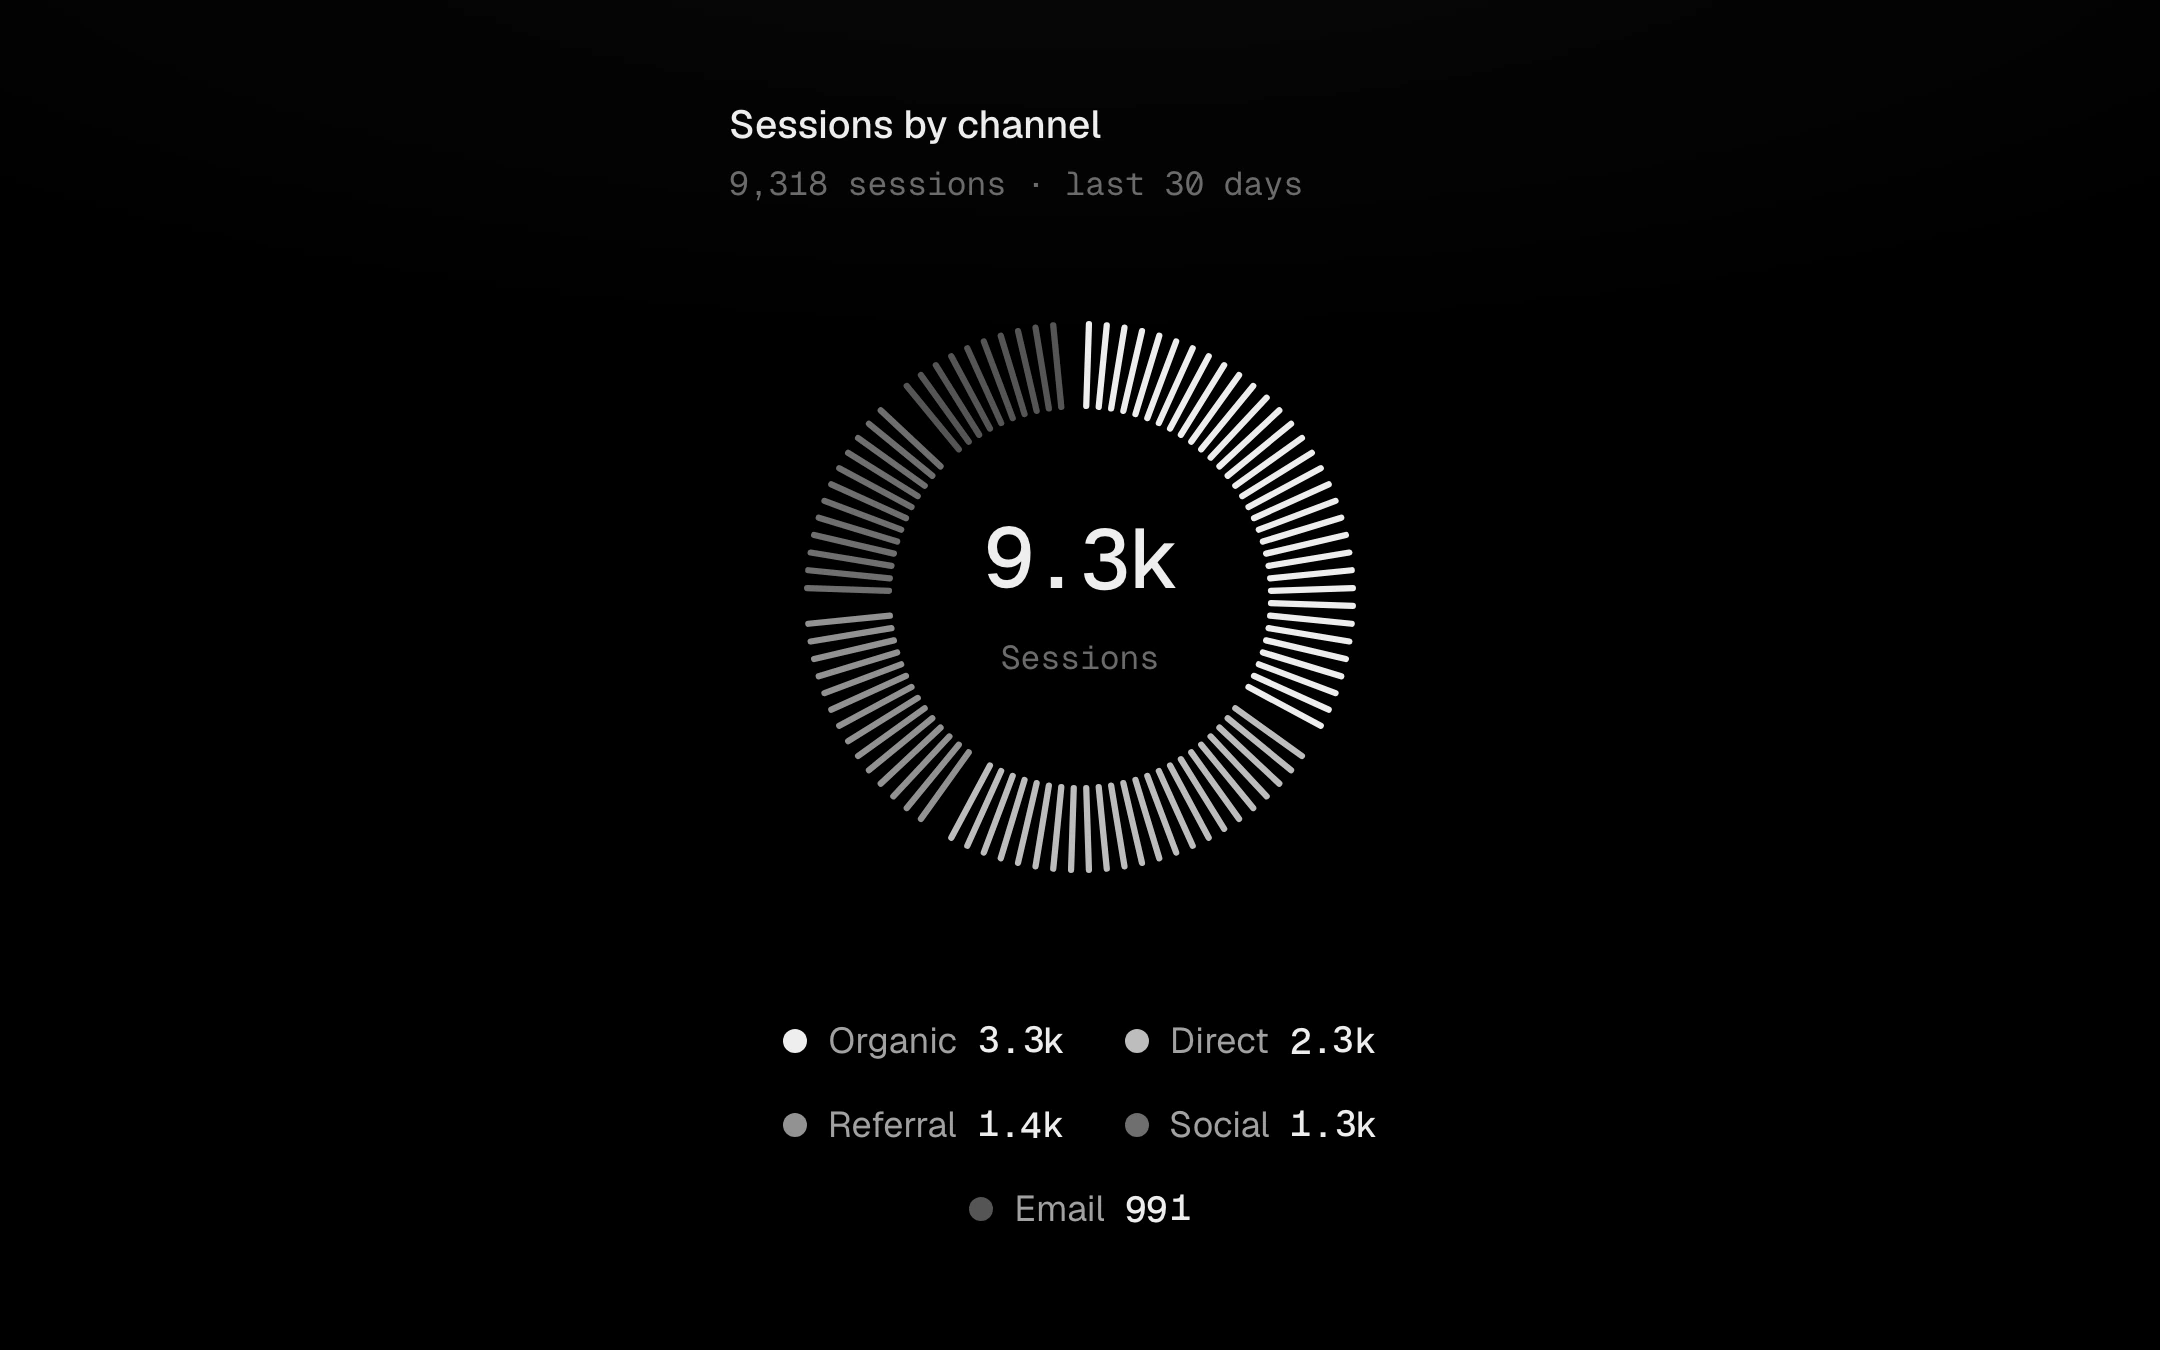
A donut drawn as fine radial ticks.
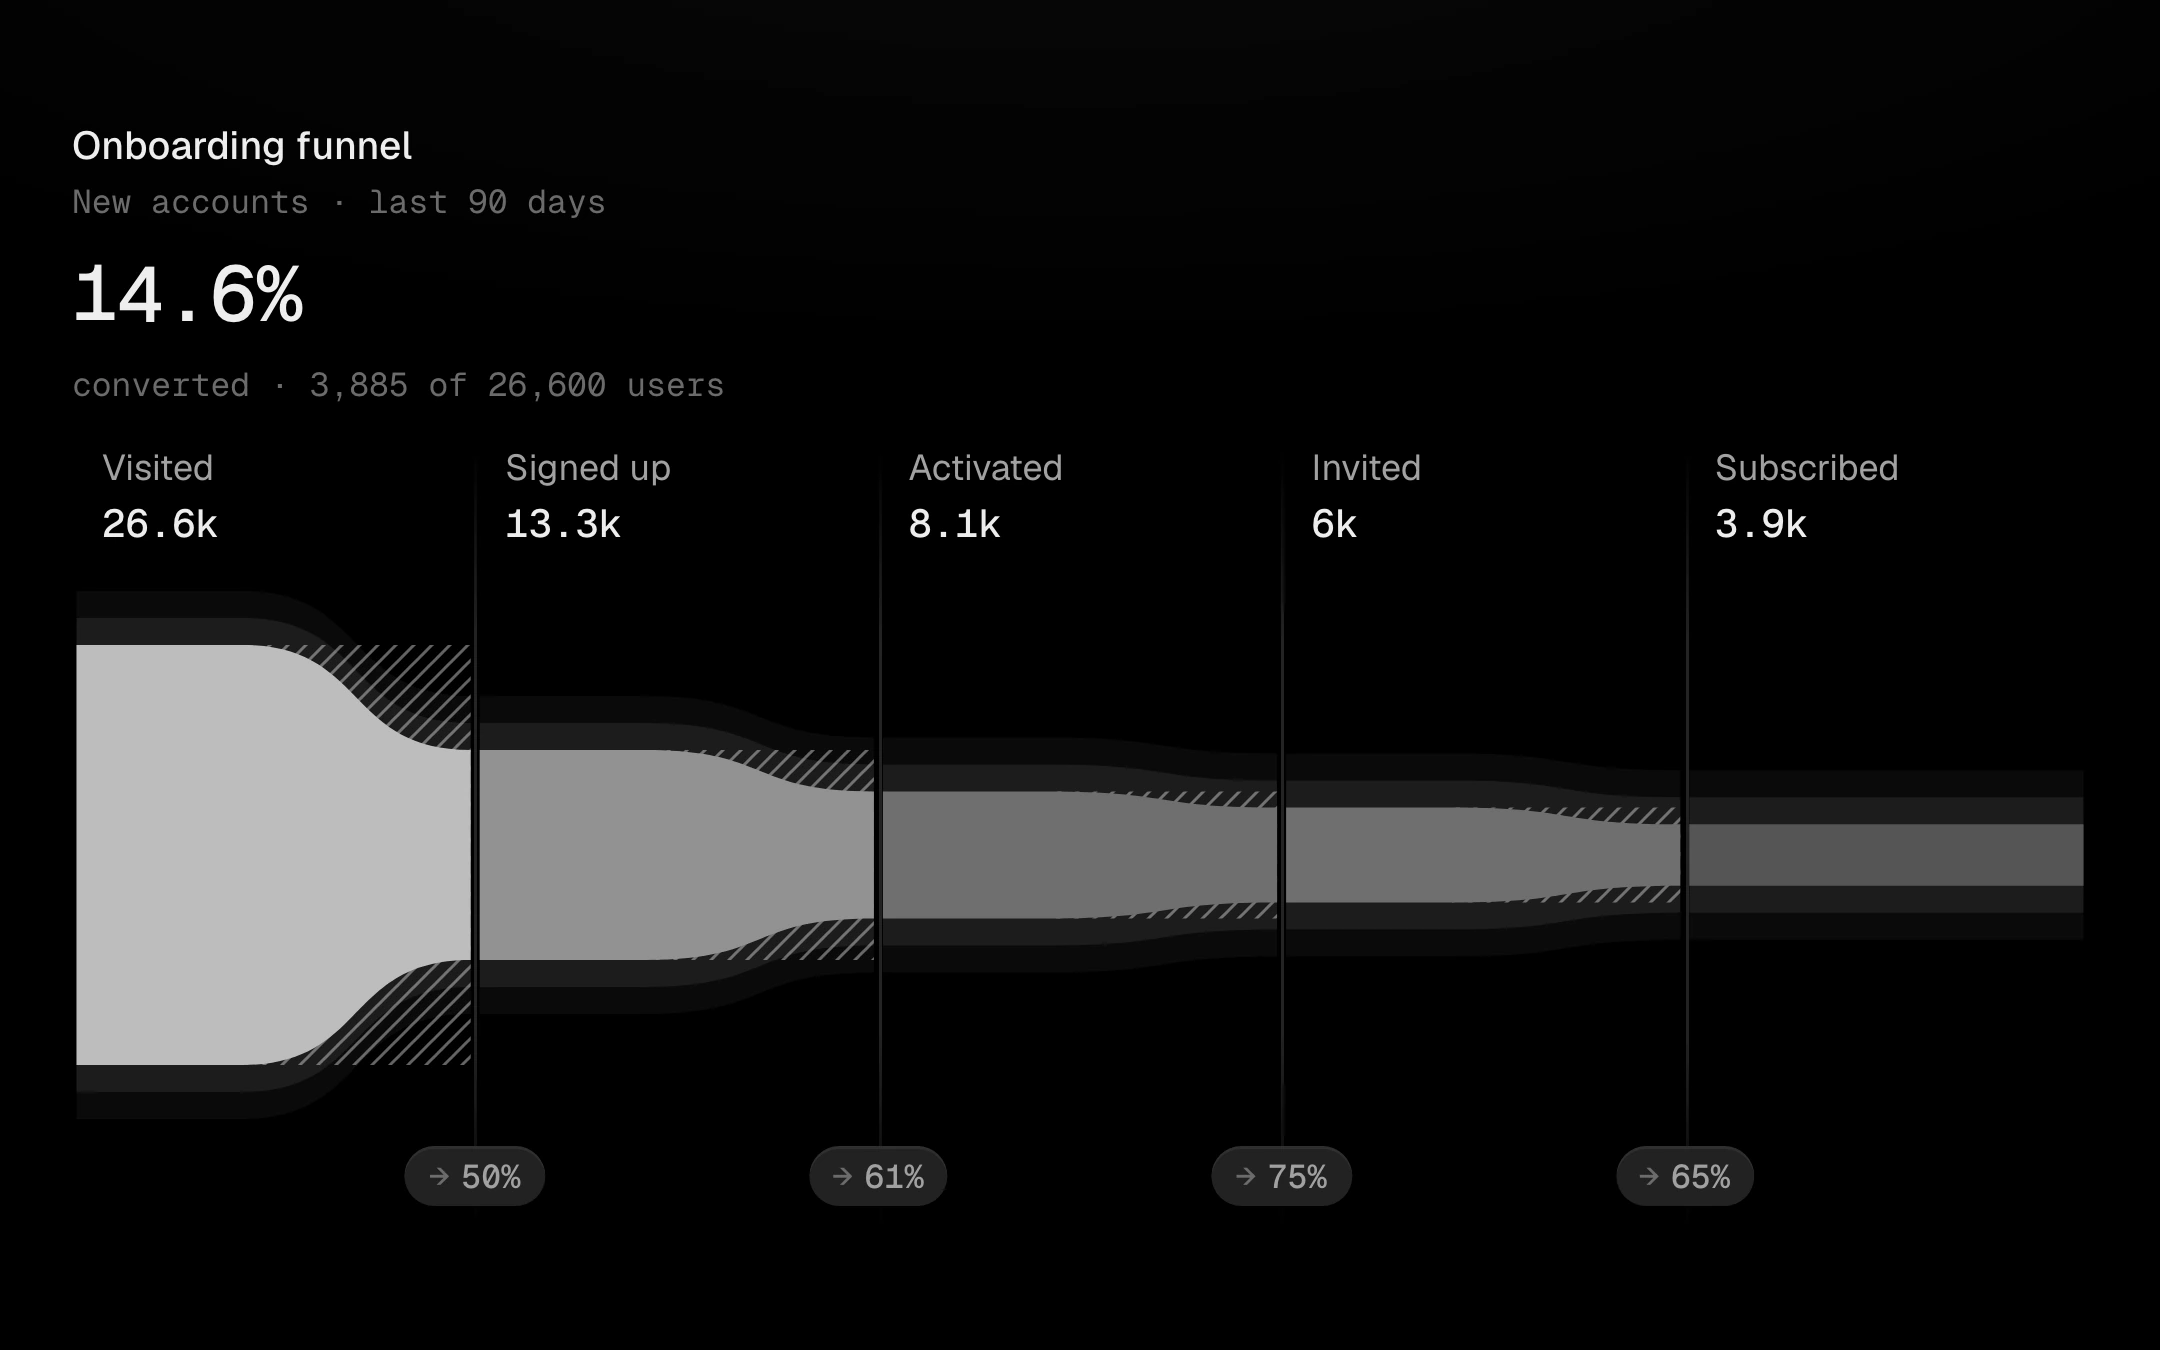
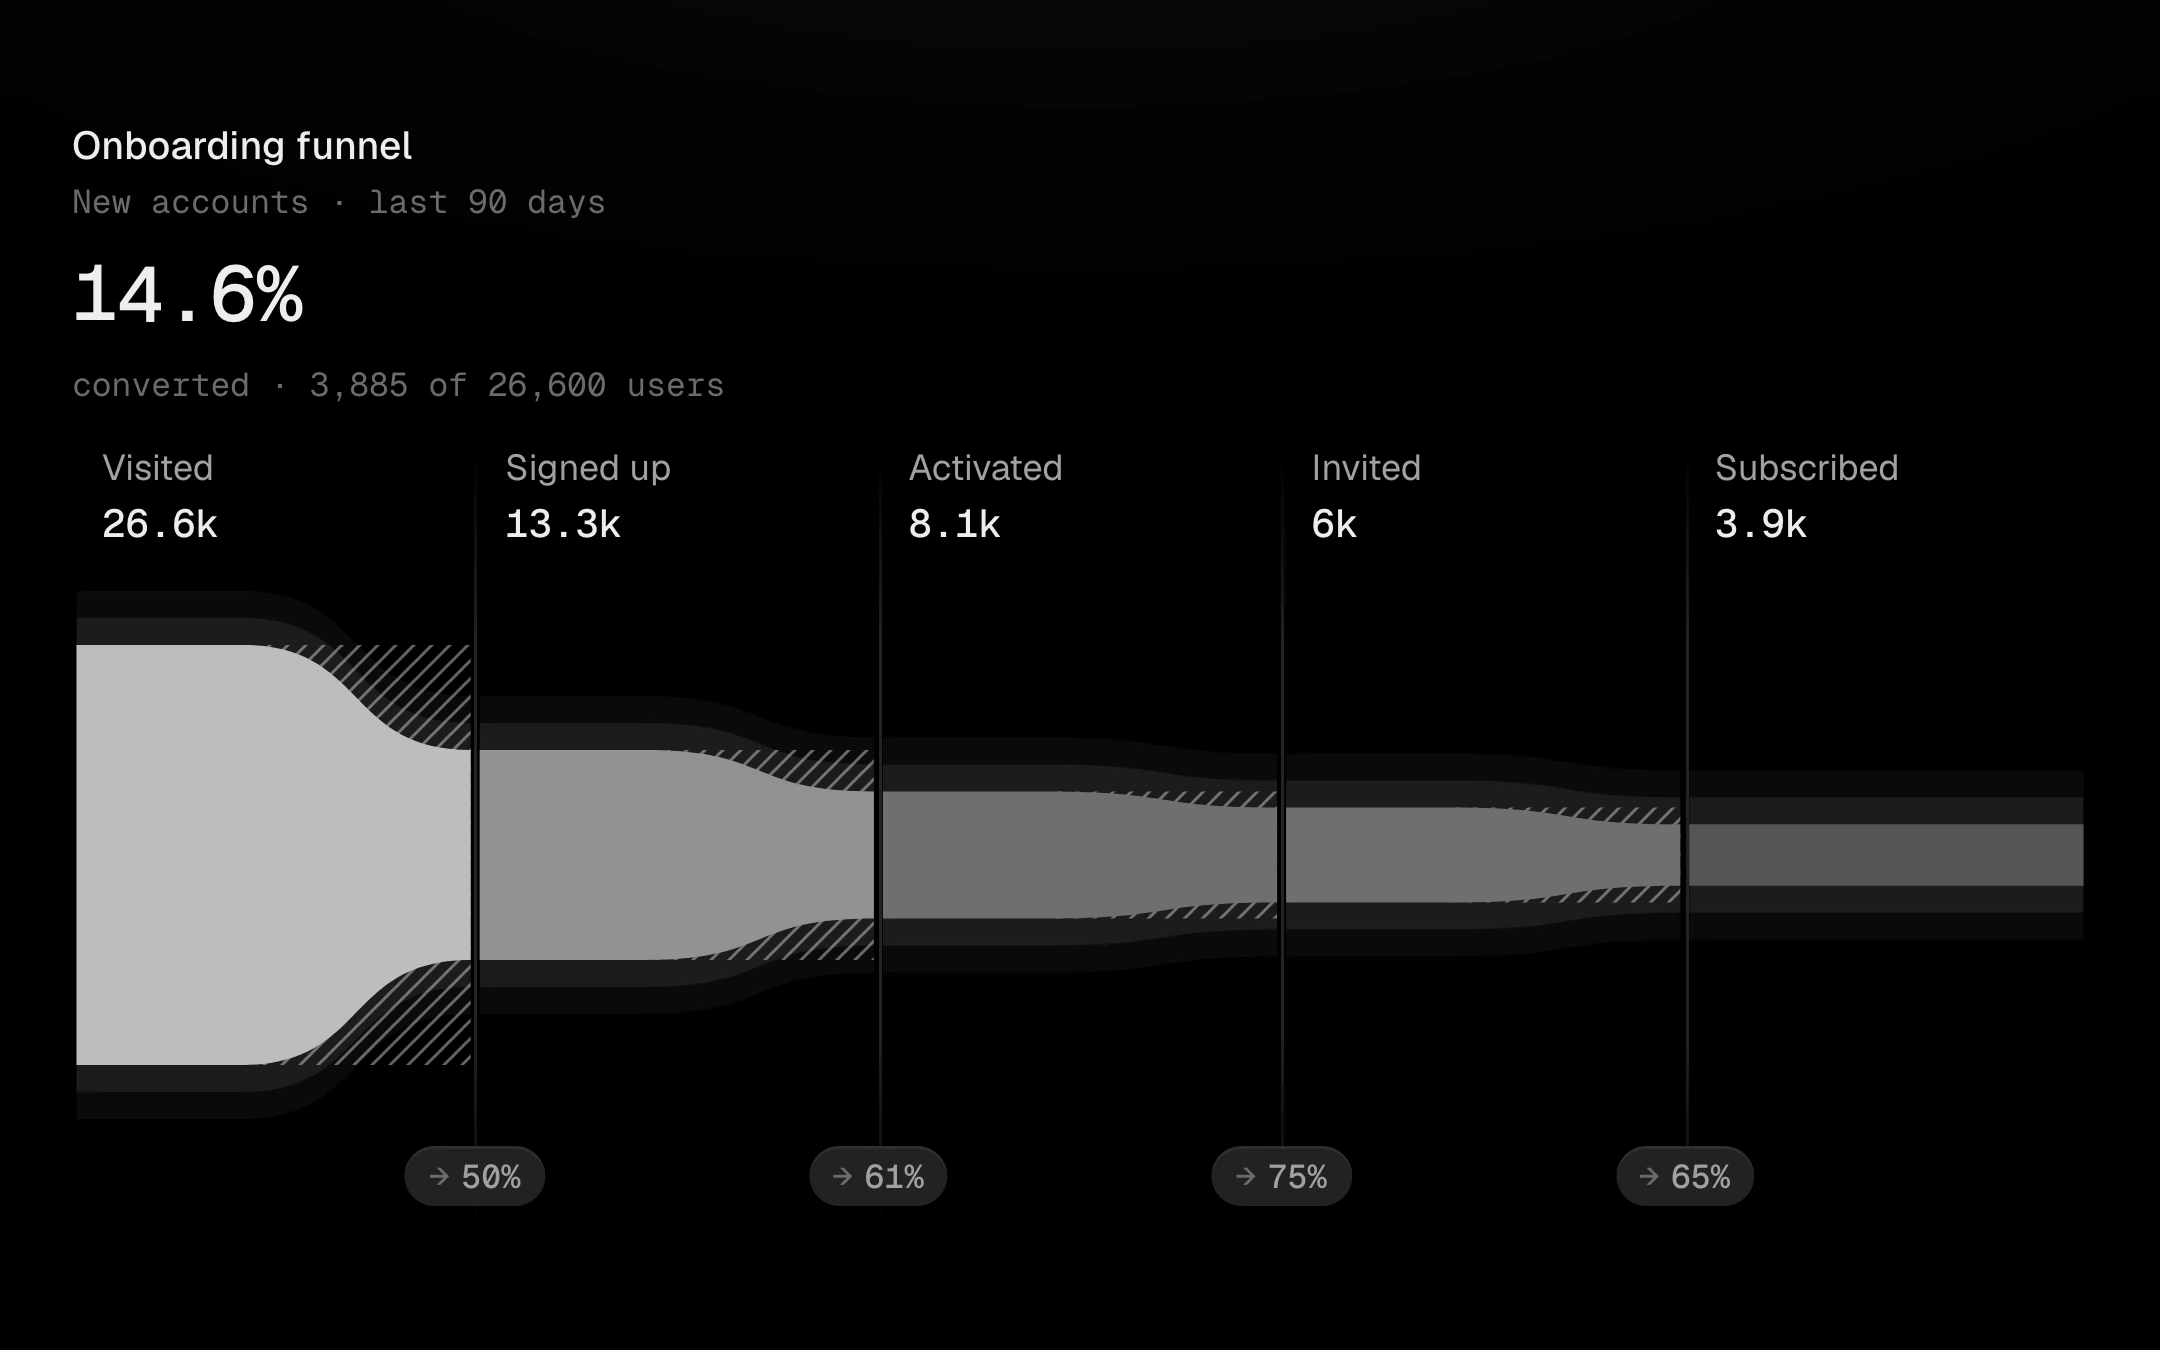
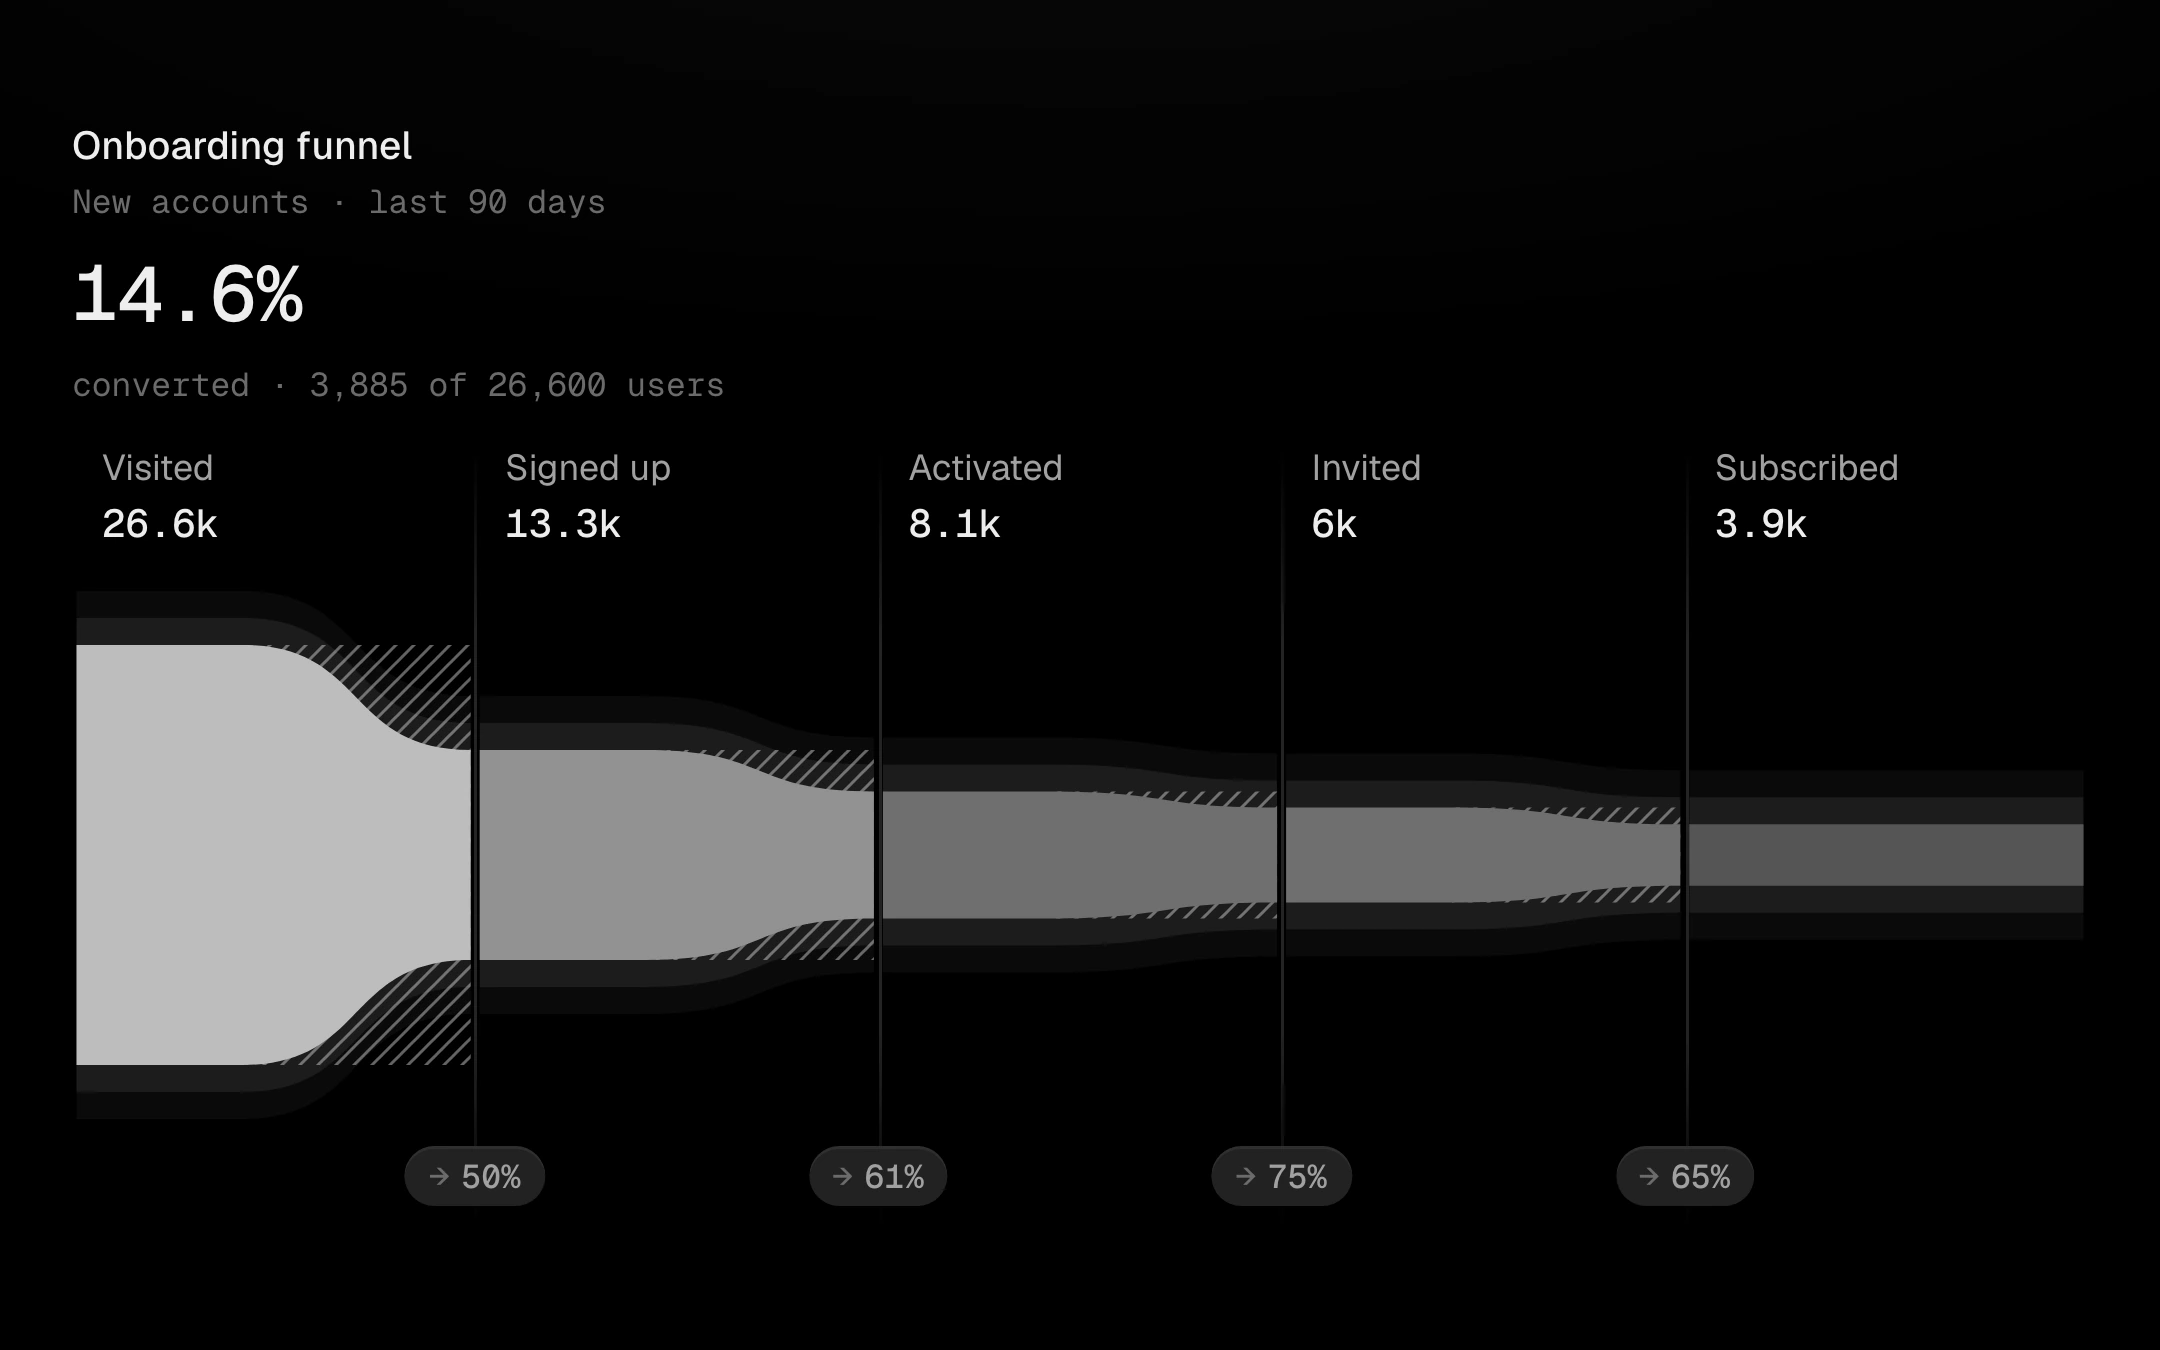
Stages as one stream that narrows from step to step.
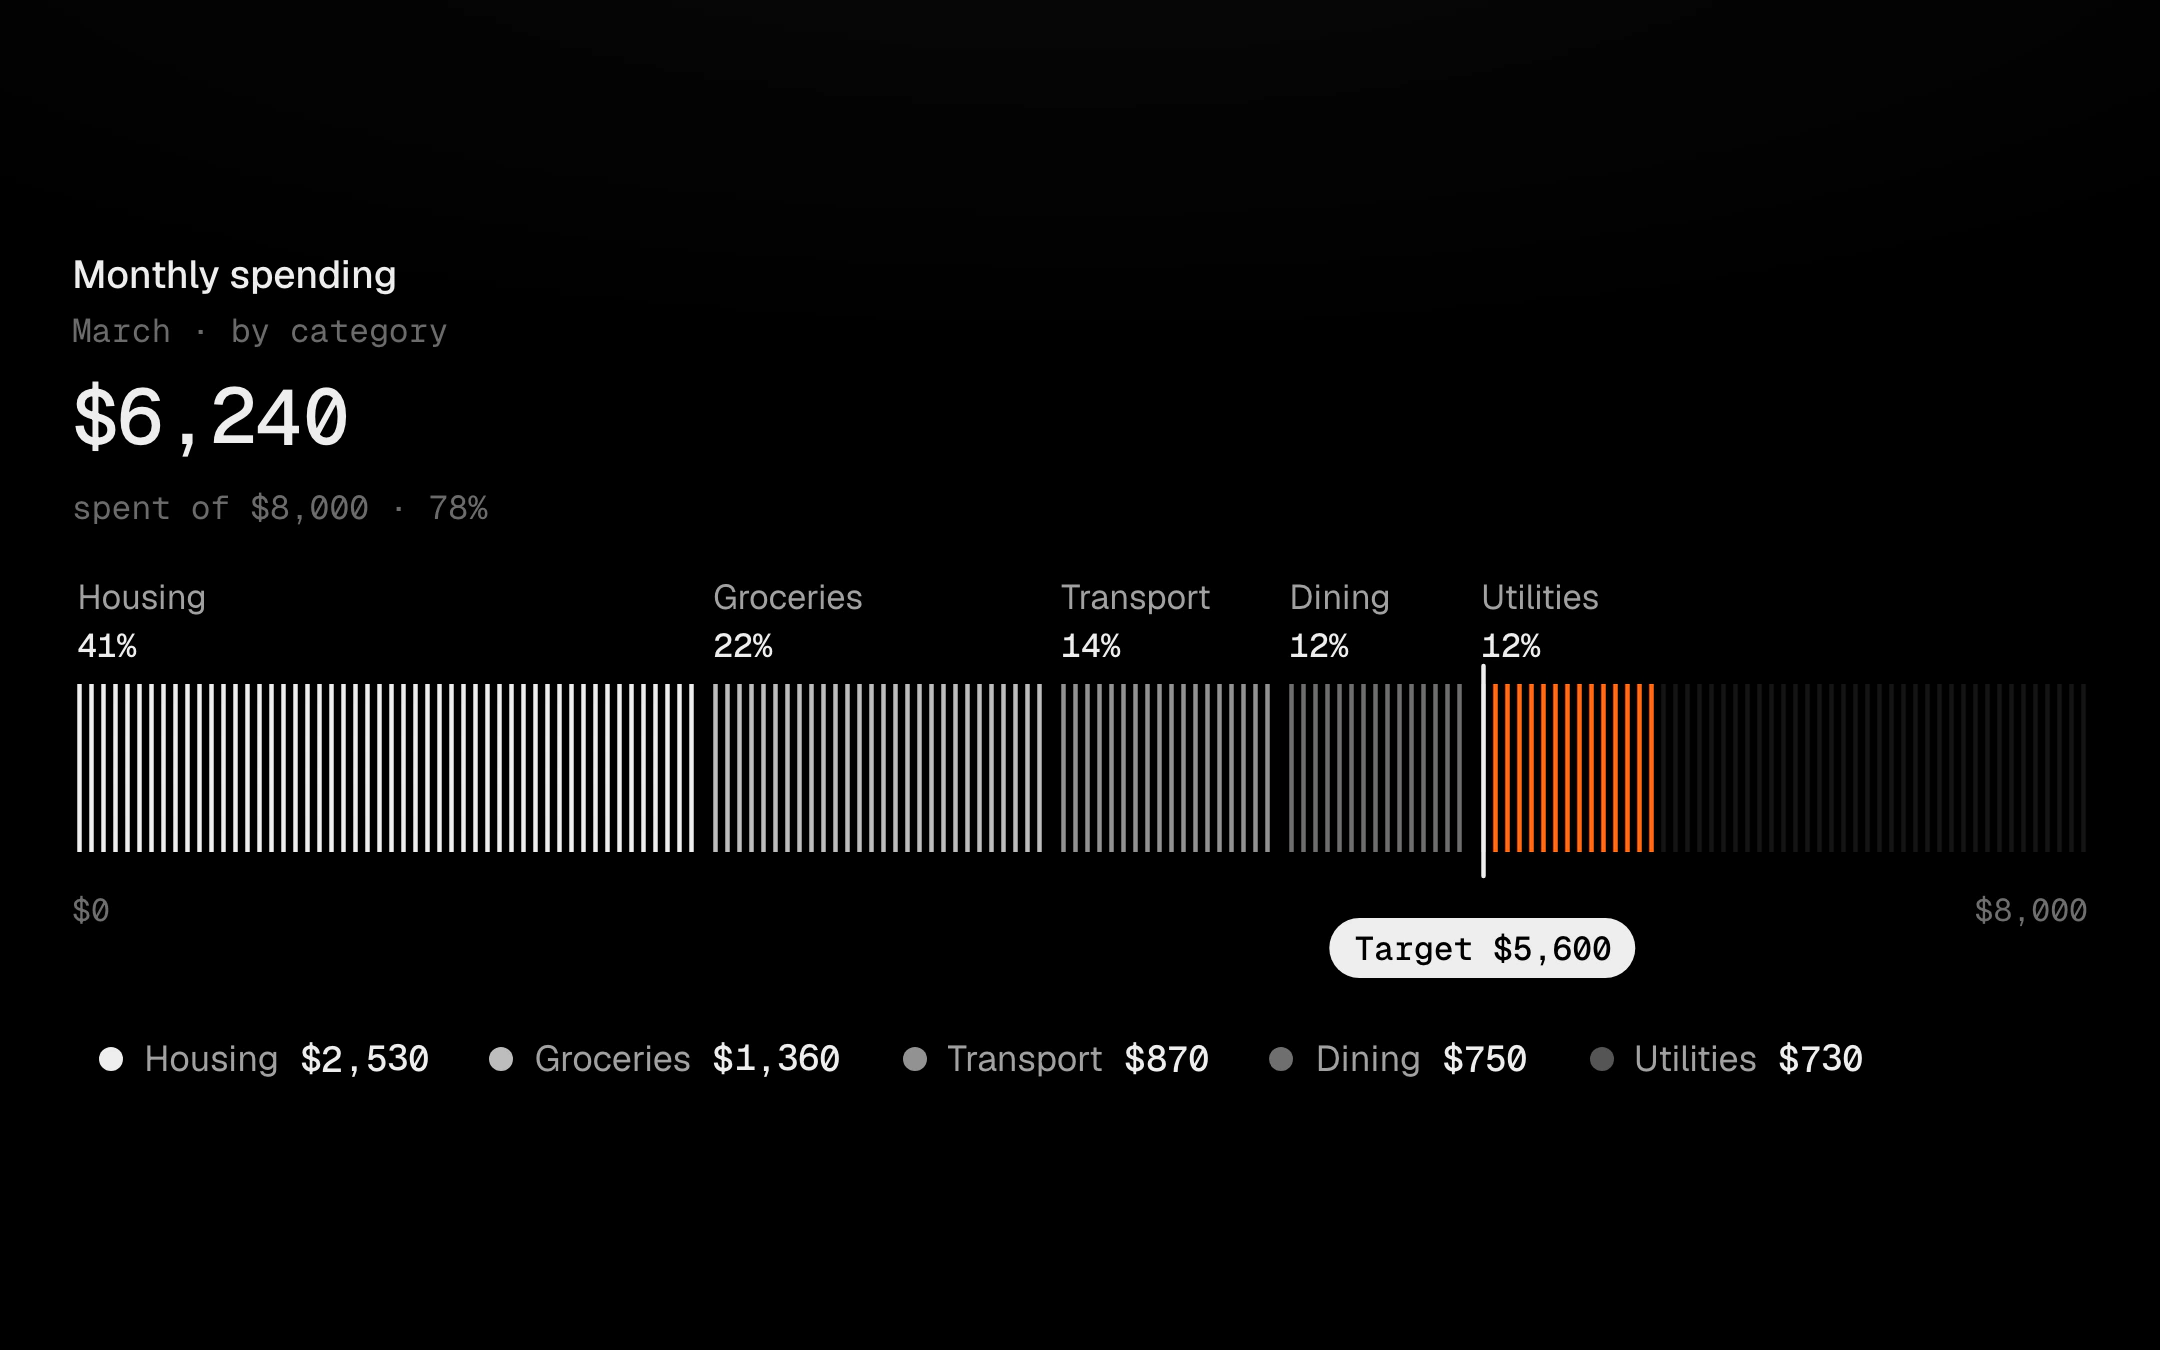
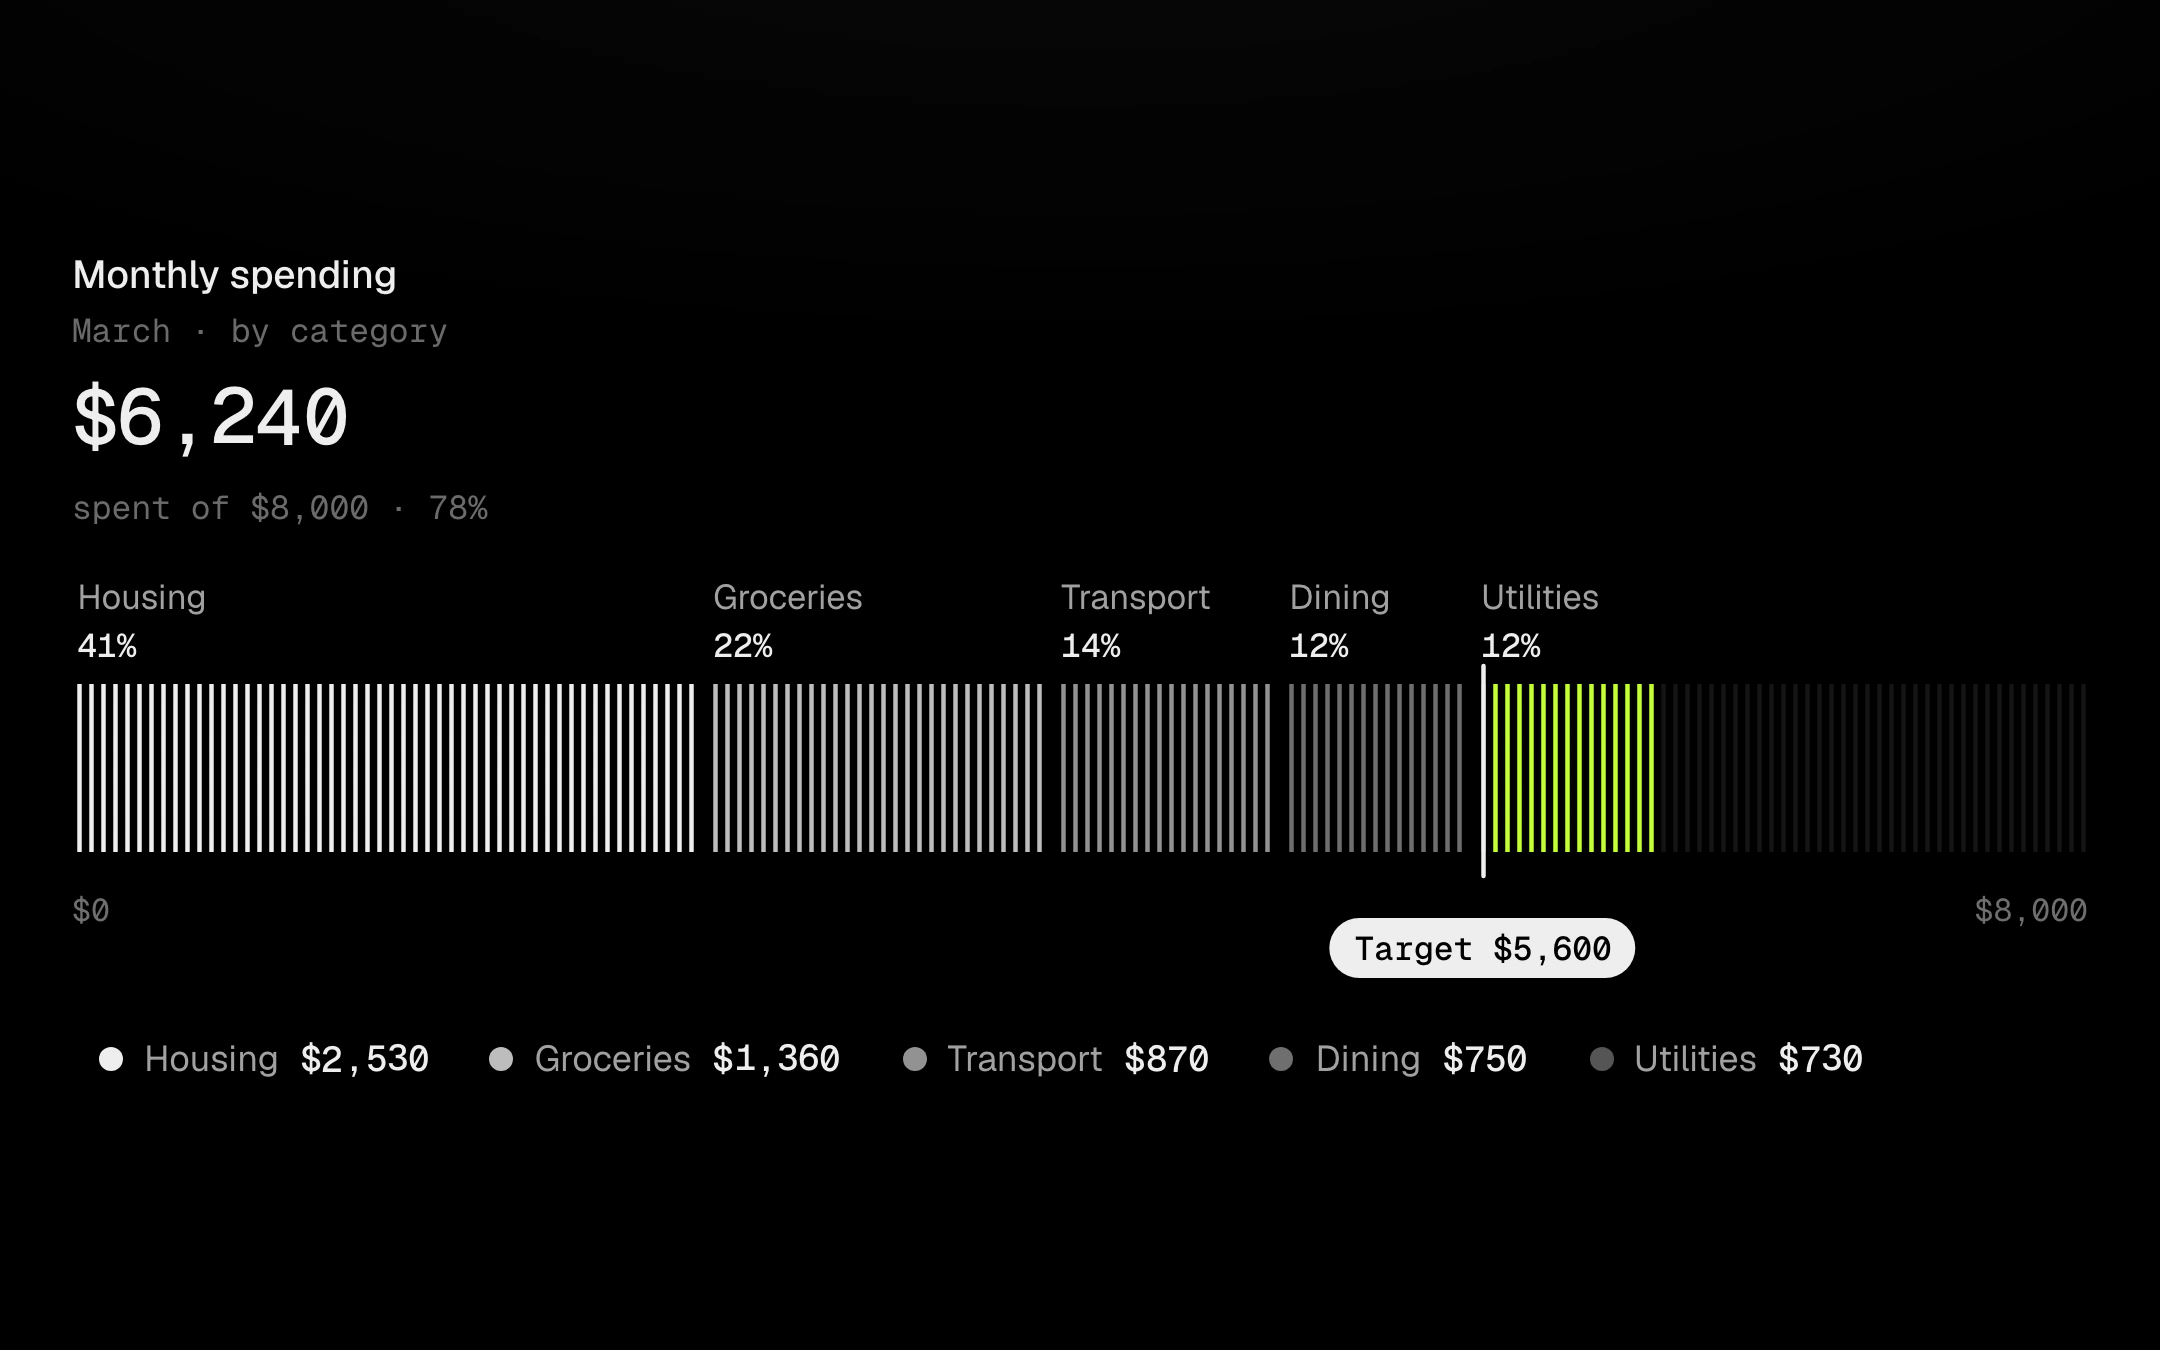
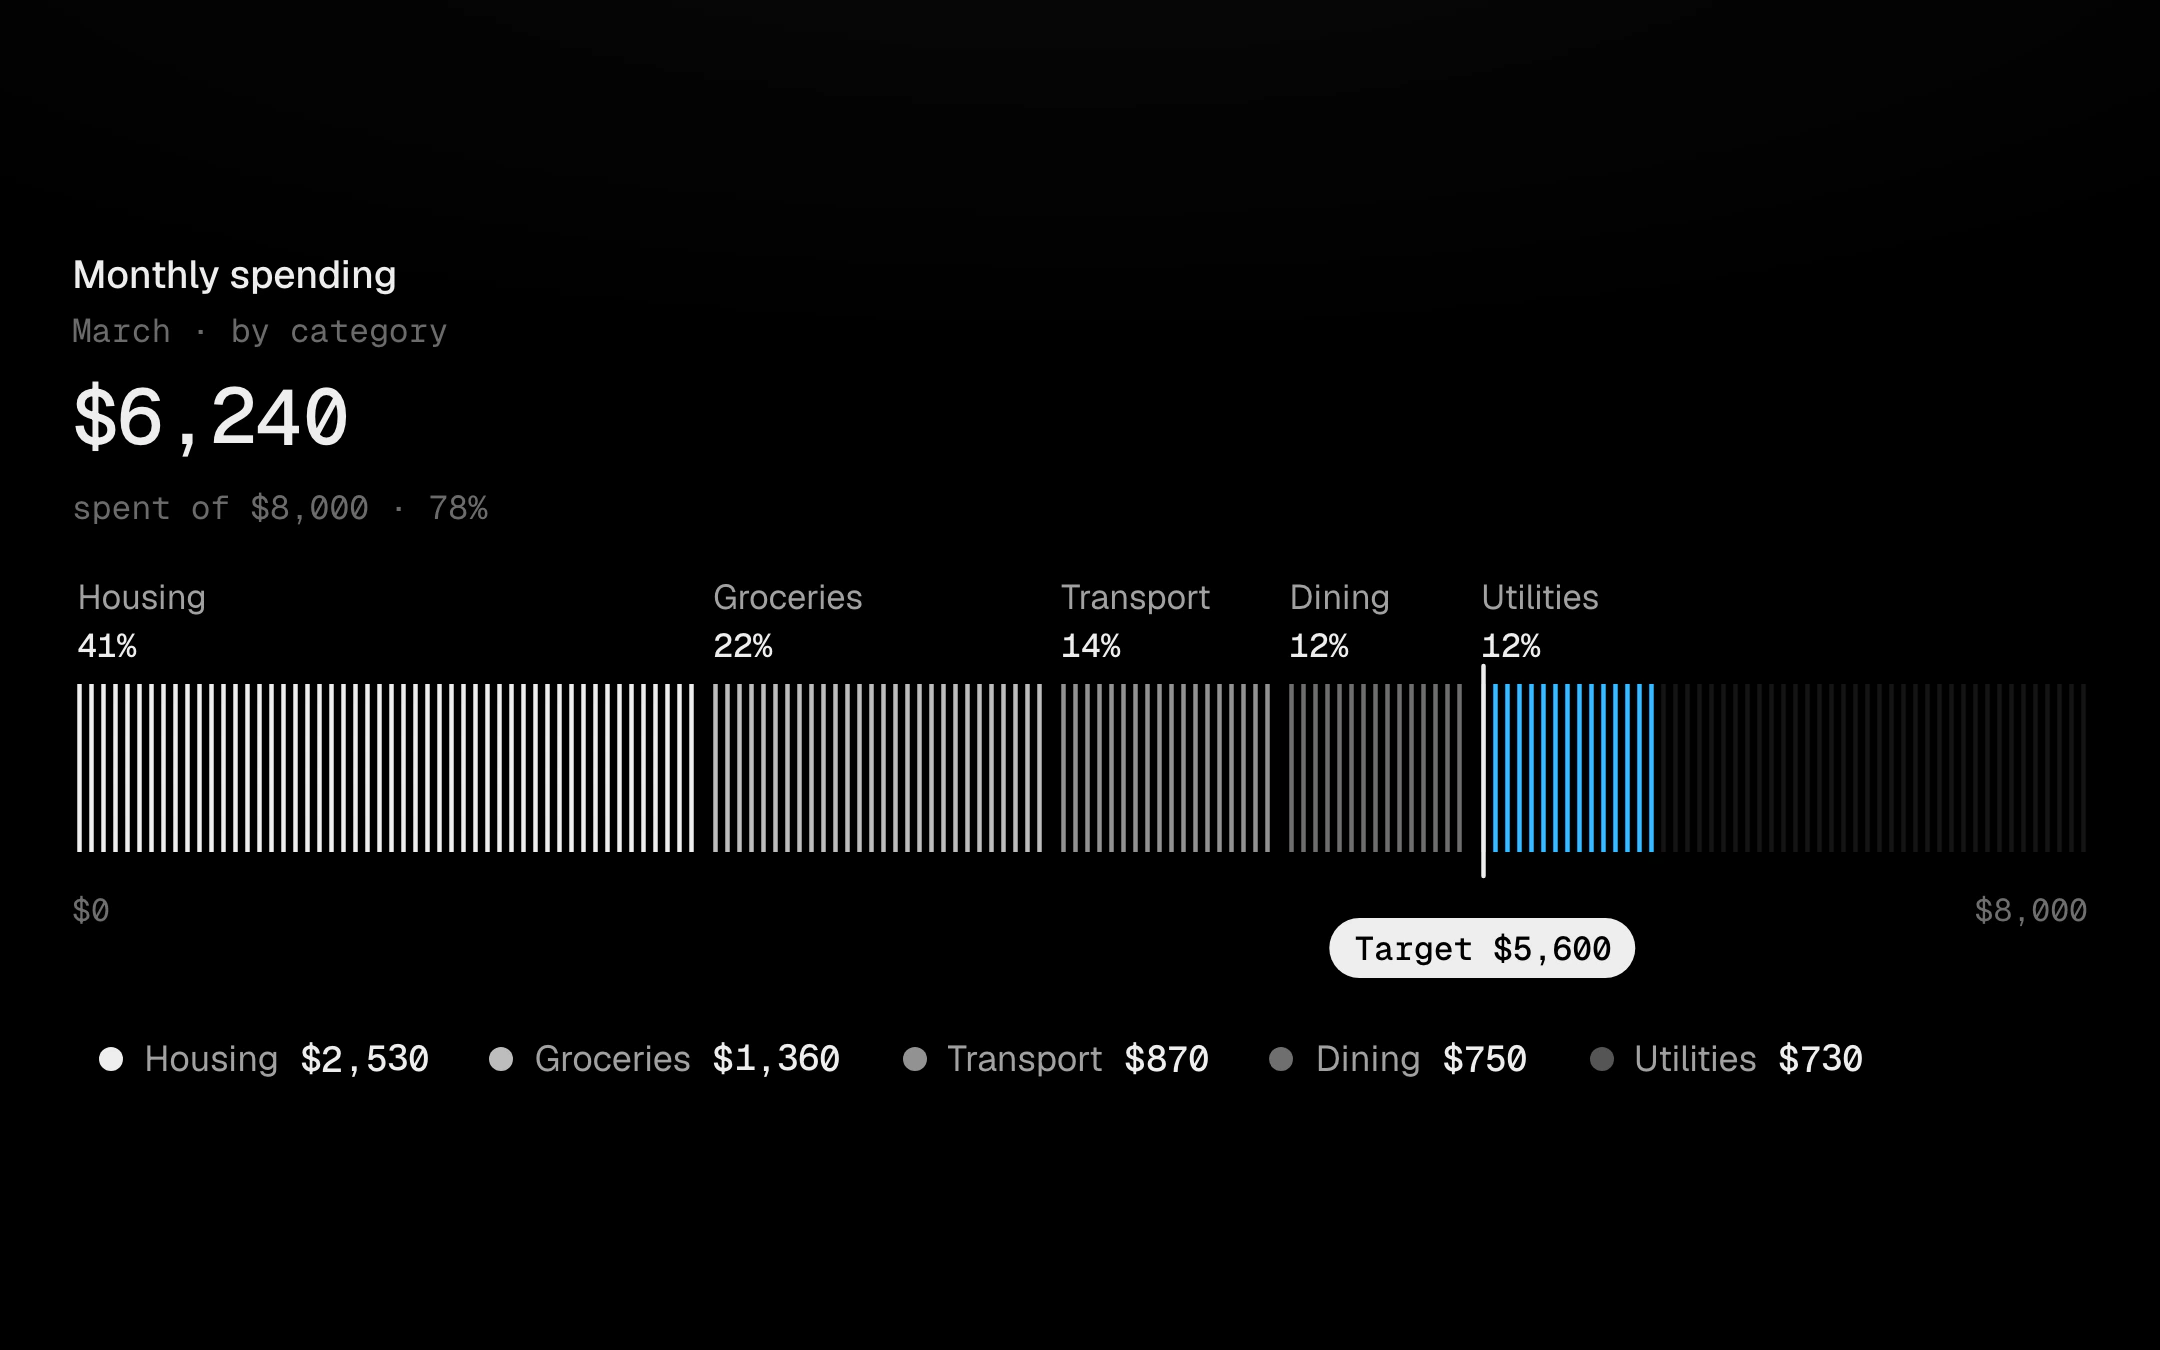
A category breakdown drawn as a stacked progress bar of hairlines.
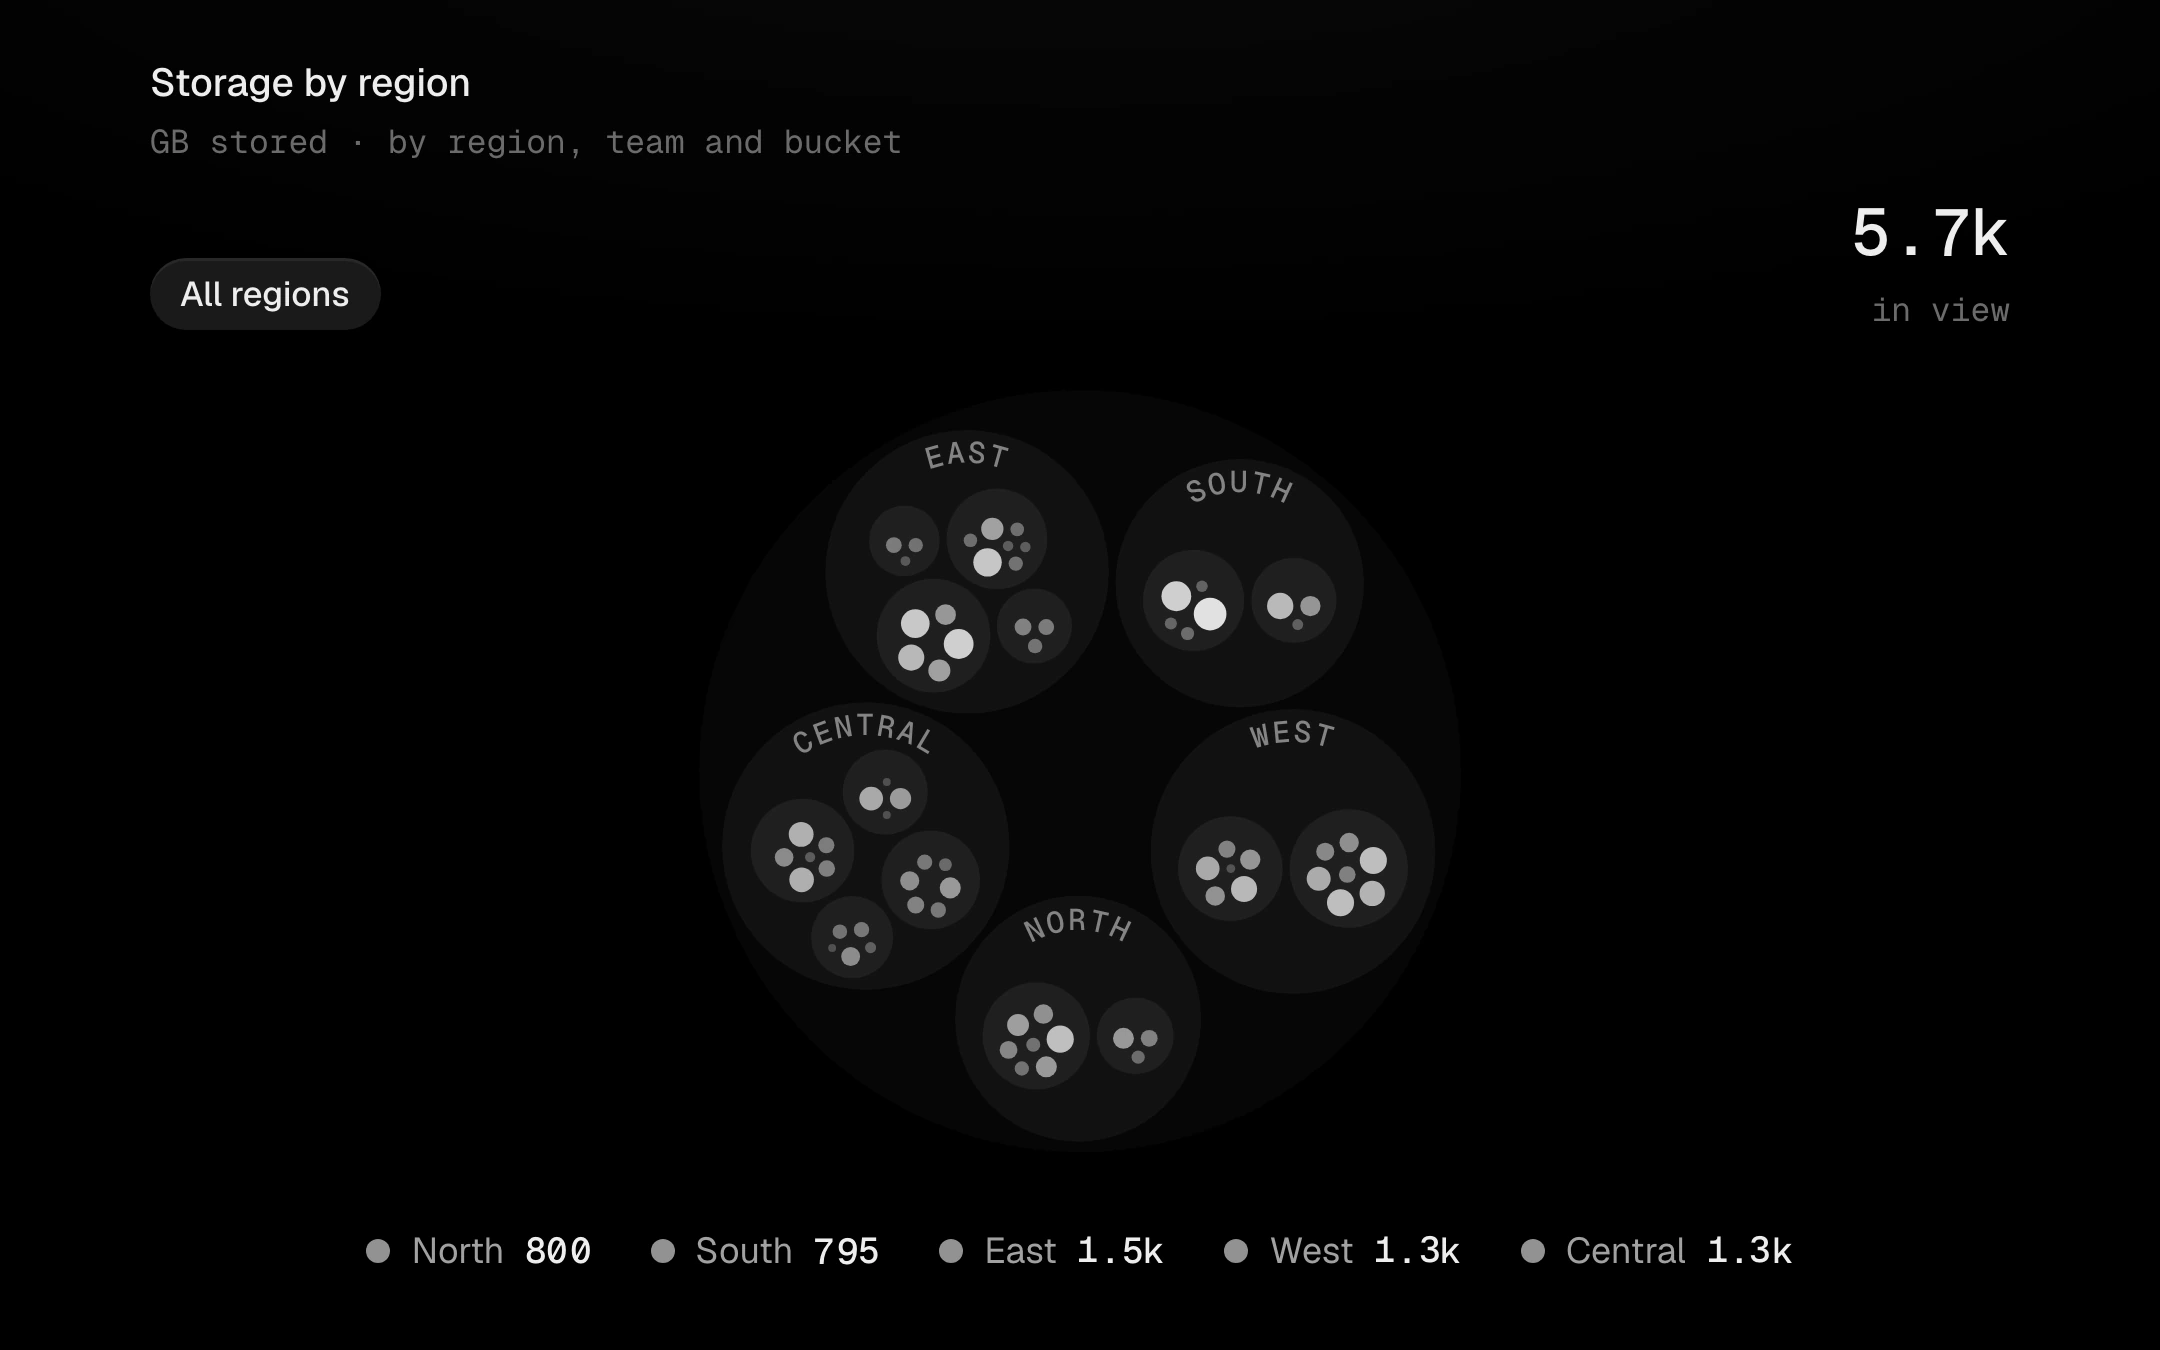
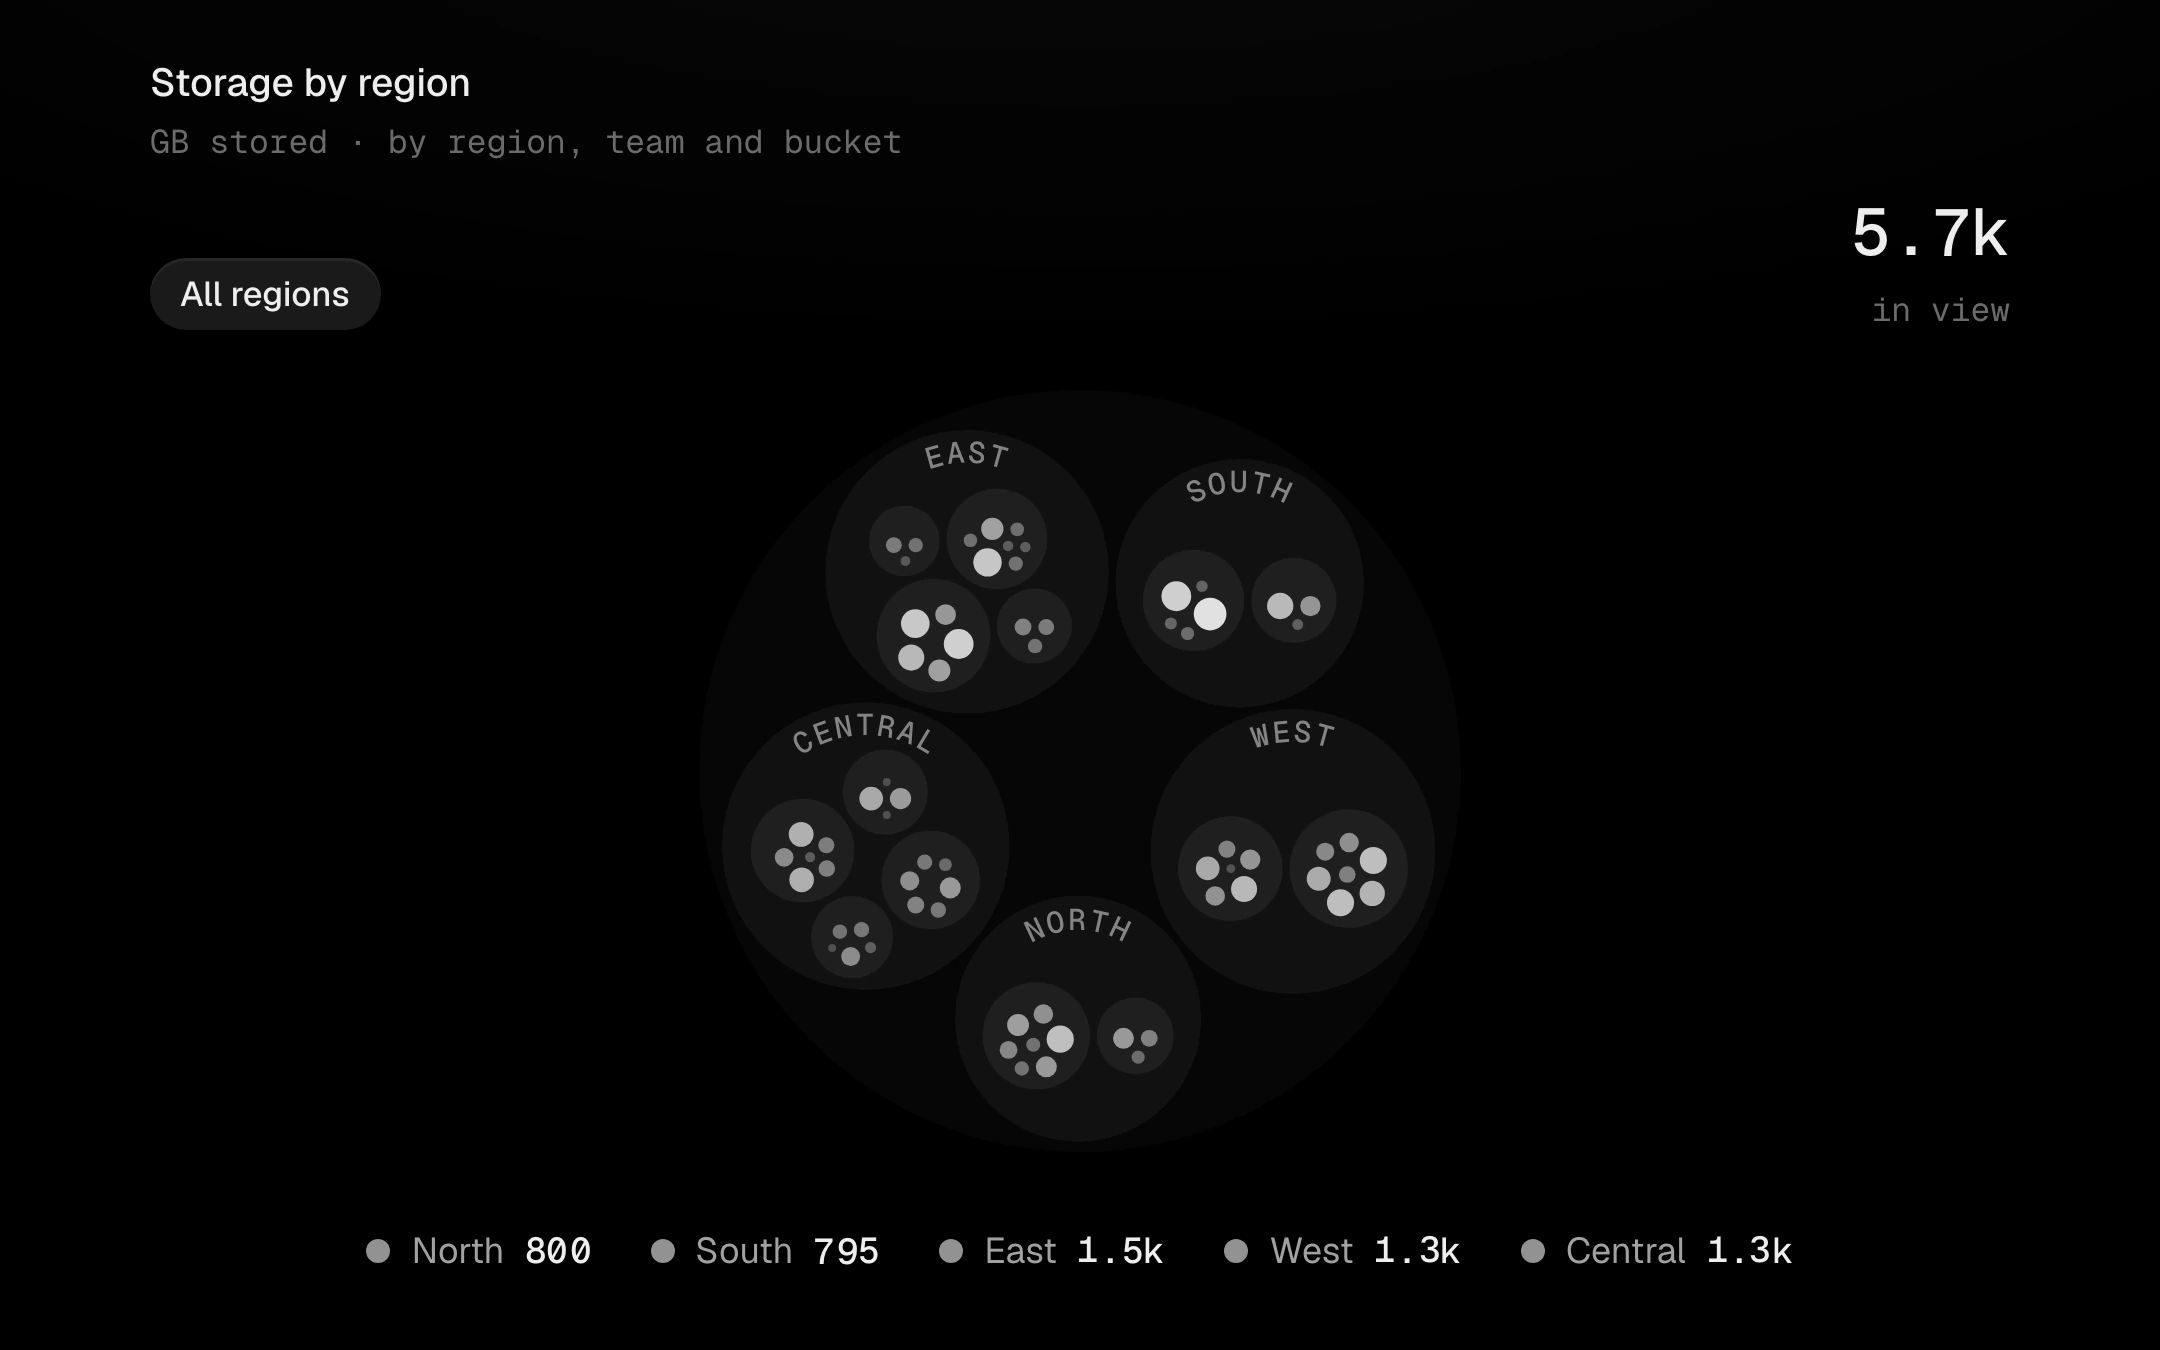
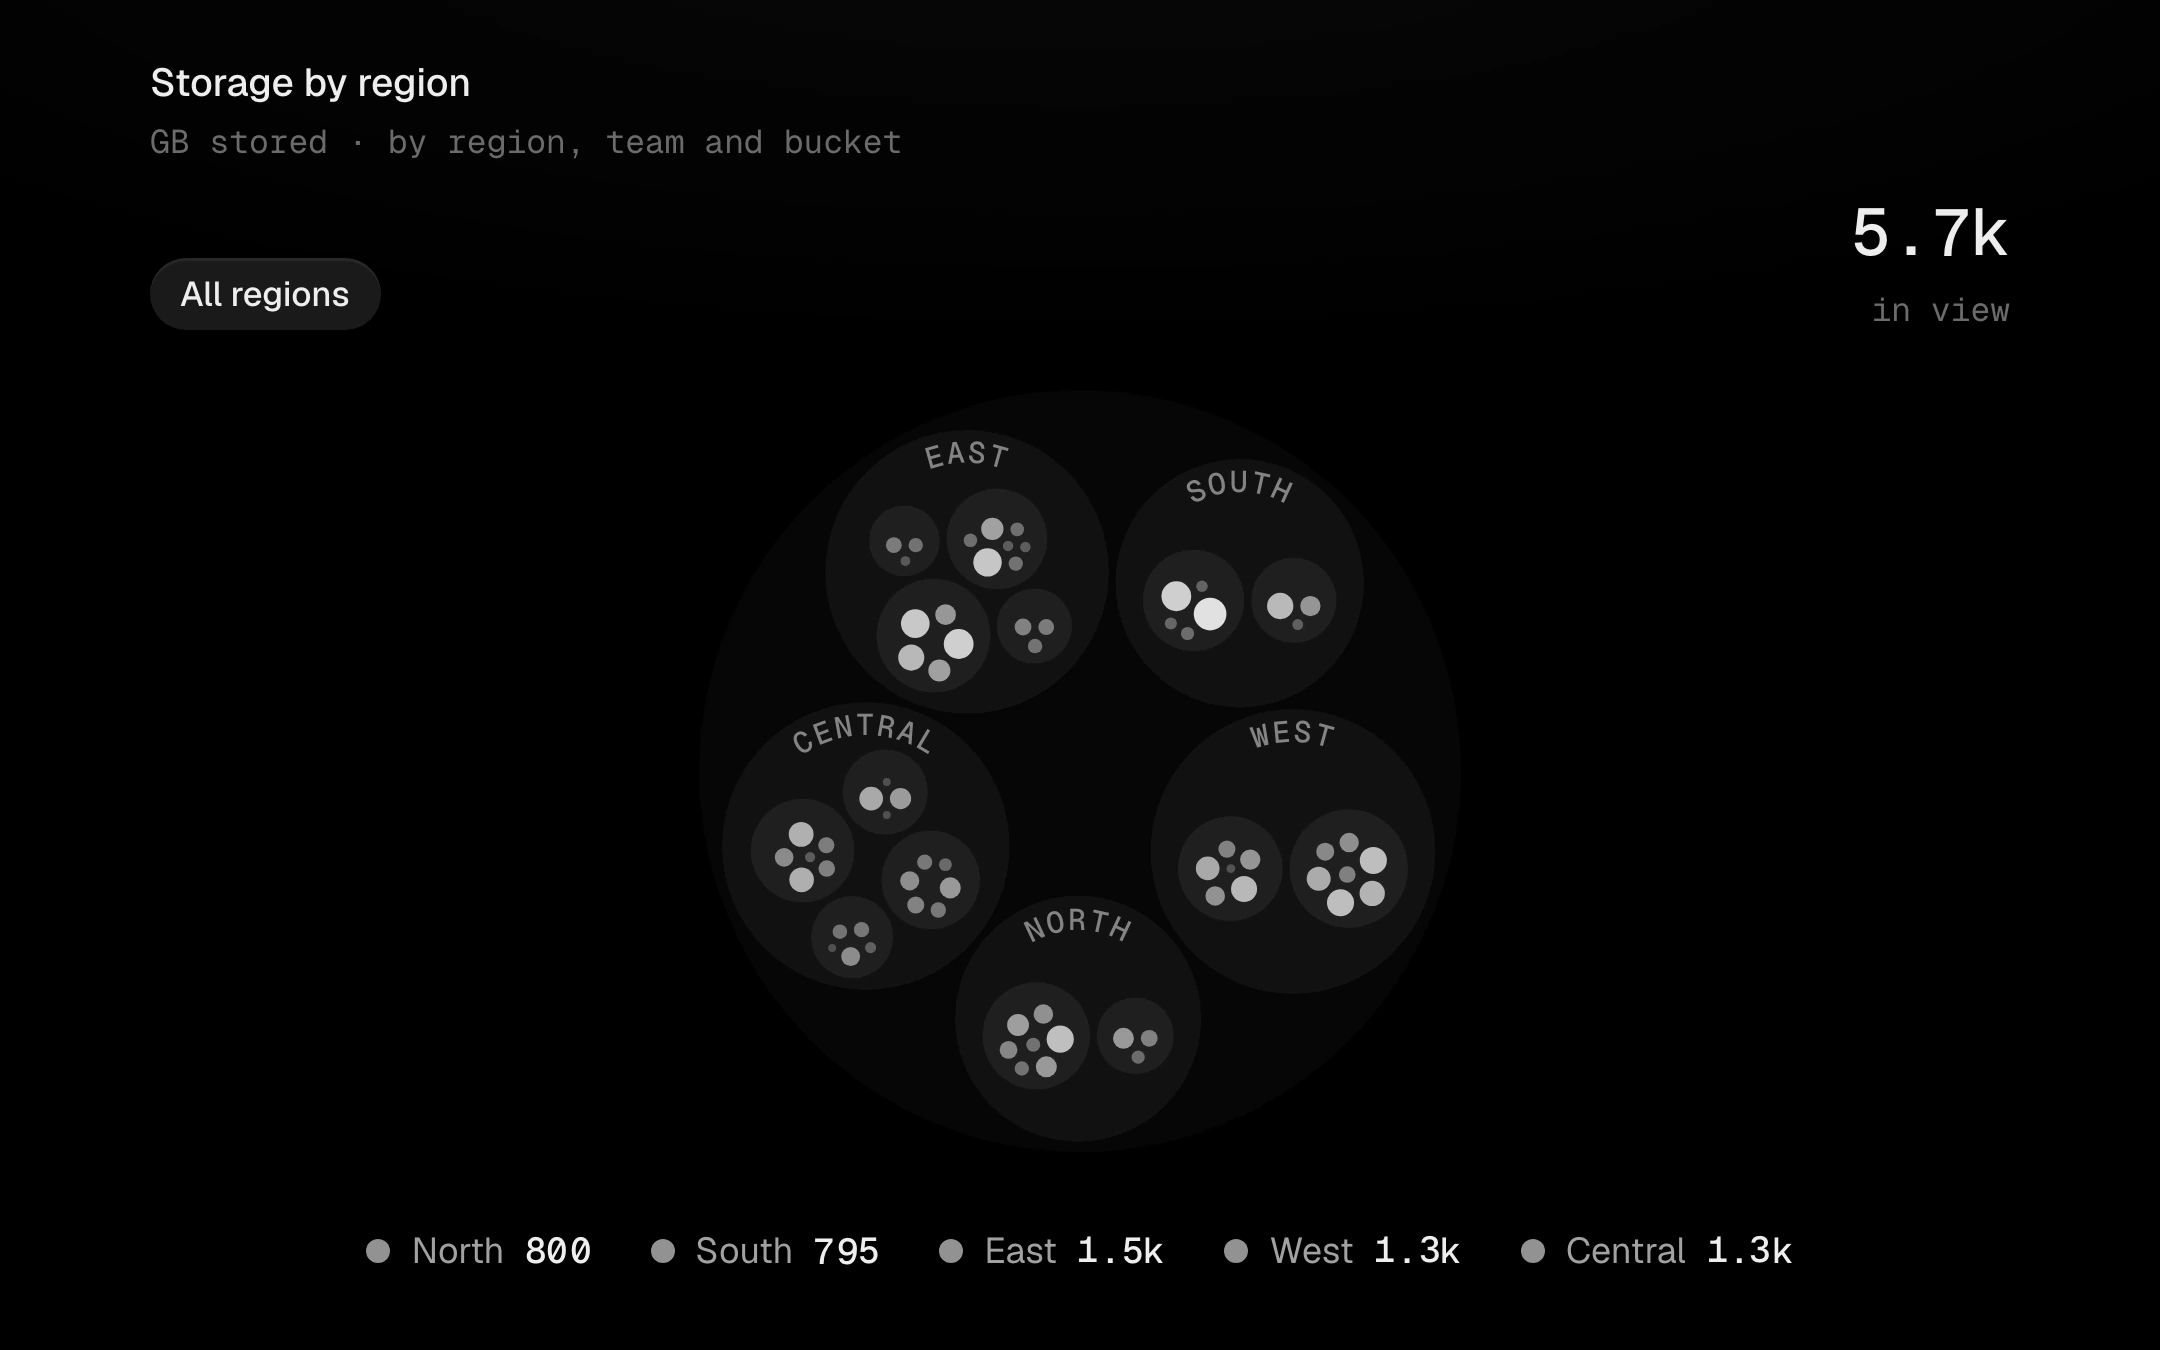
A hierarchy as nested circles, packed tight with an even gap between siblings and a clear inset inside each parent.
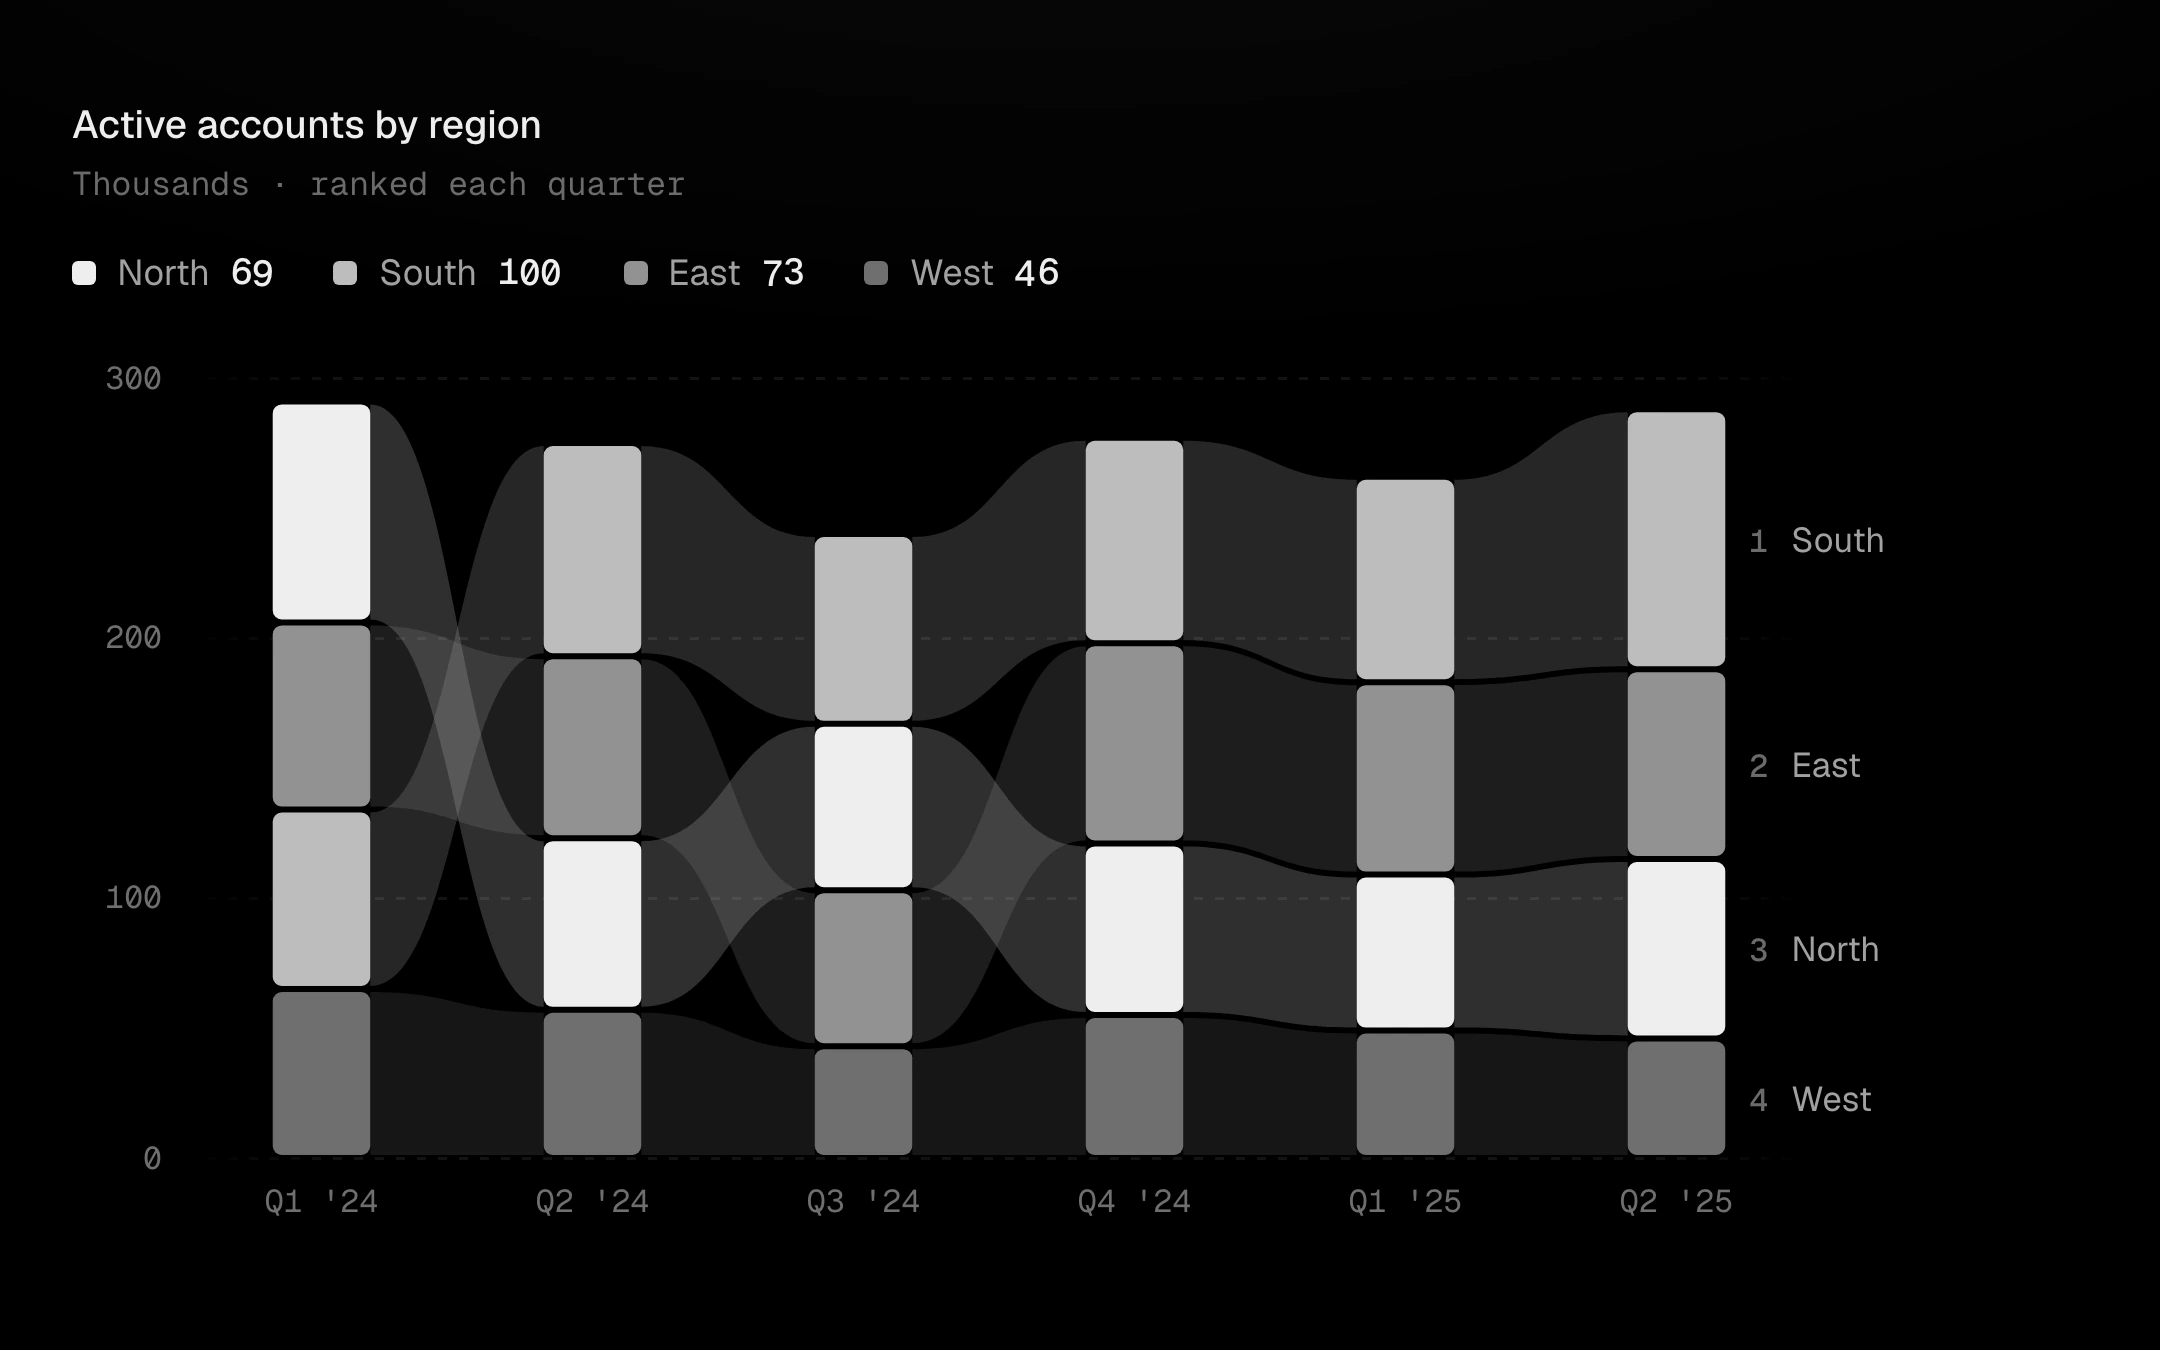
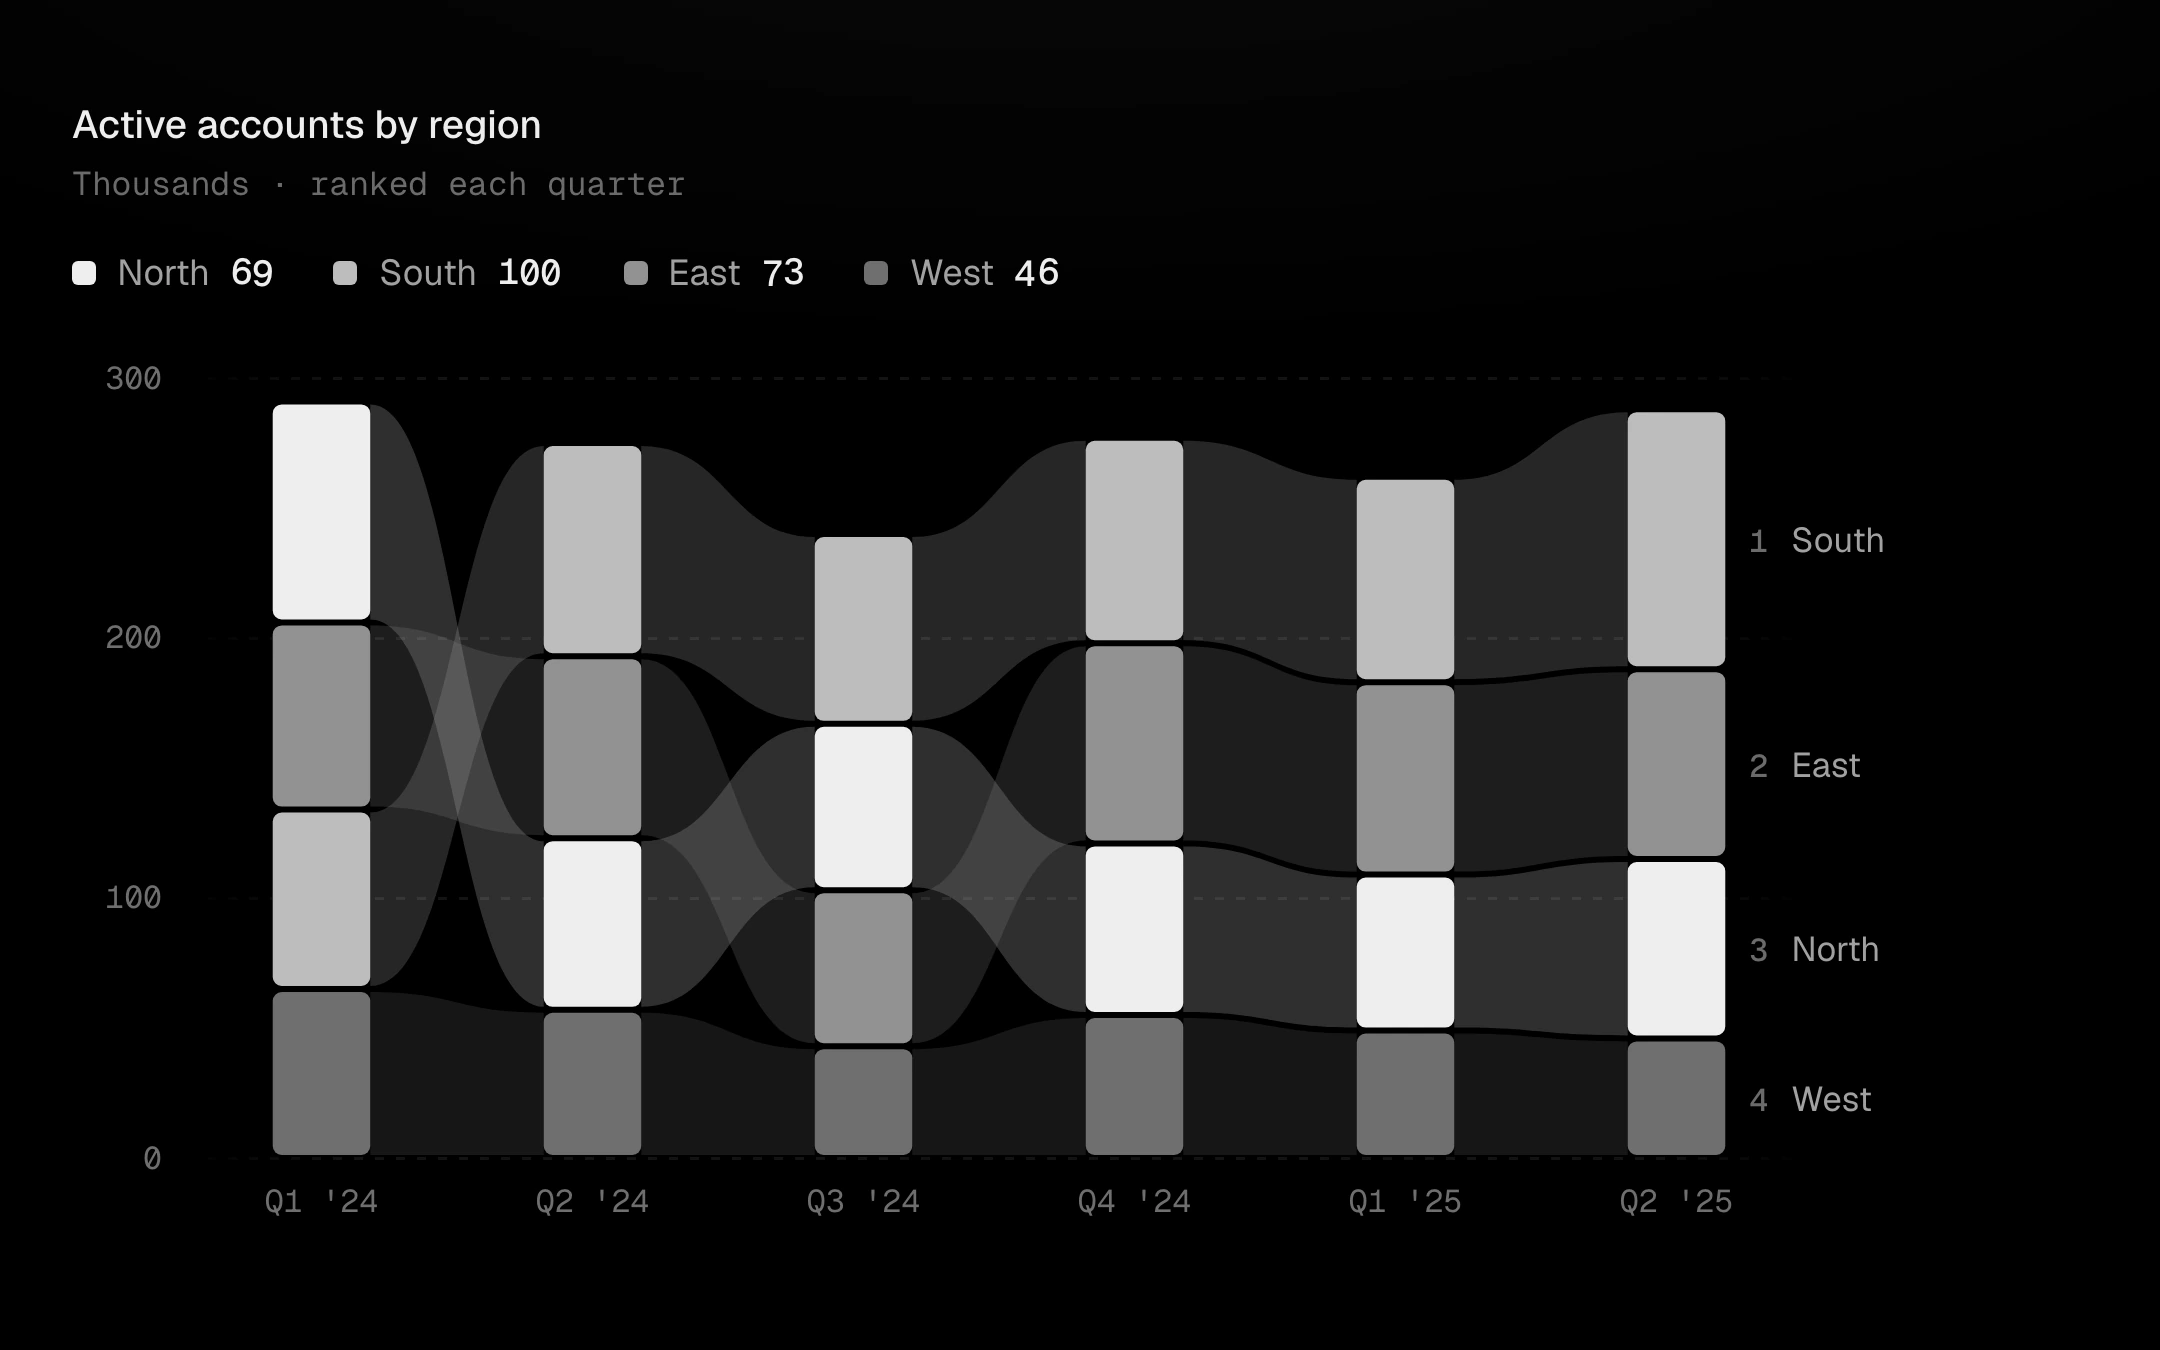
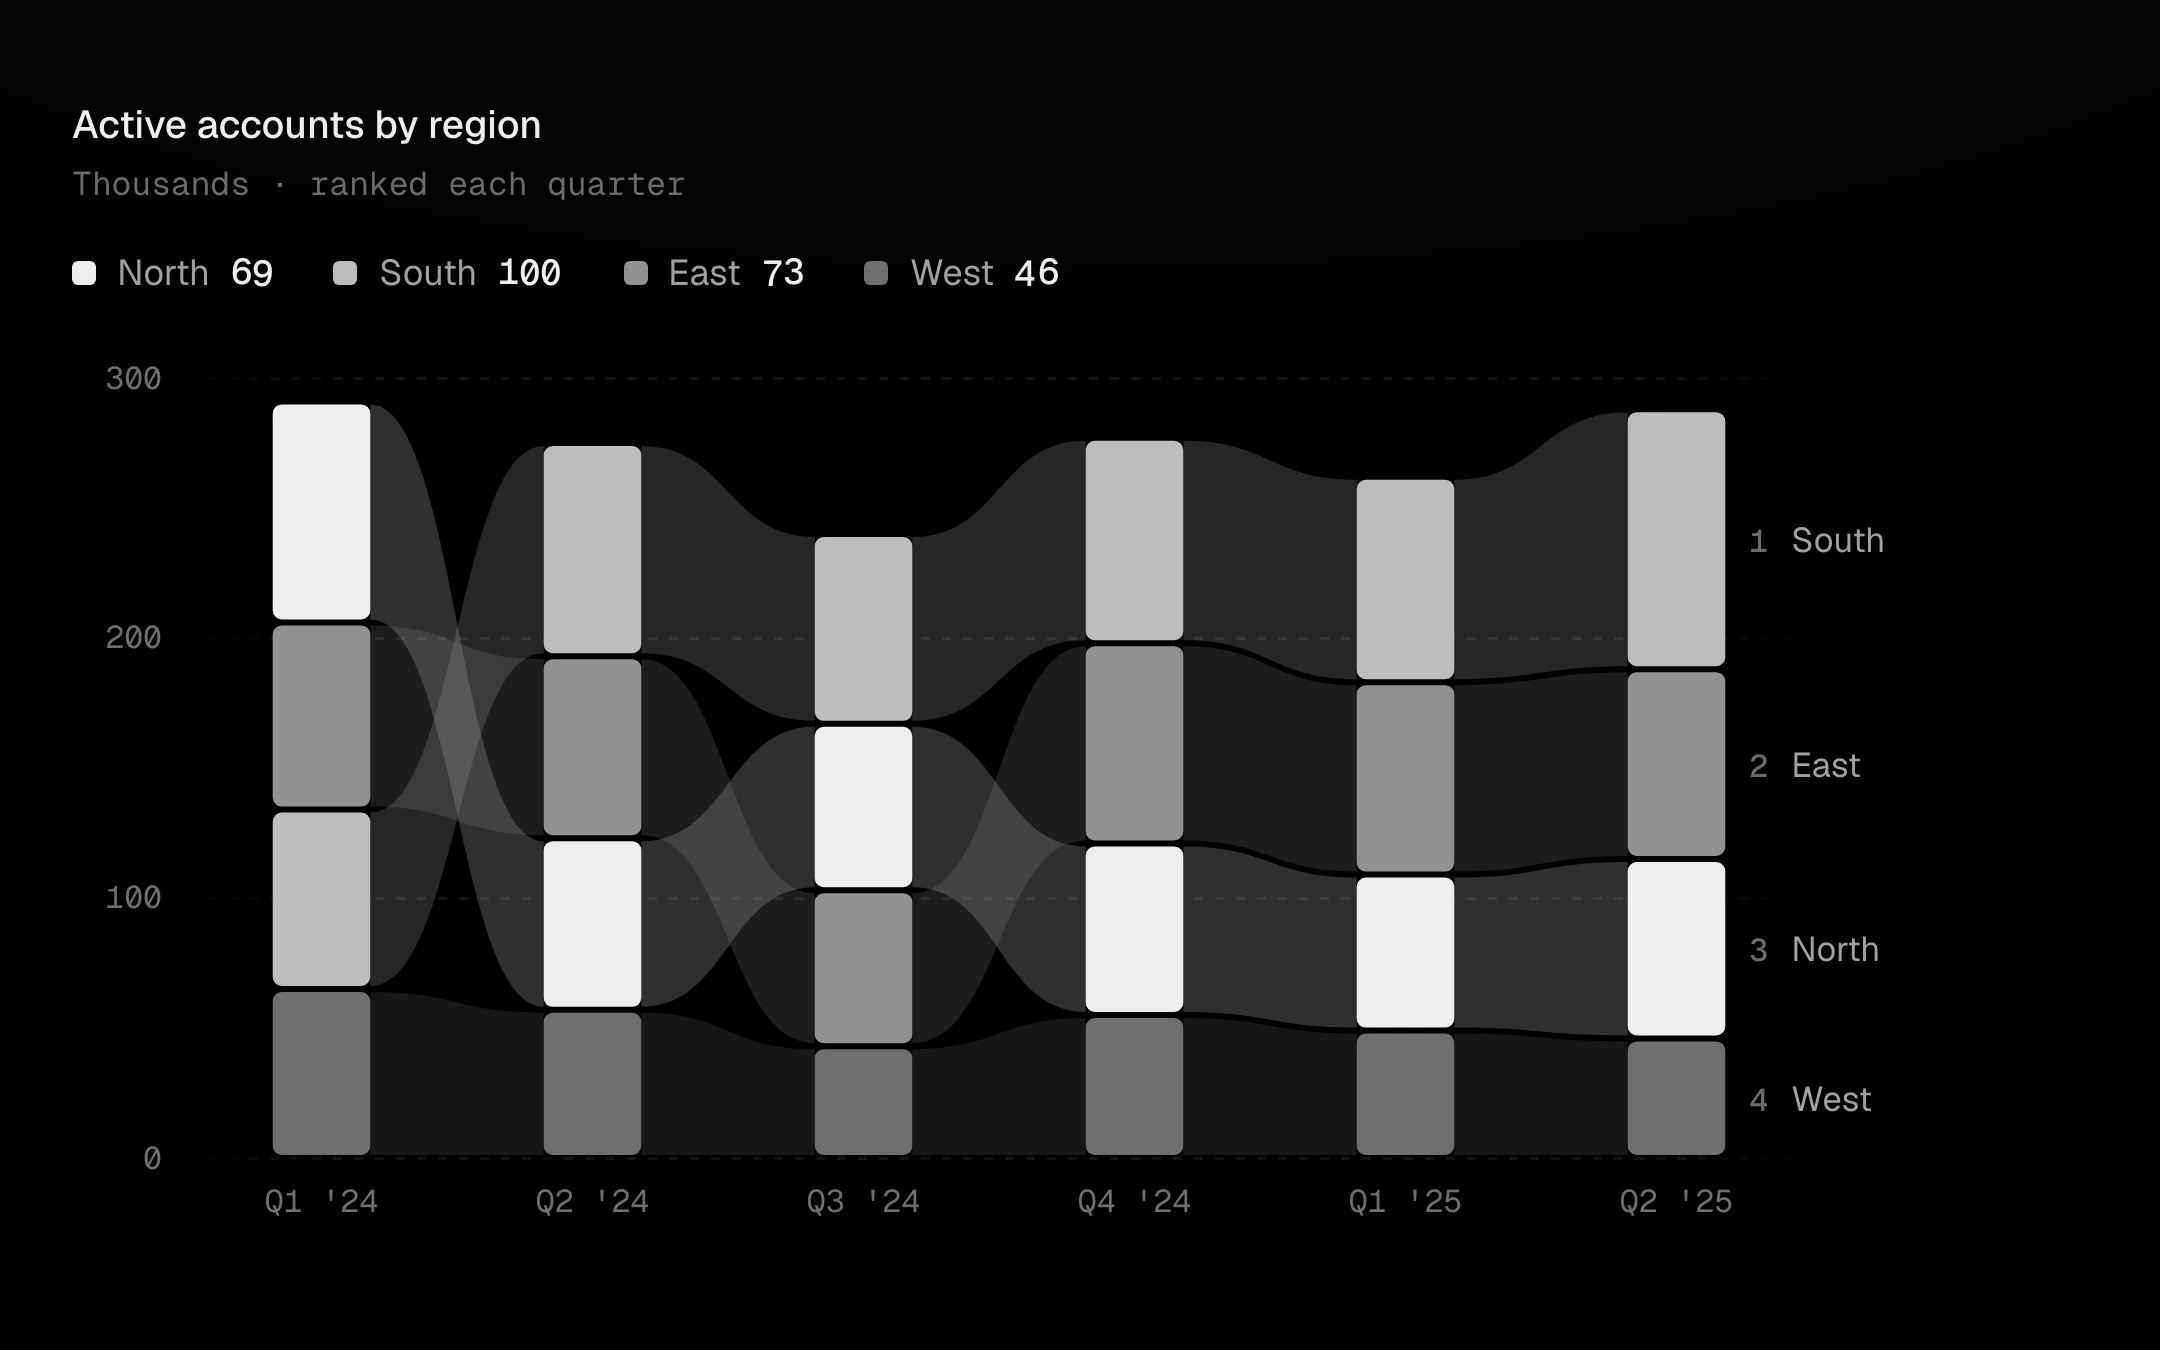
Stacked bars per period, re-ranked every period with the leader on top, joined by flowing ribbons that carry each series from one period to the next.
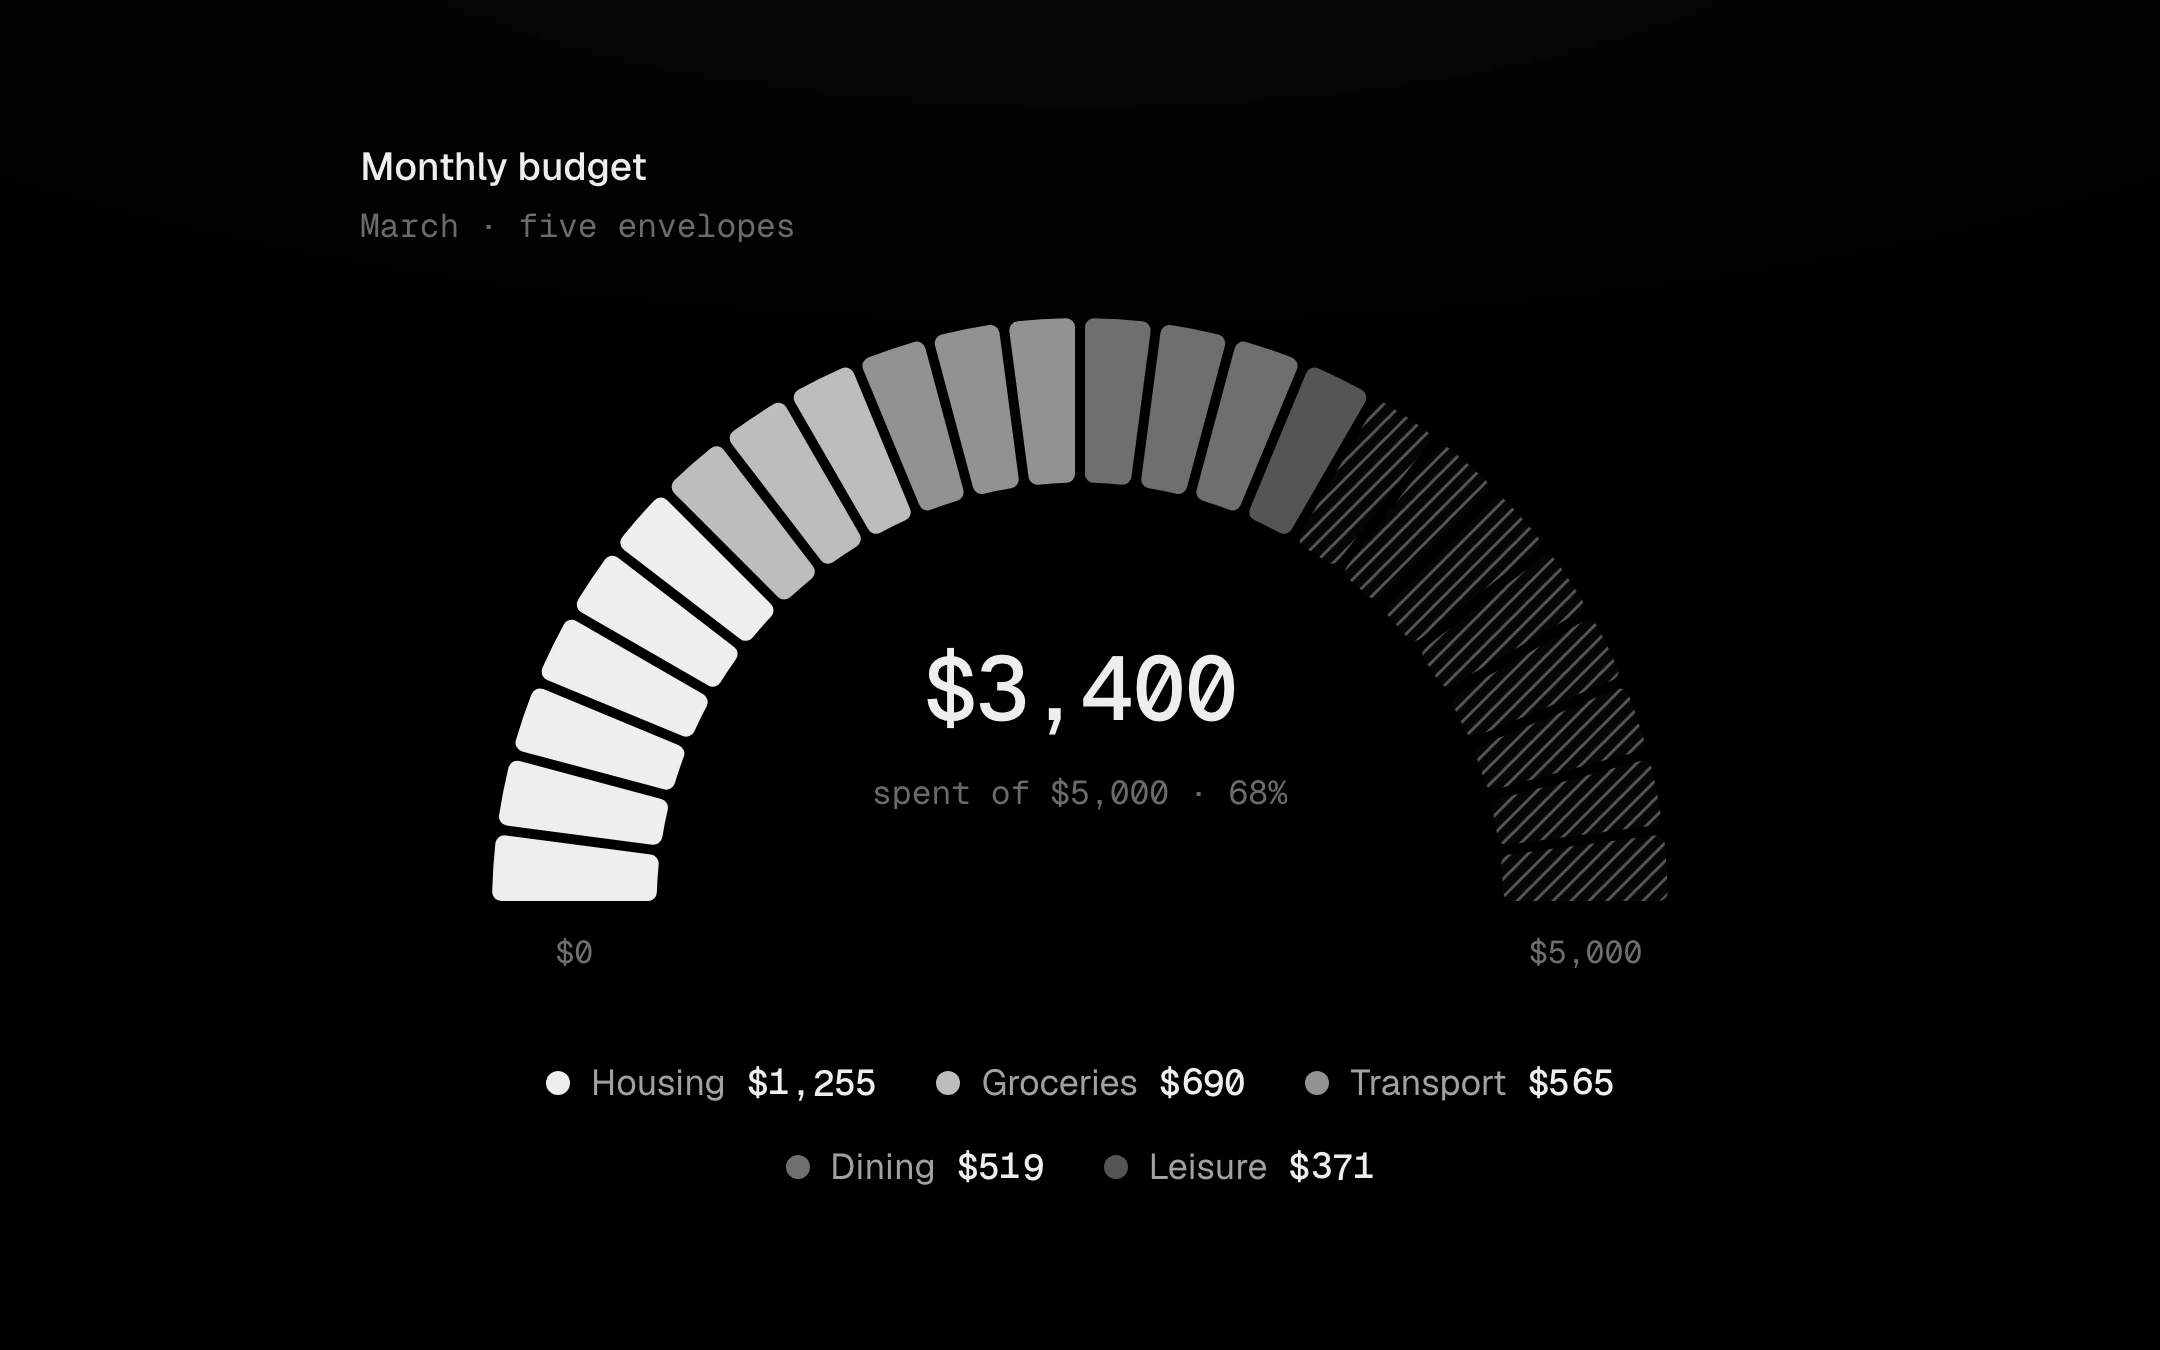
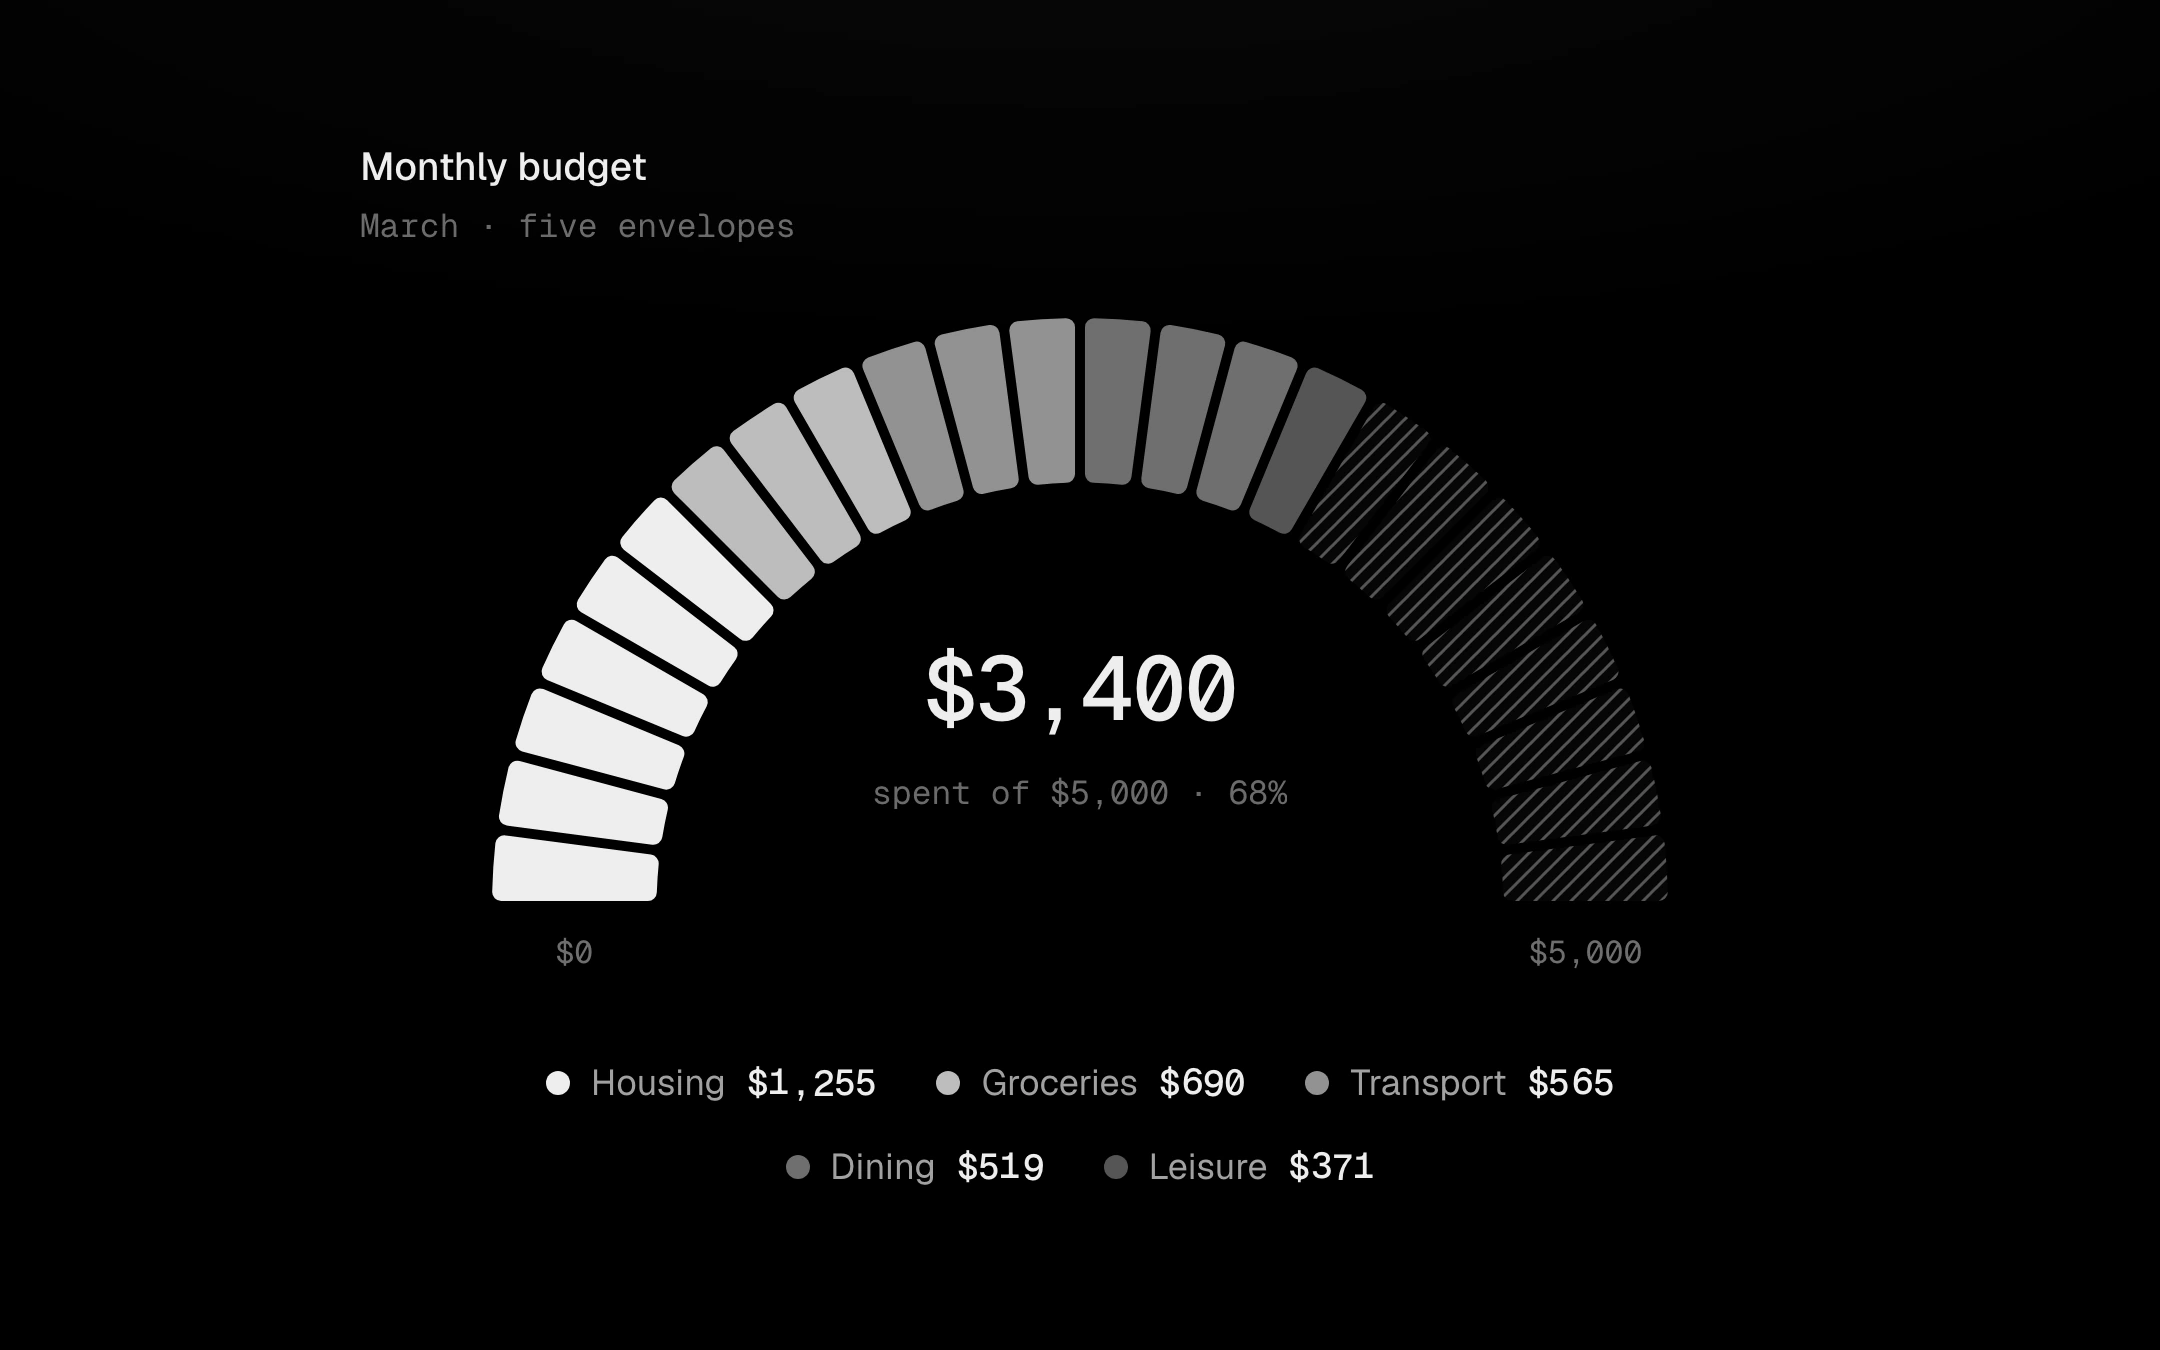
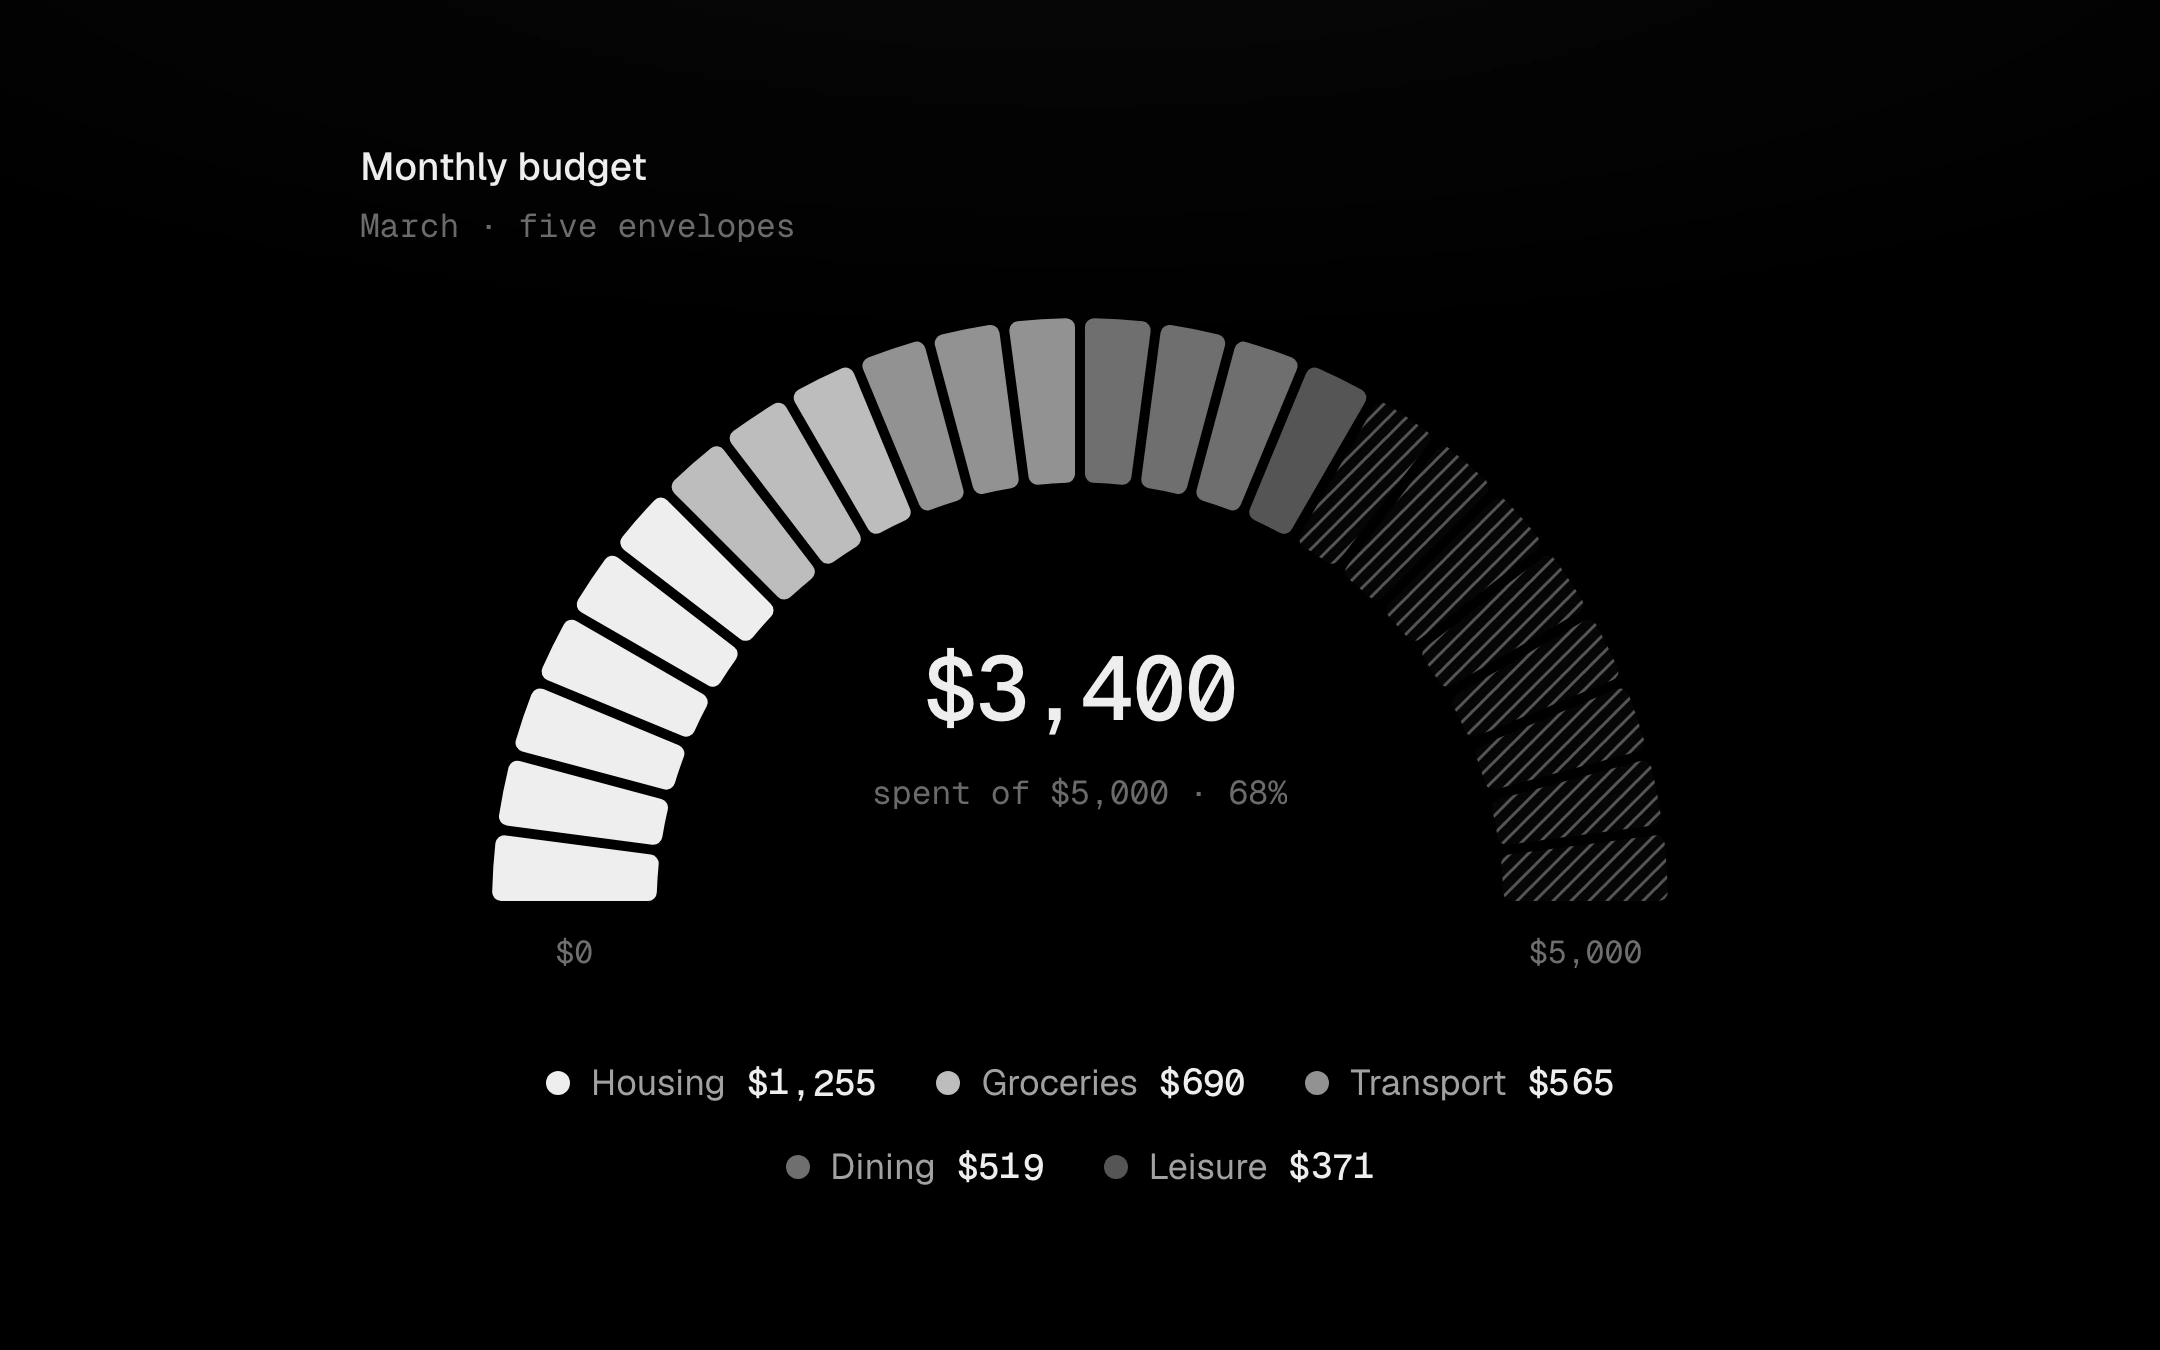
A segmented half ring for a budget or a quota.
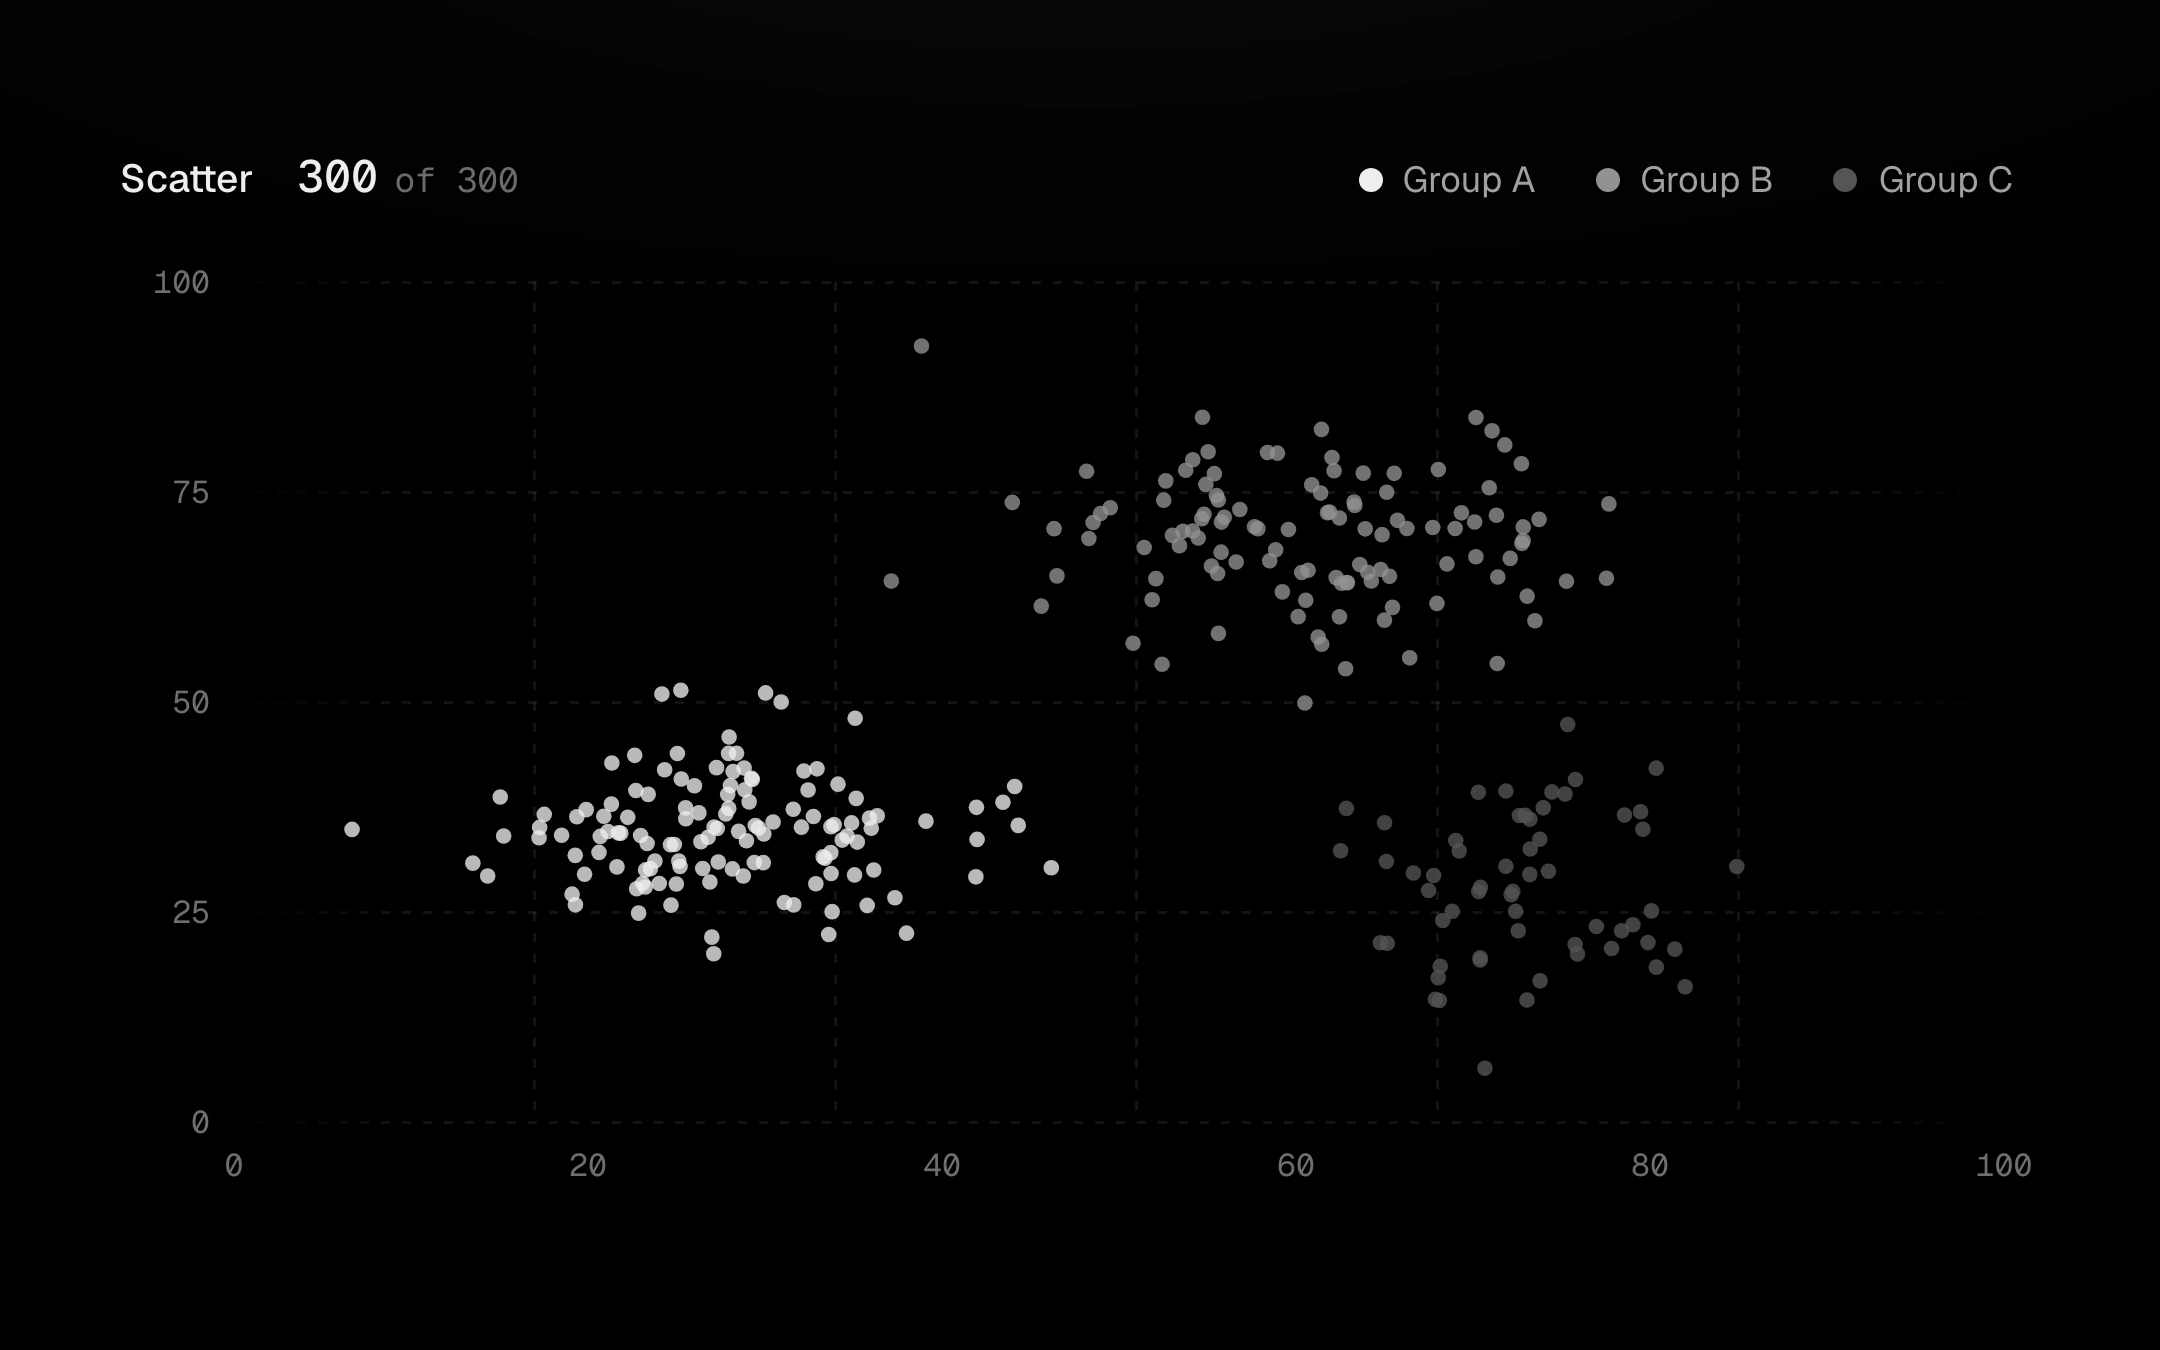
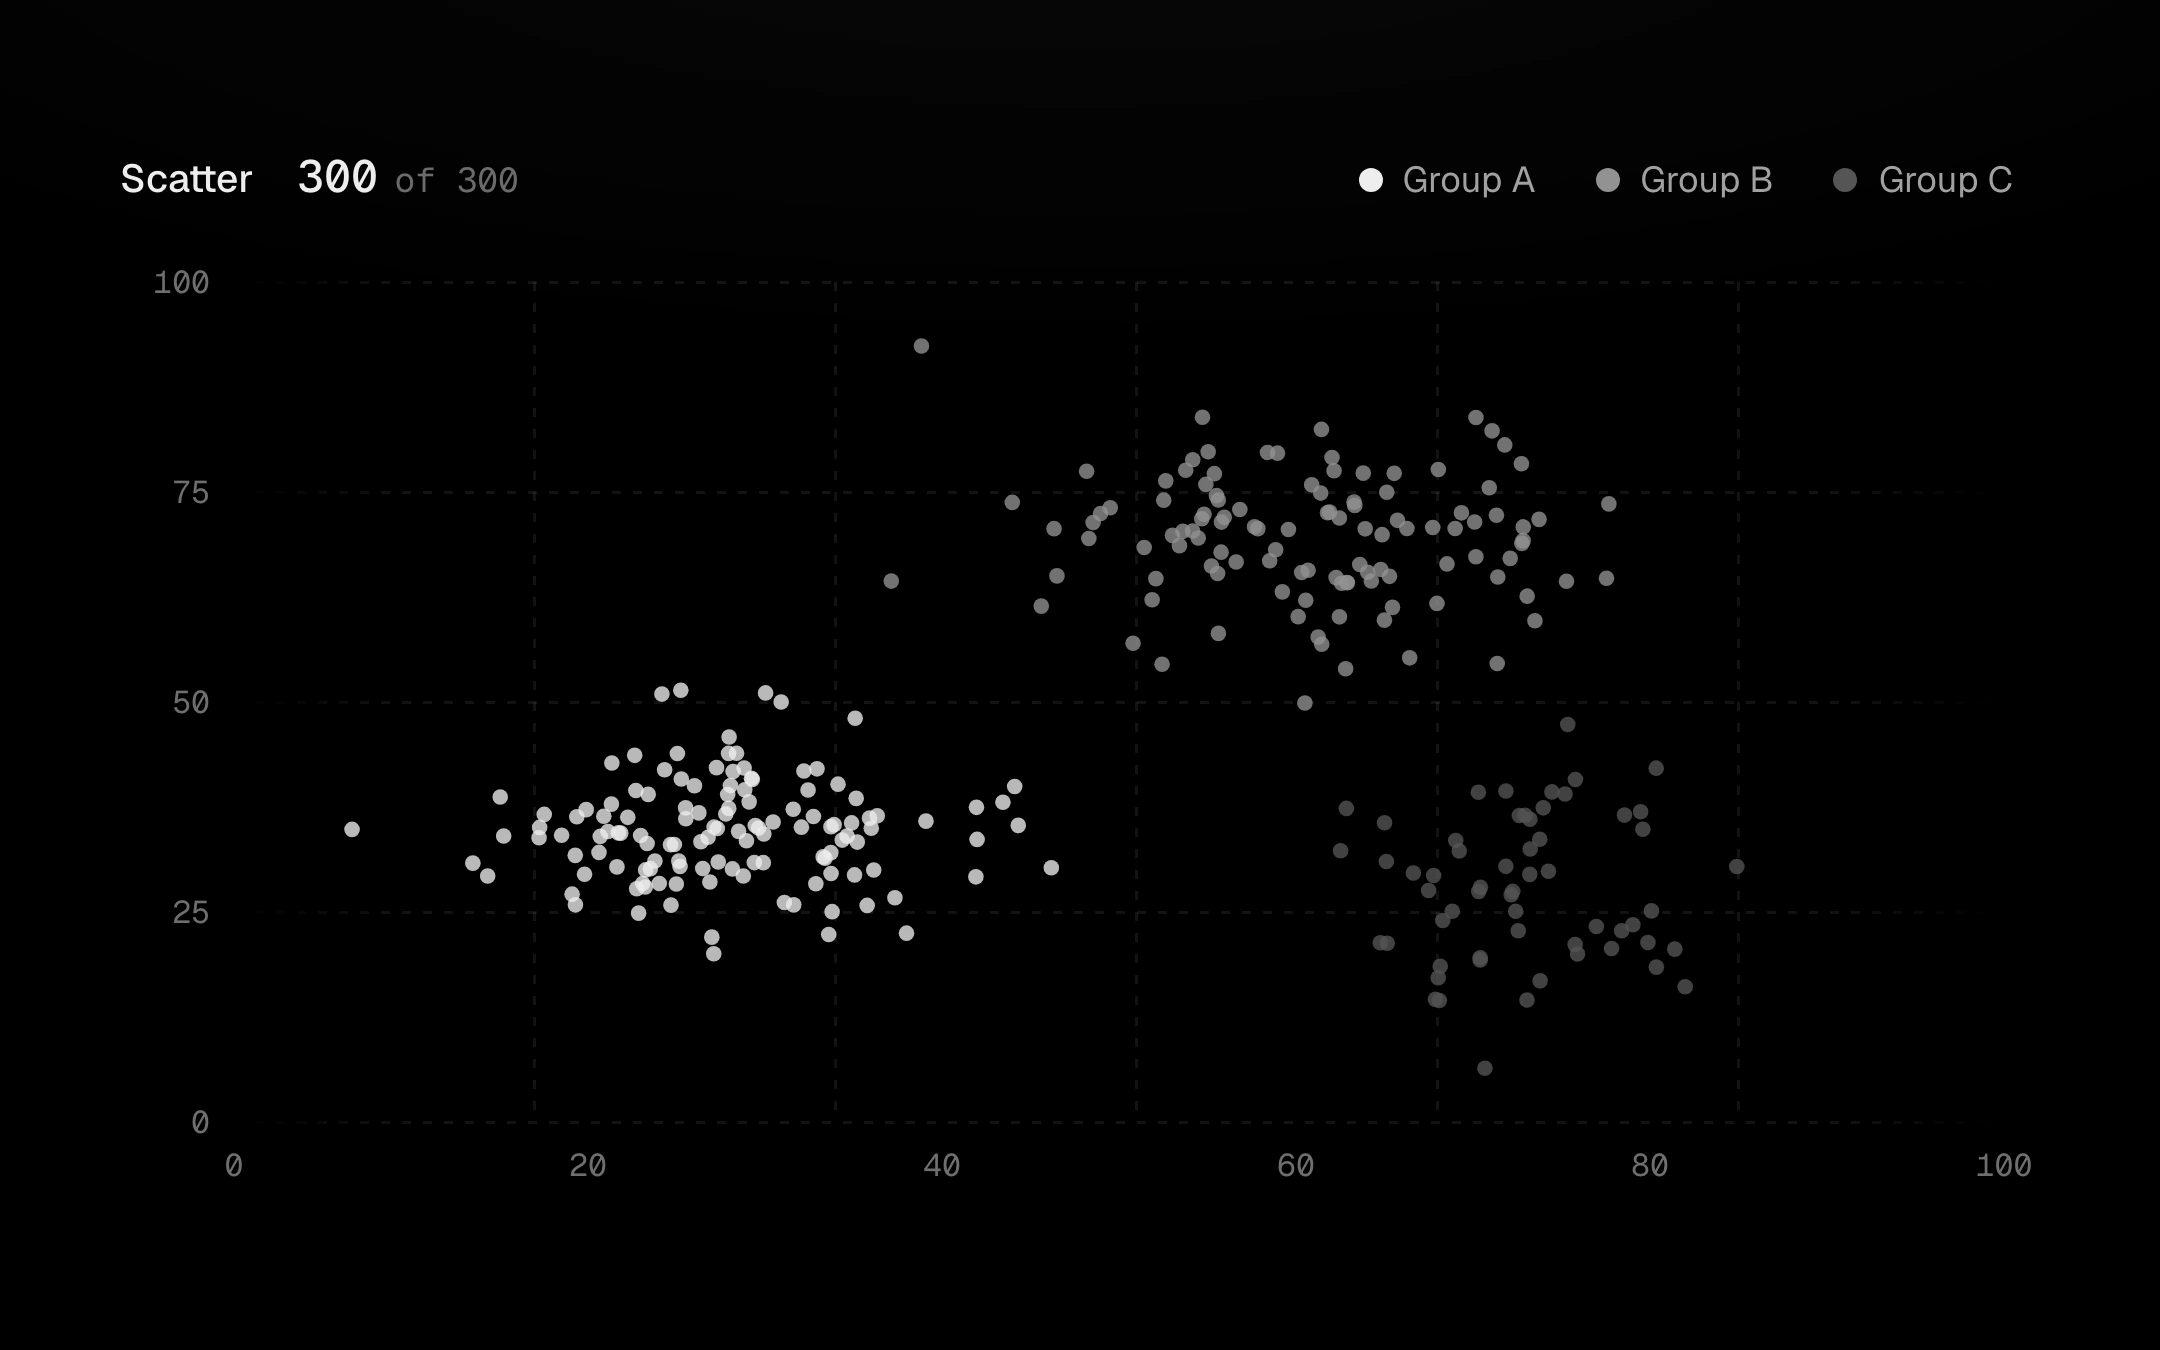
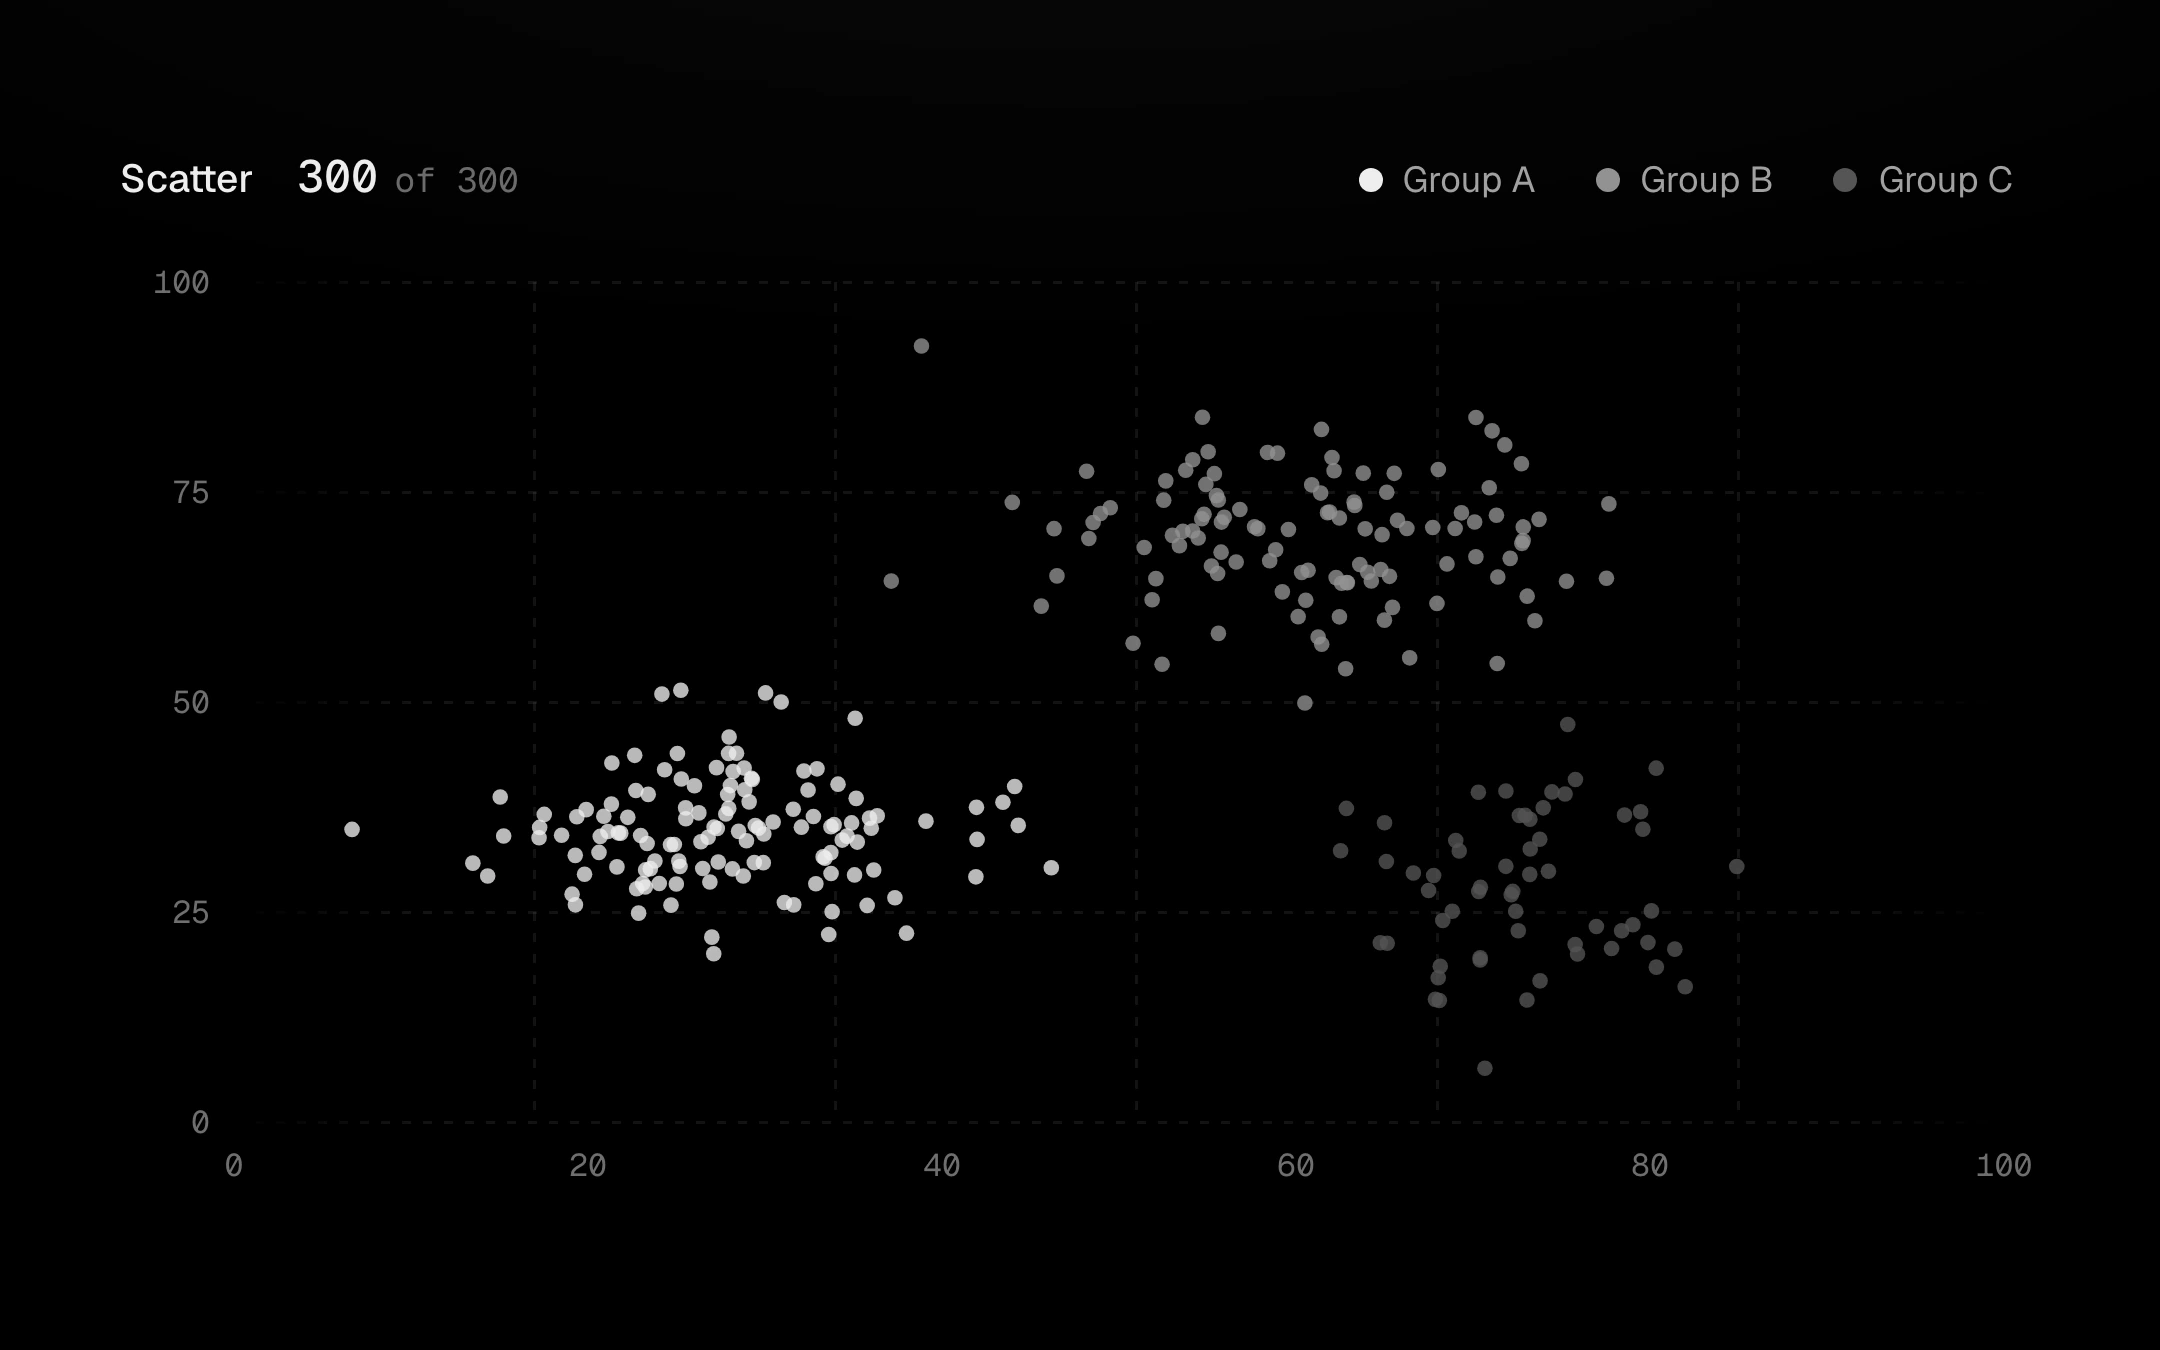
Points on the viz-kit chart with a free pointer.
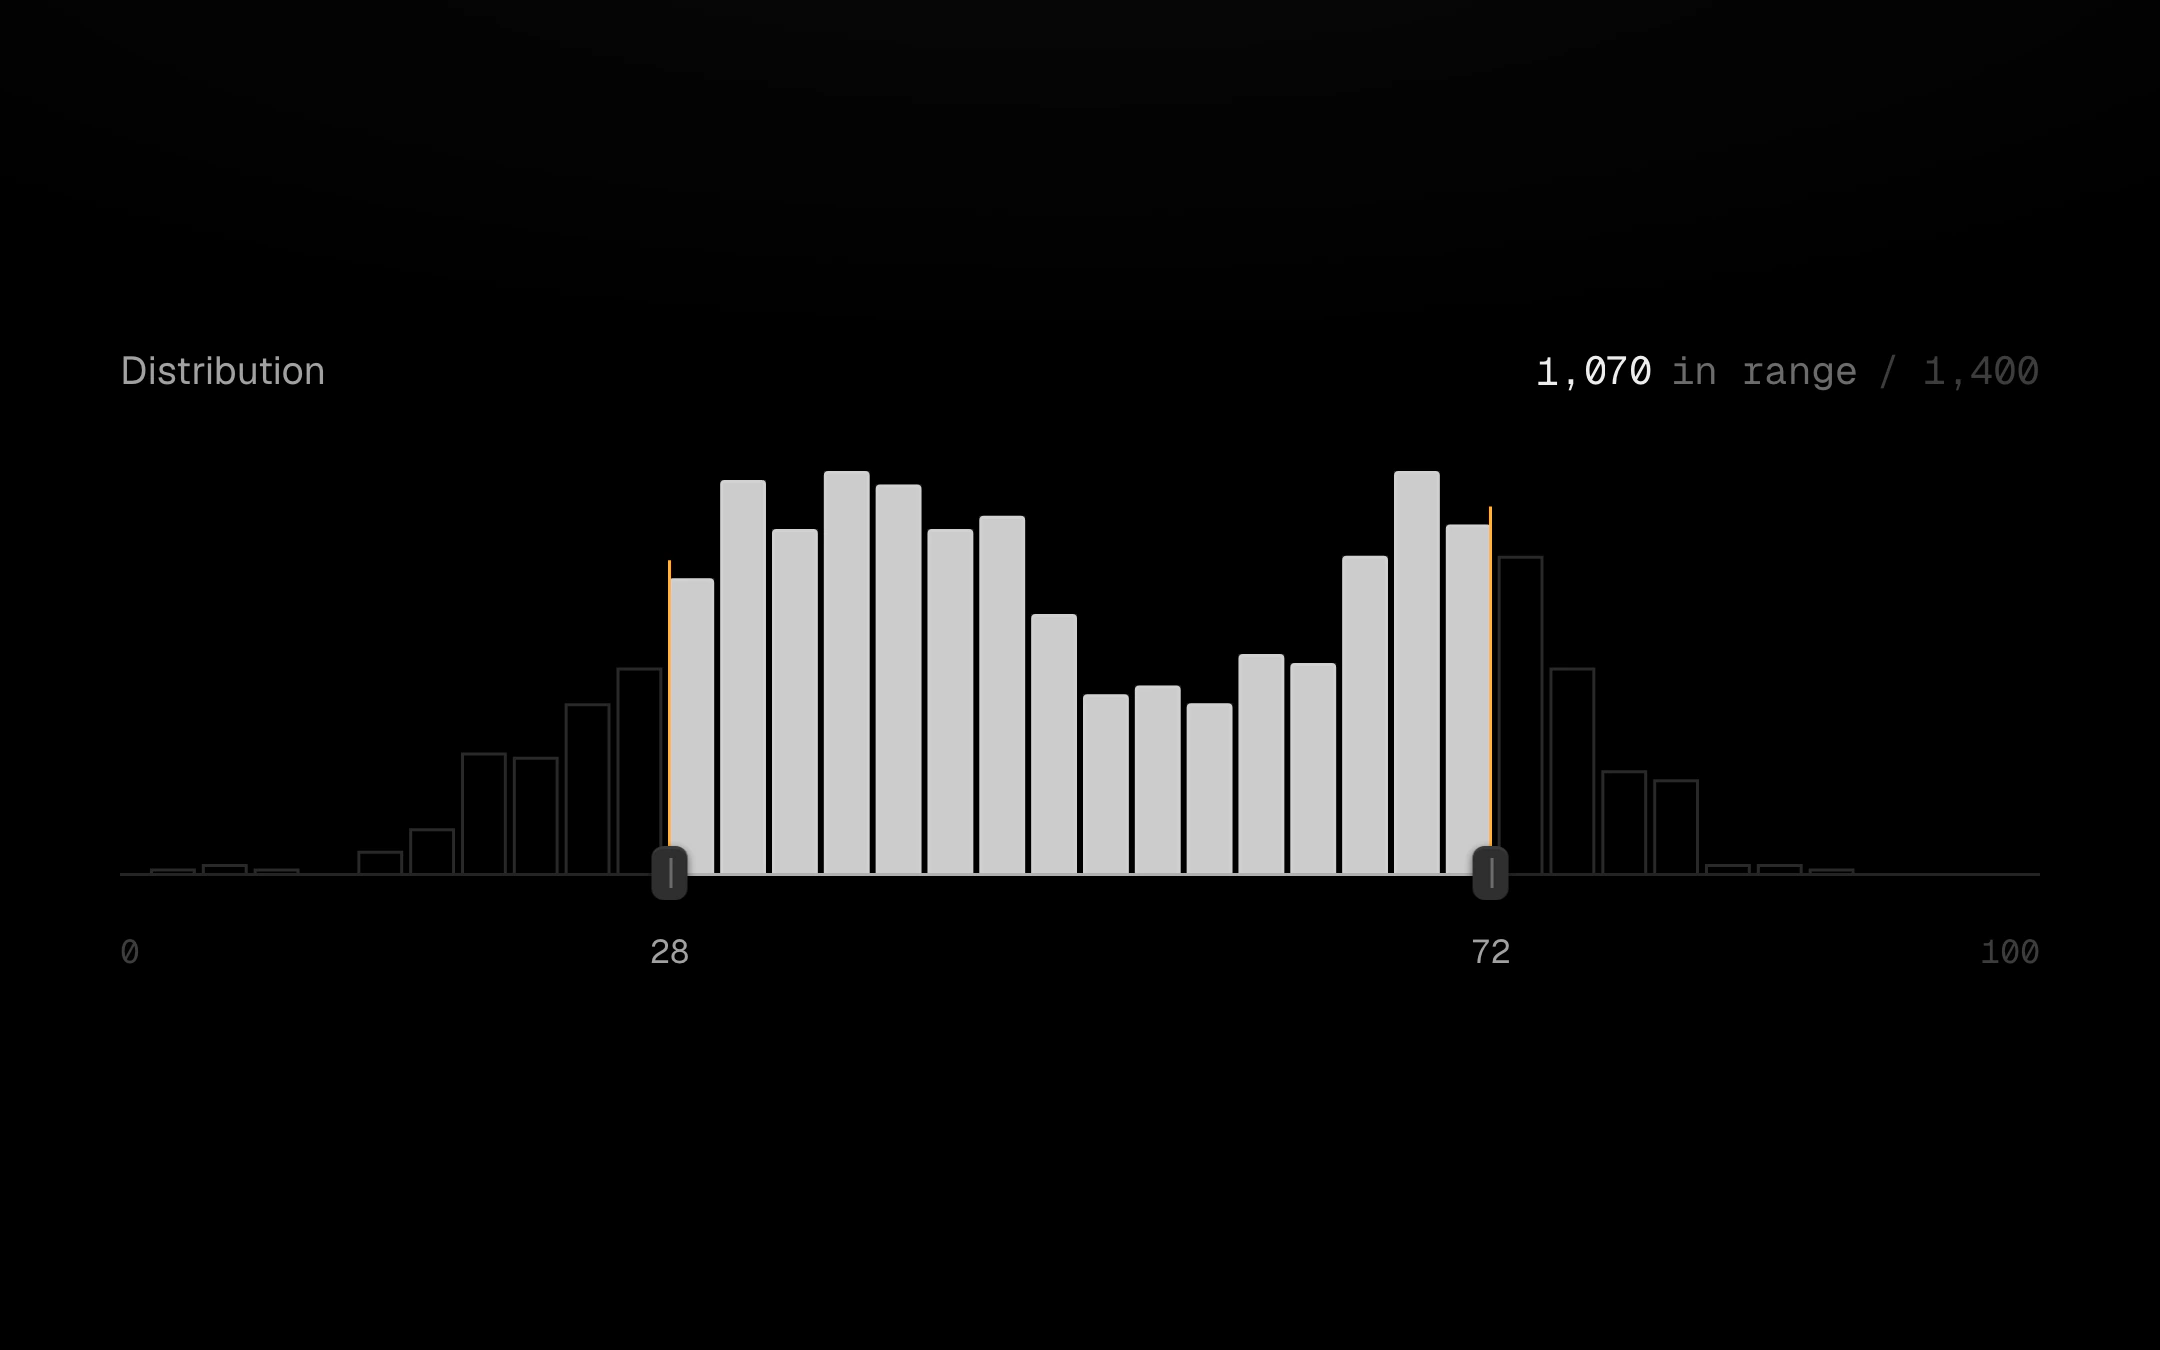
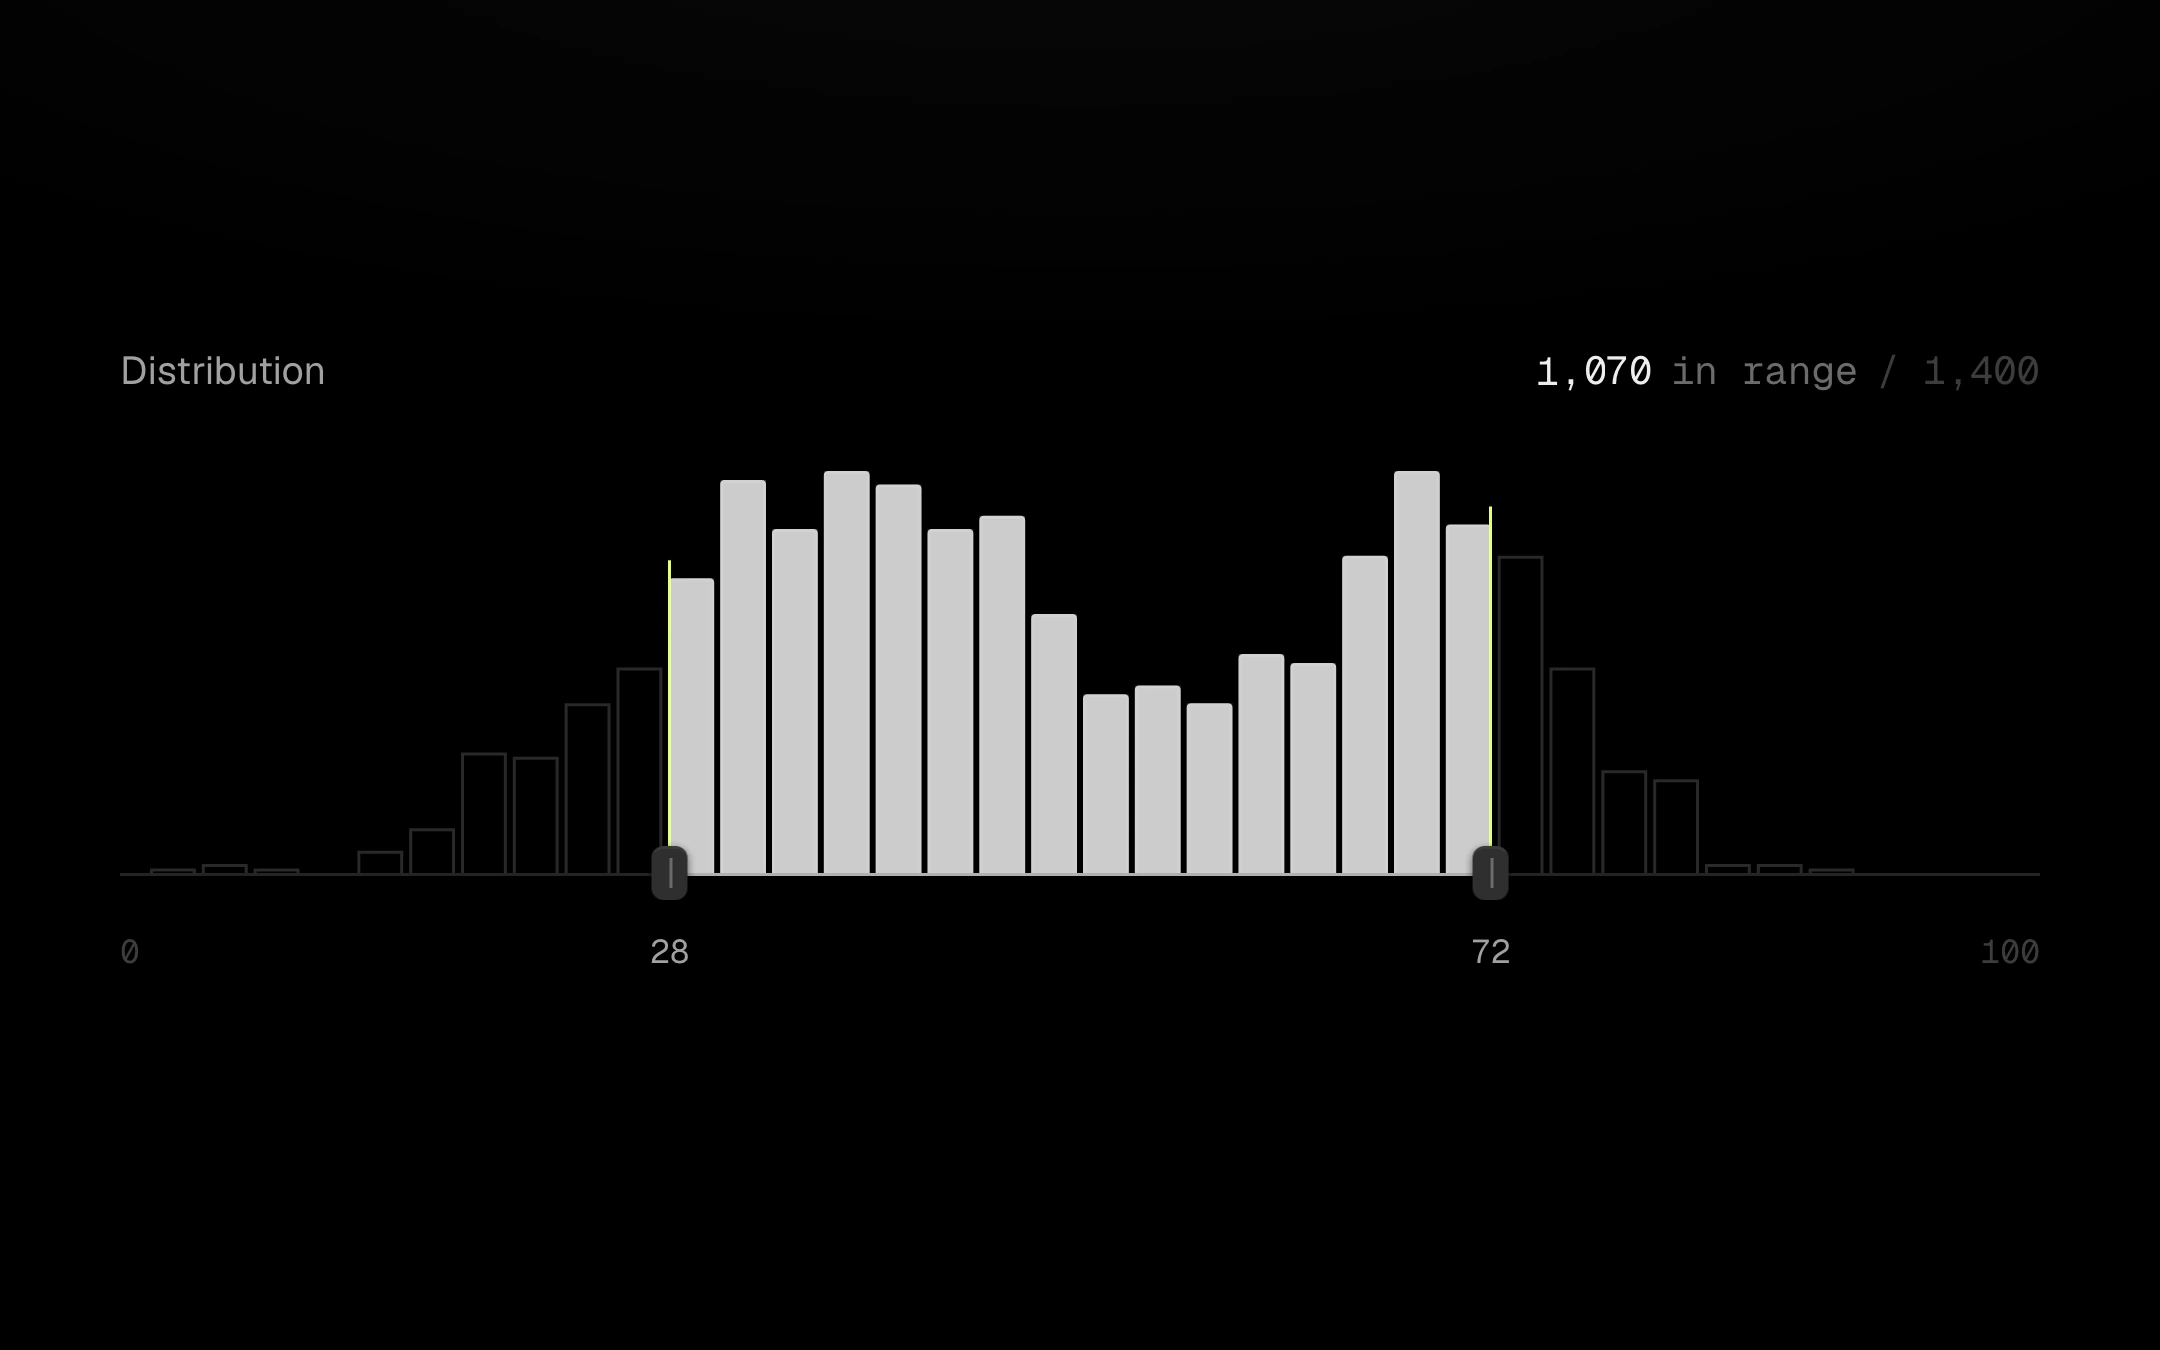
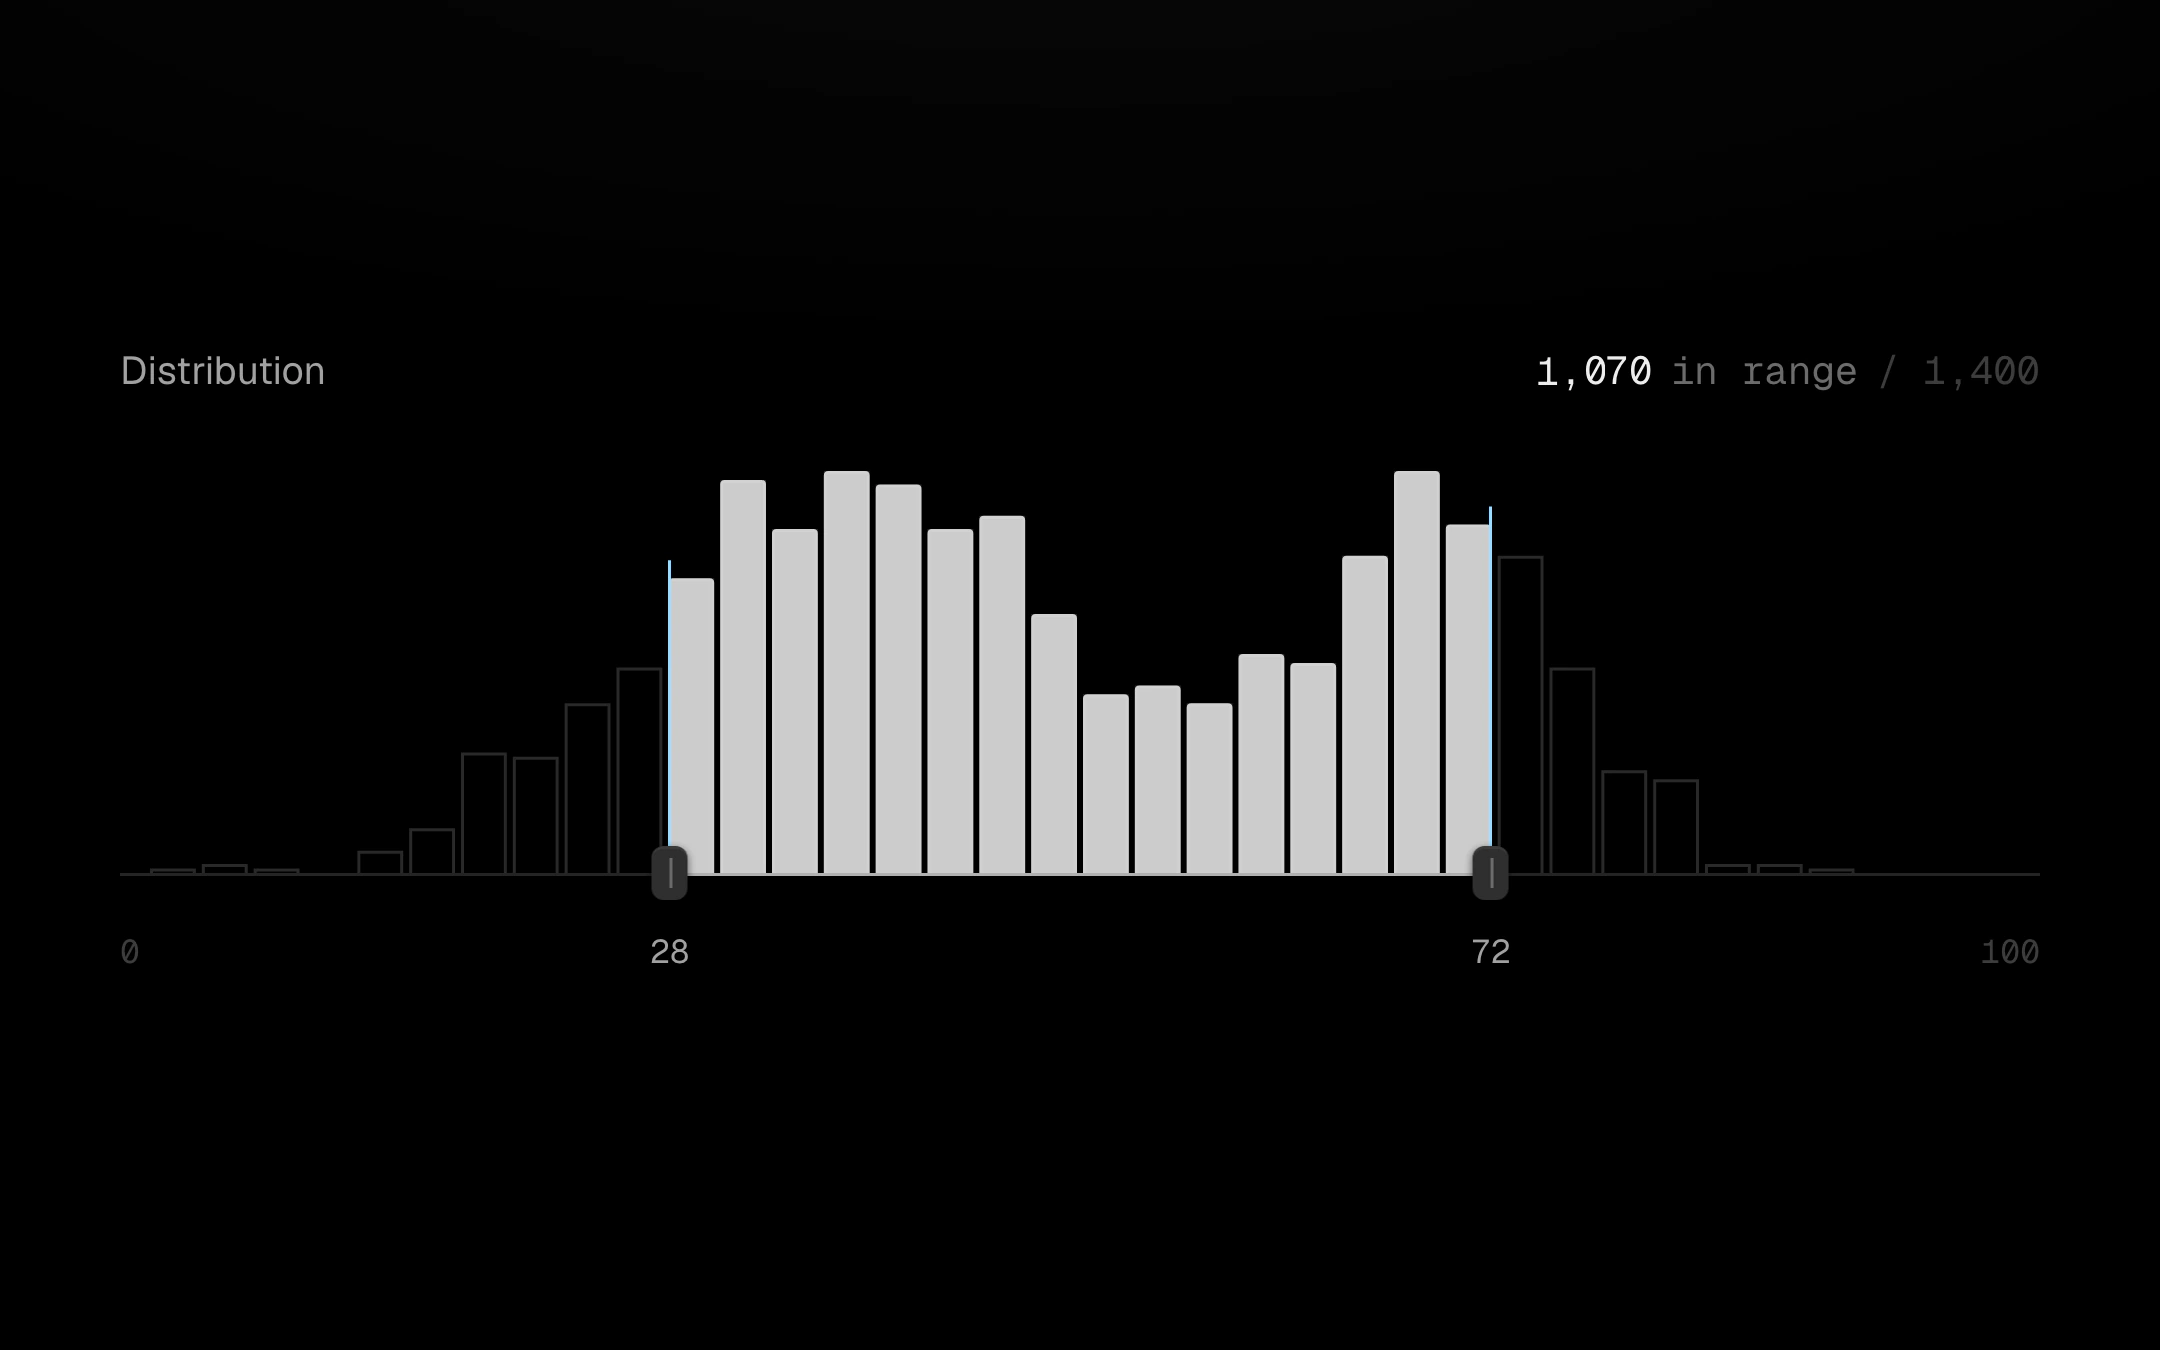
A distribution with a two-thumb range slider fused to its baseline.
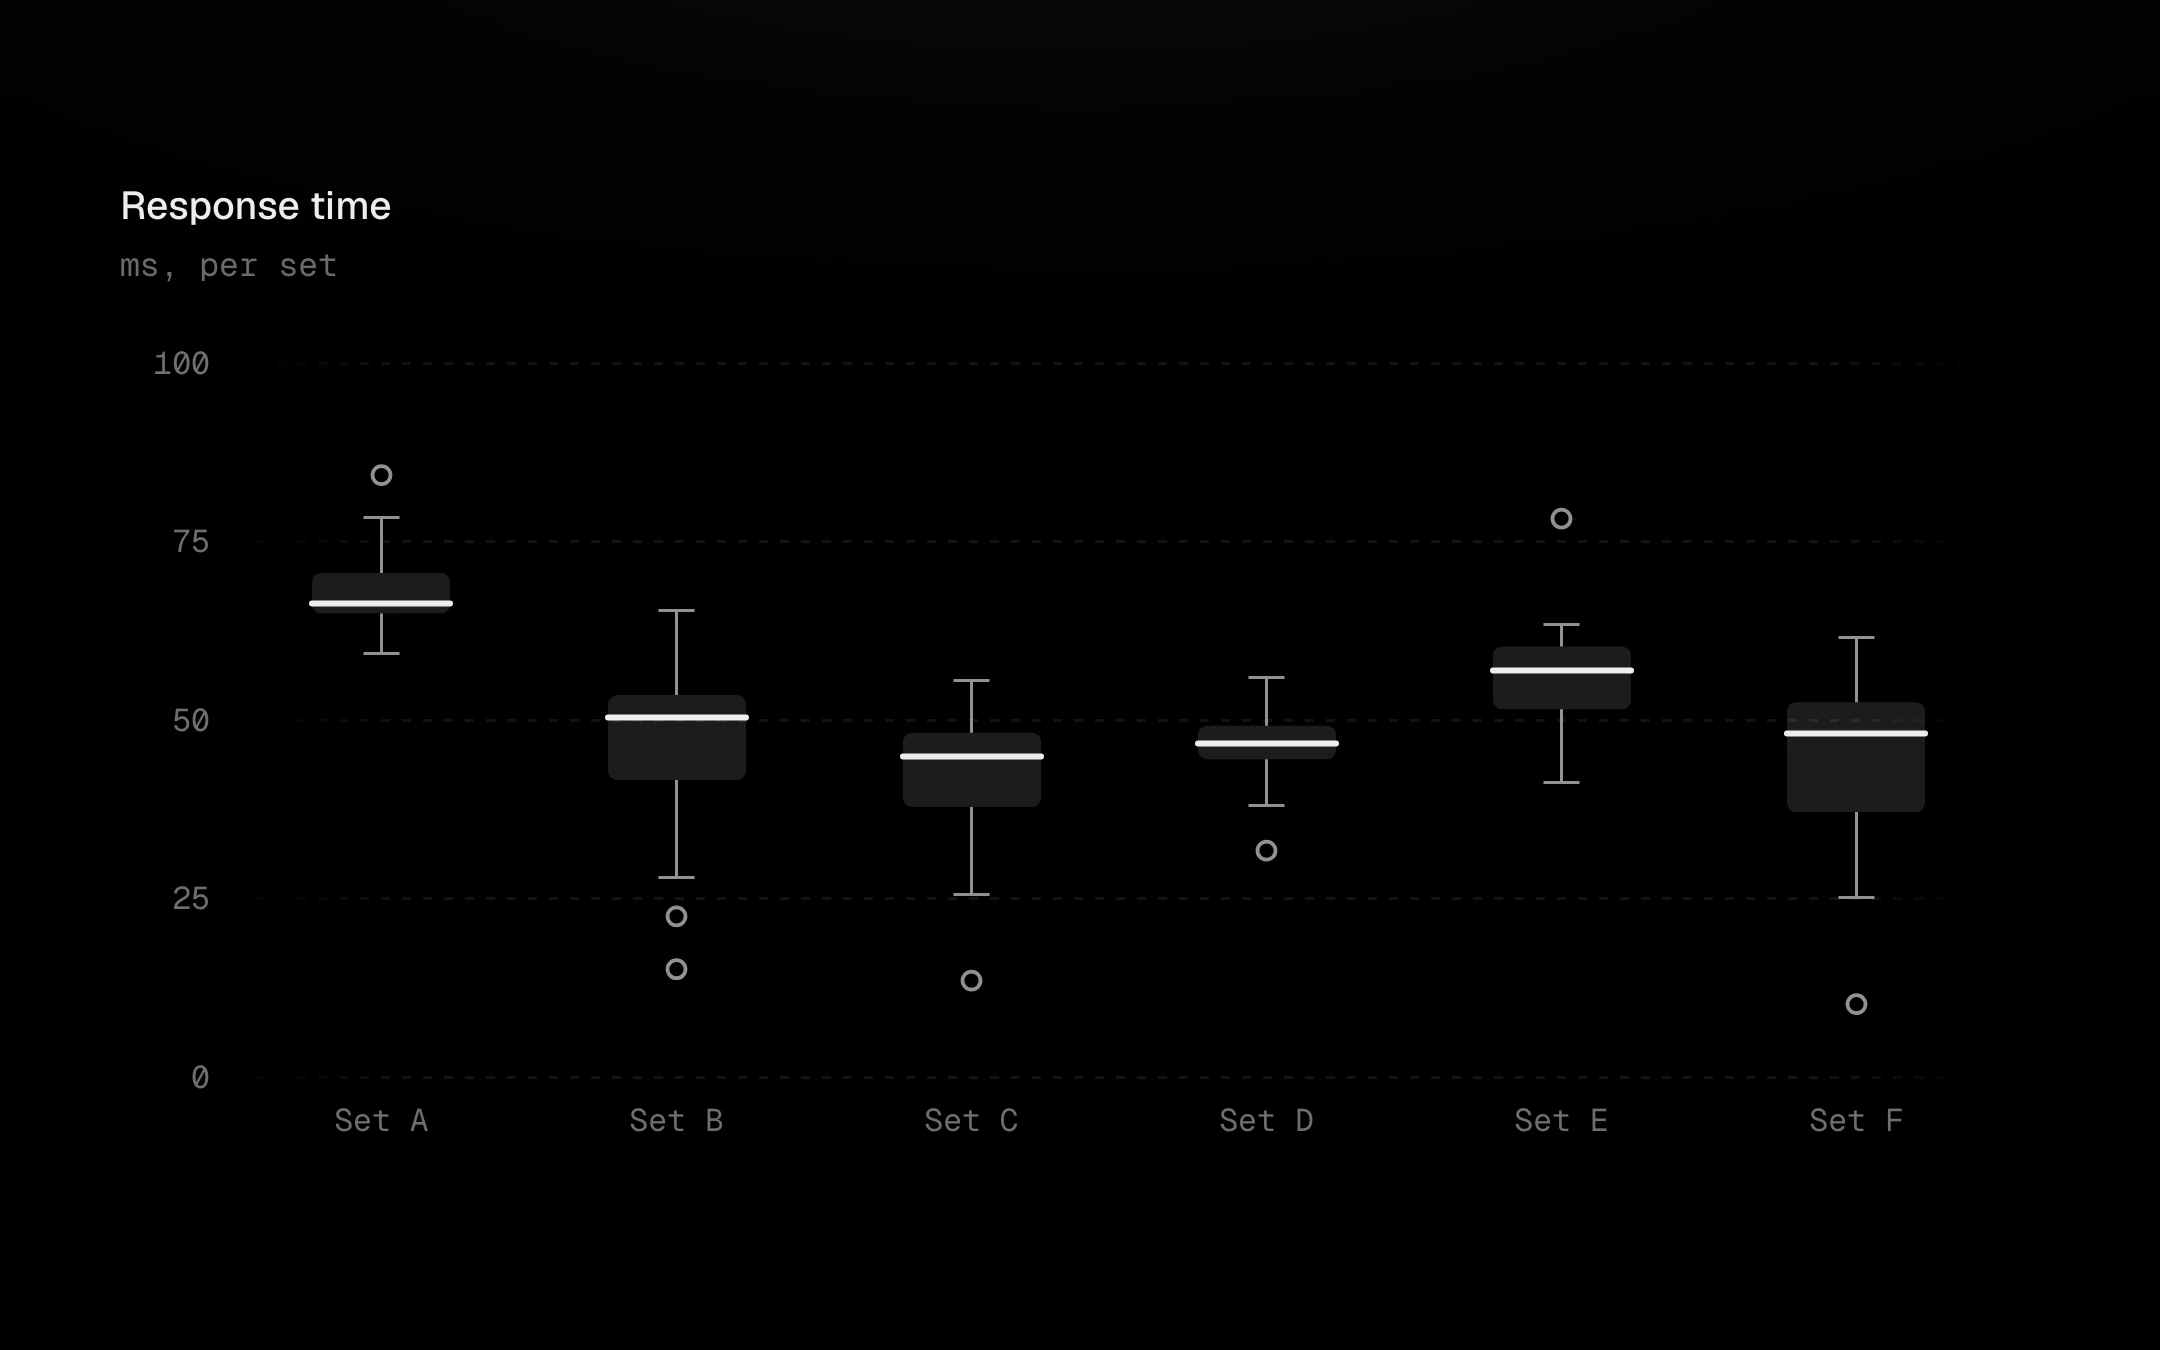
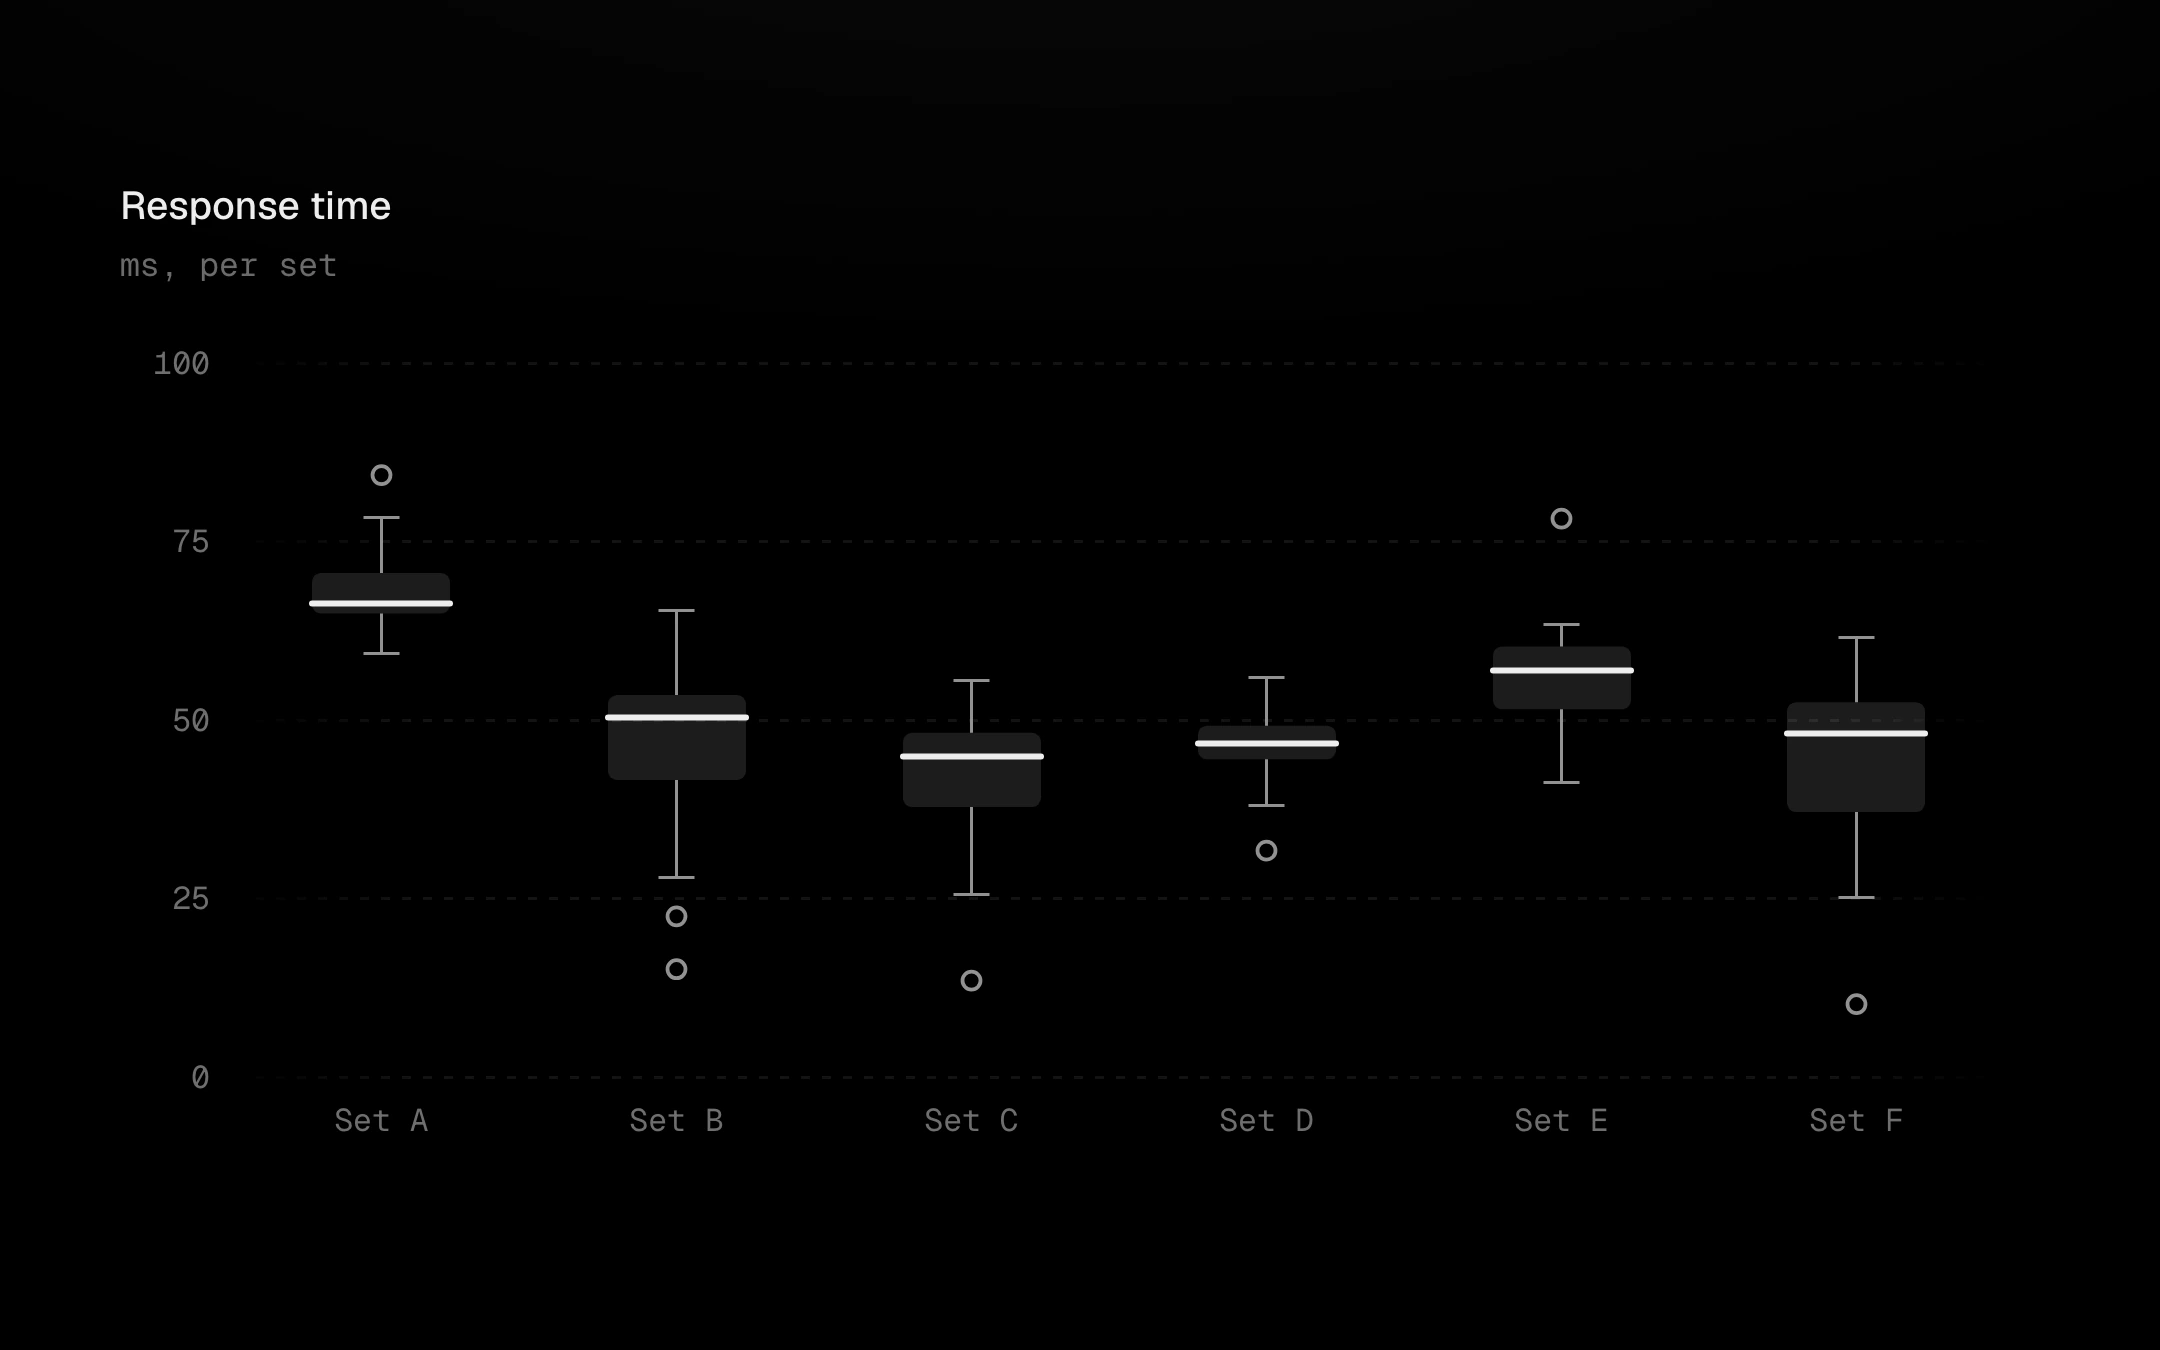
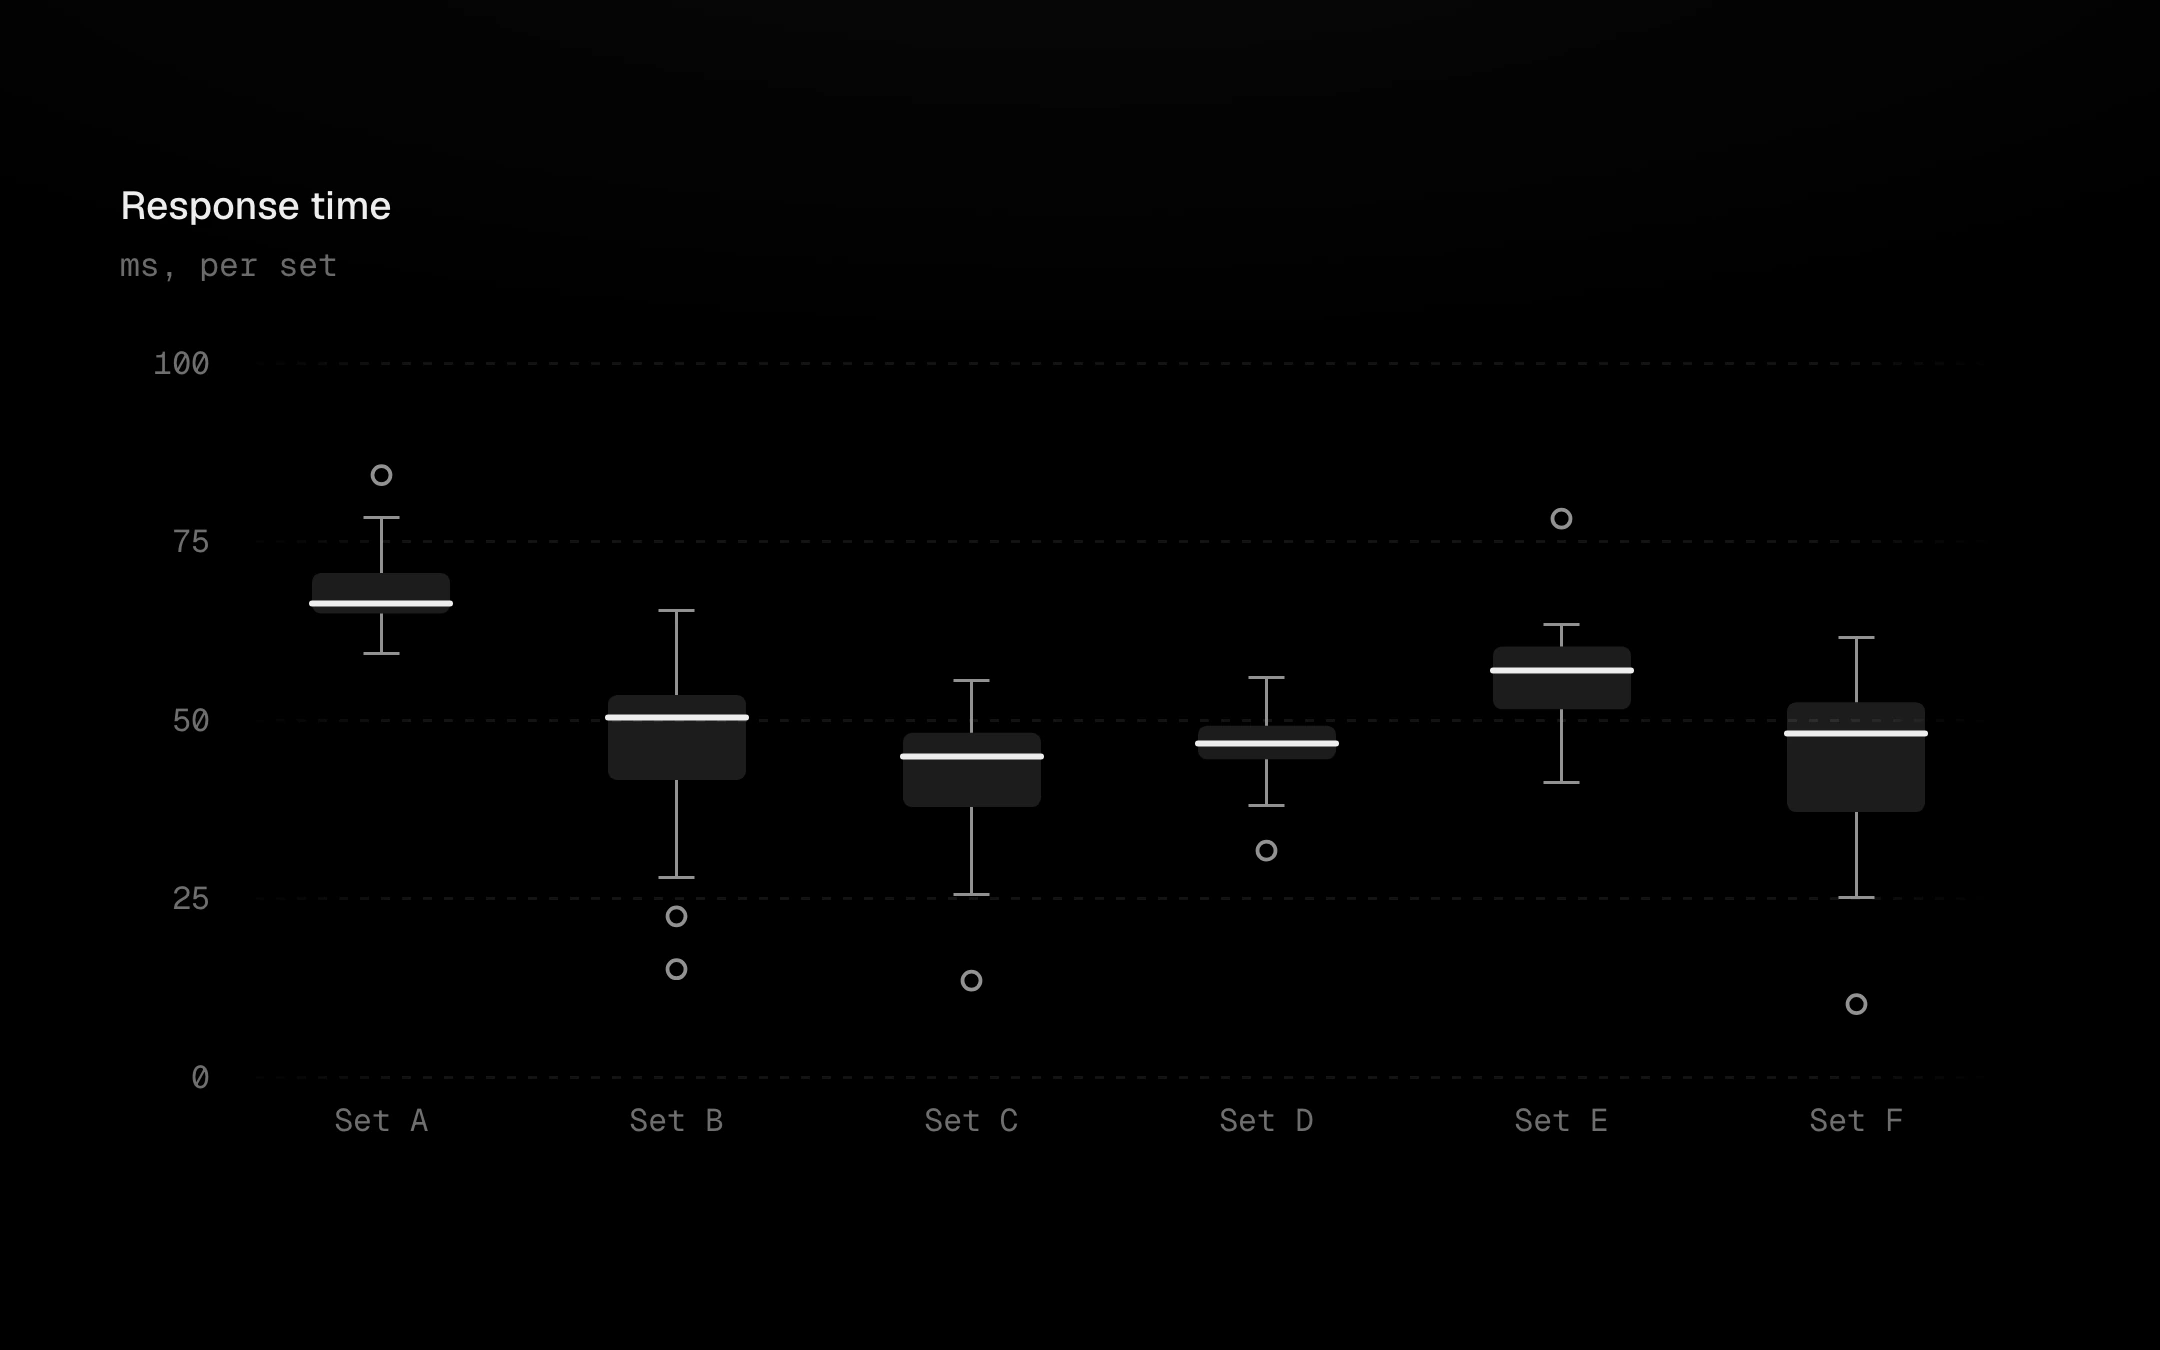
5 IQR and hollow rings for the outliers past them, on the viz-kit chart.
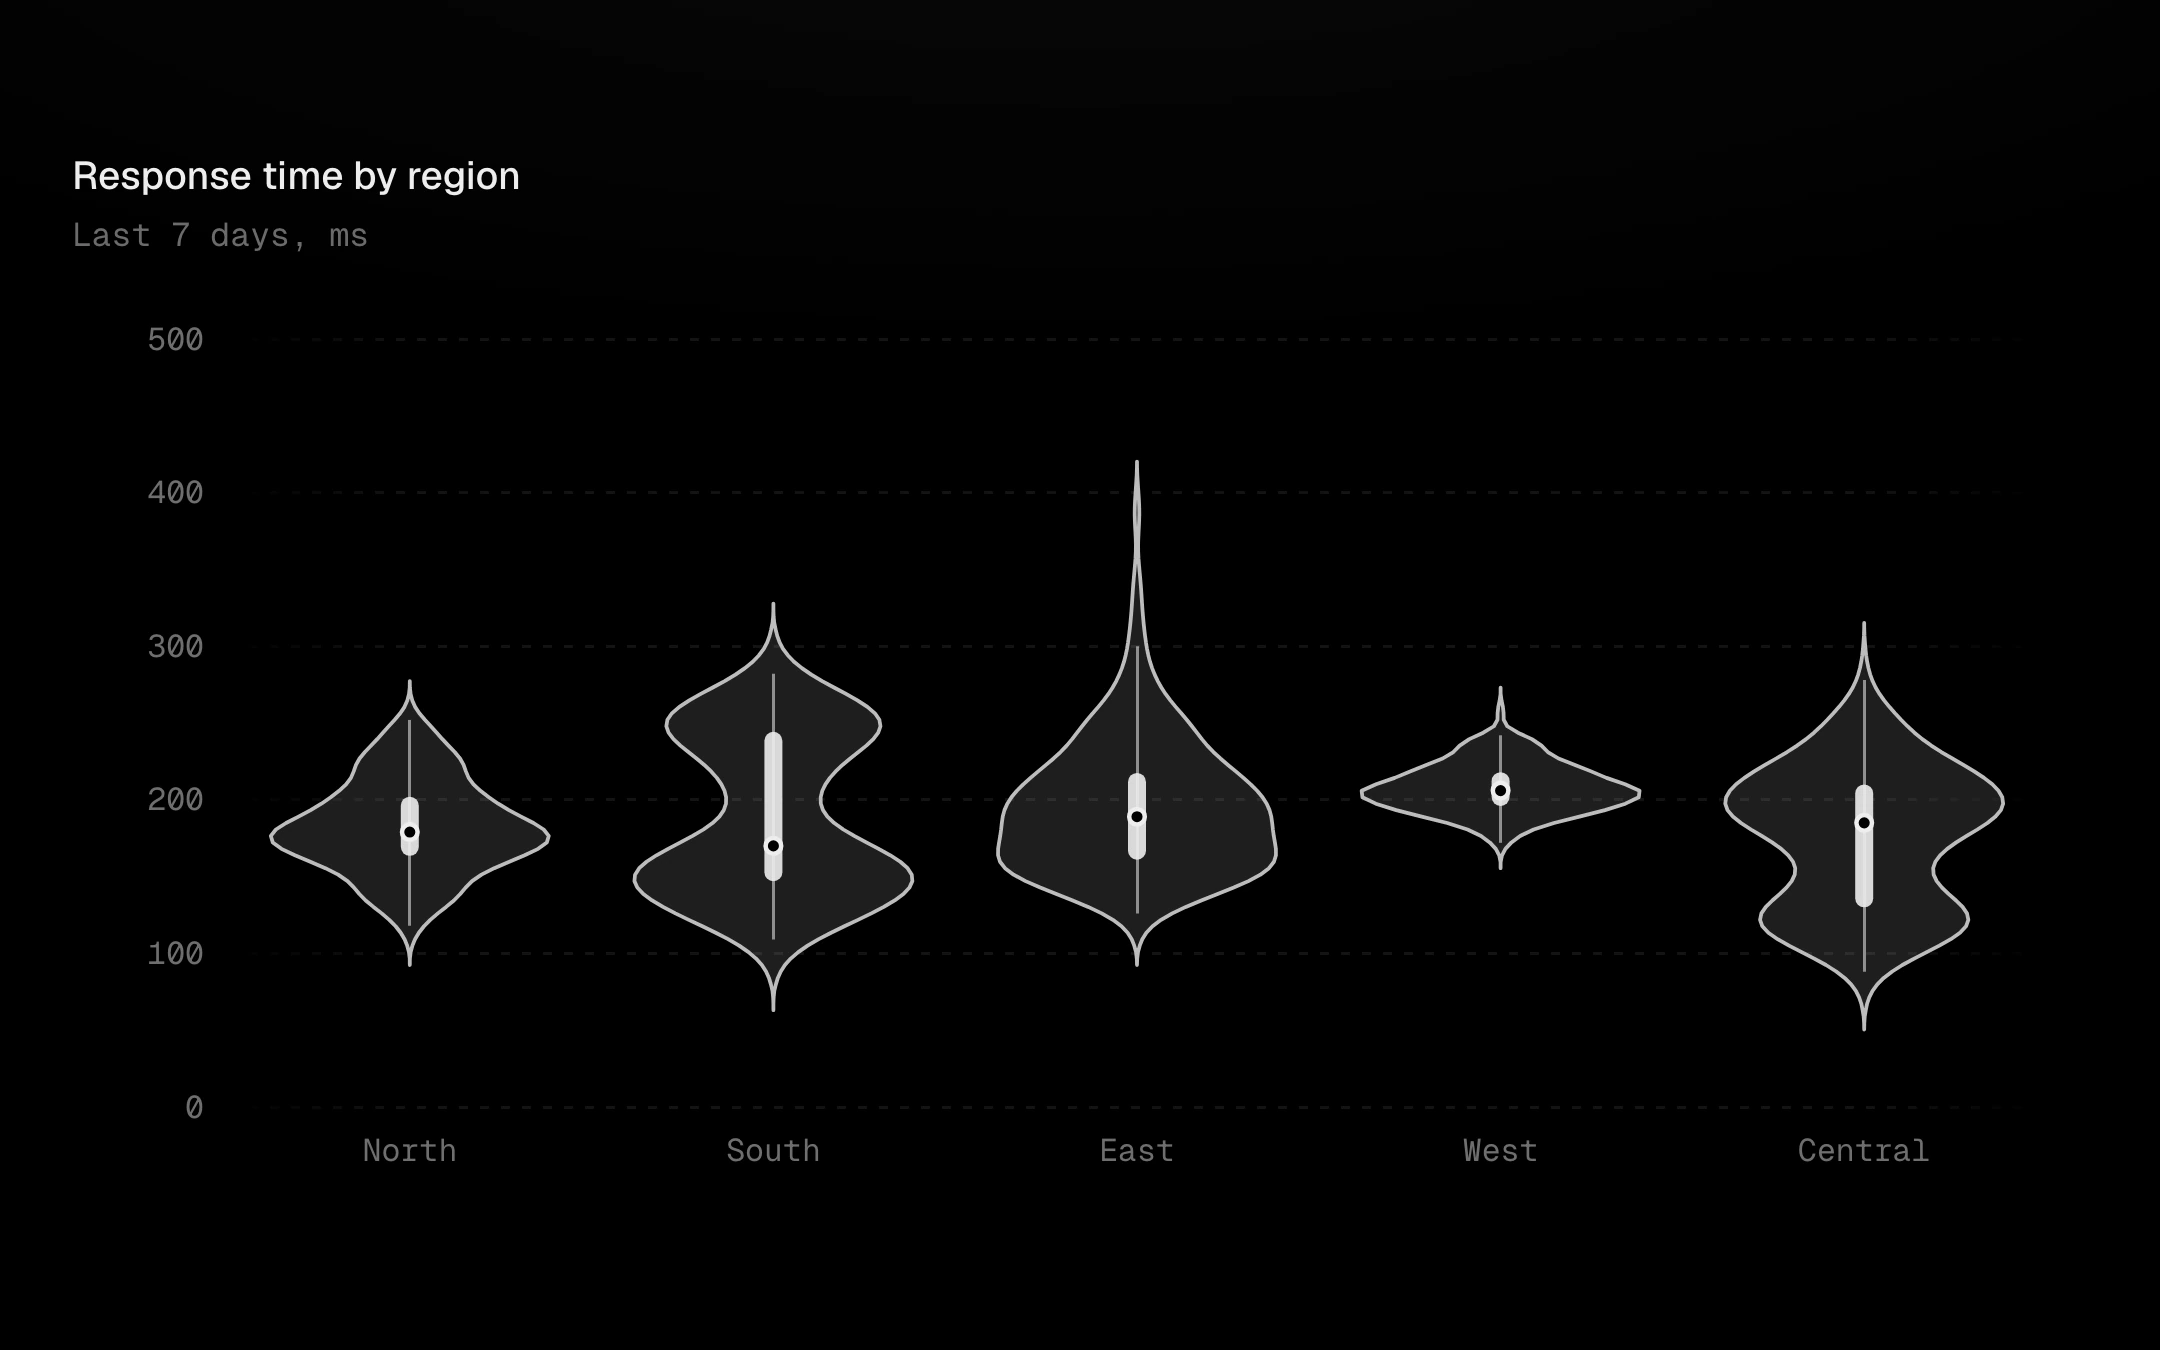
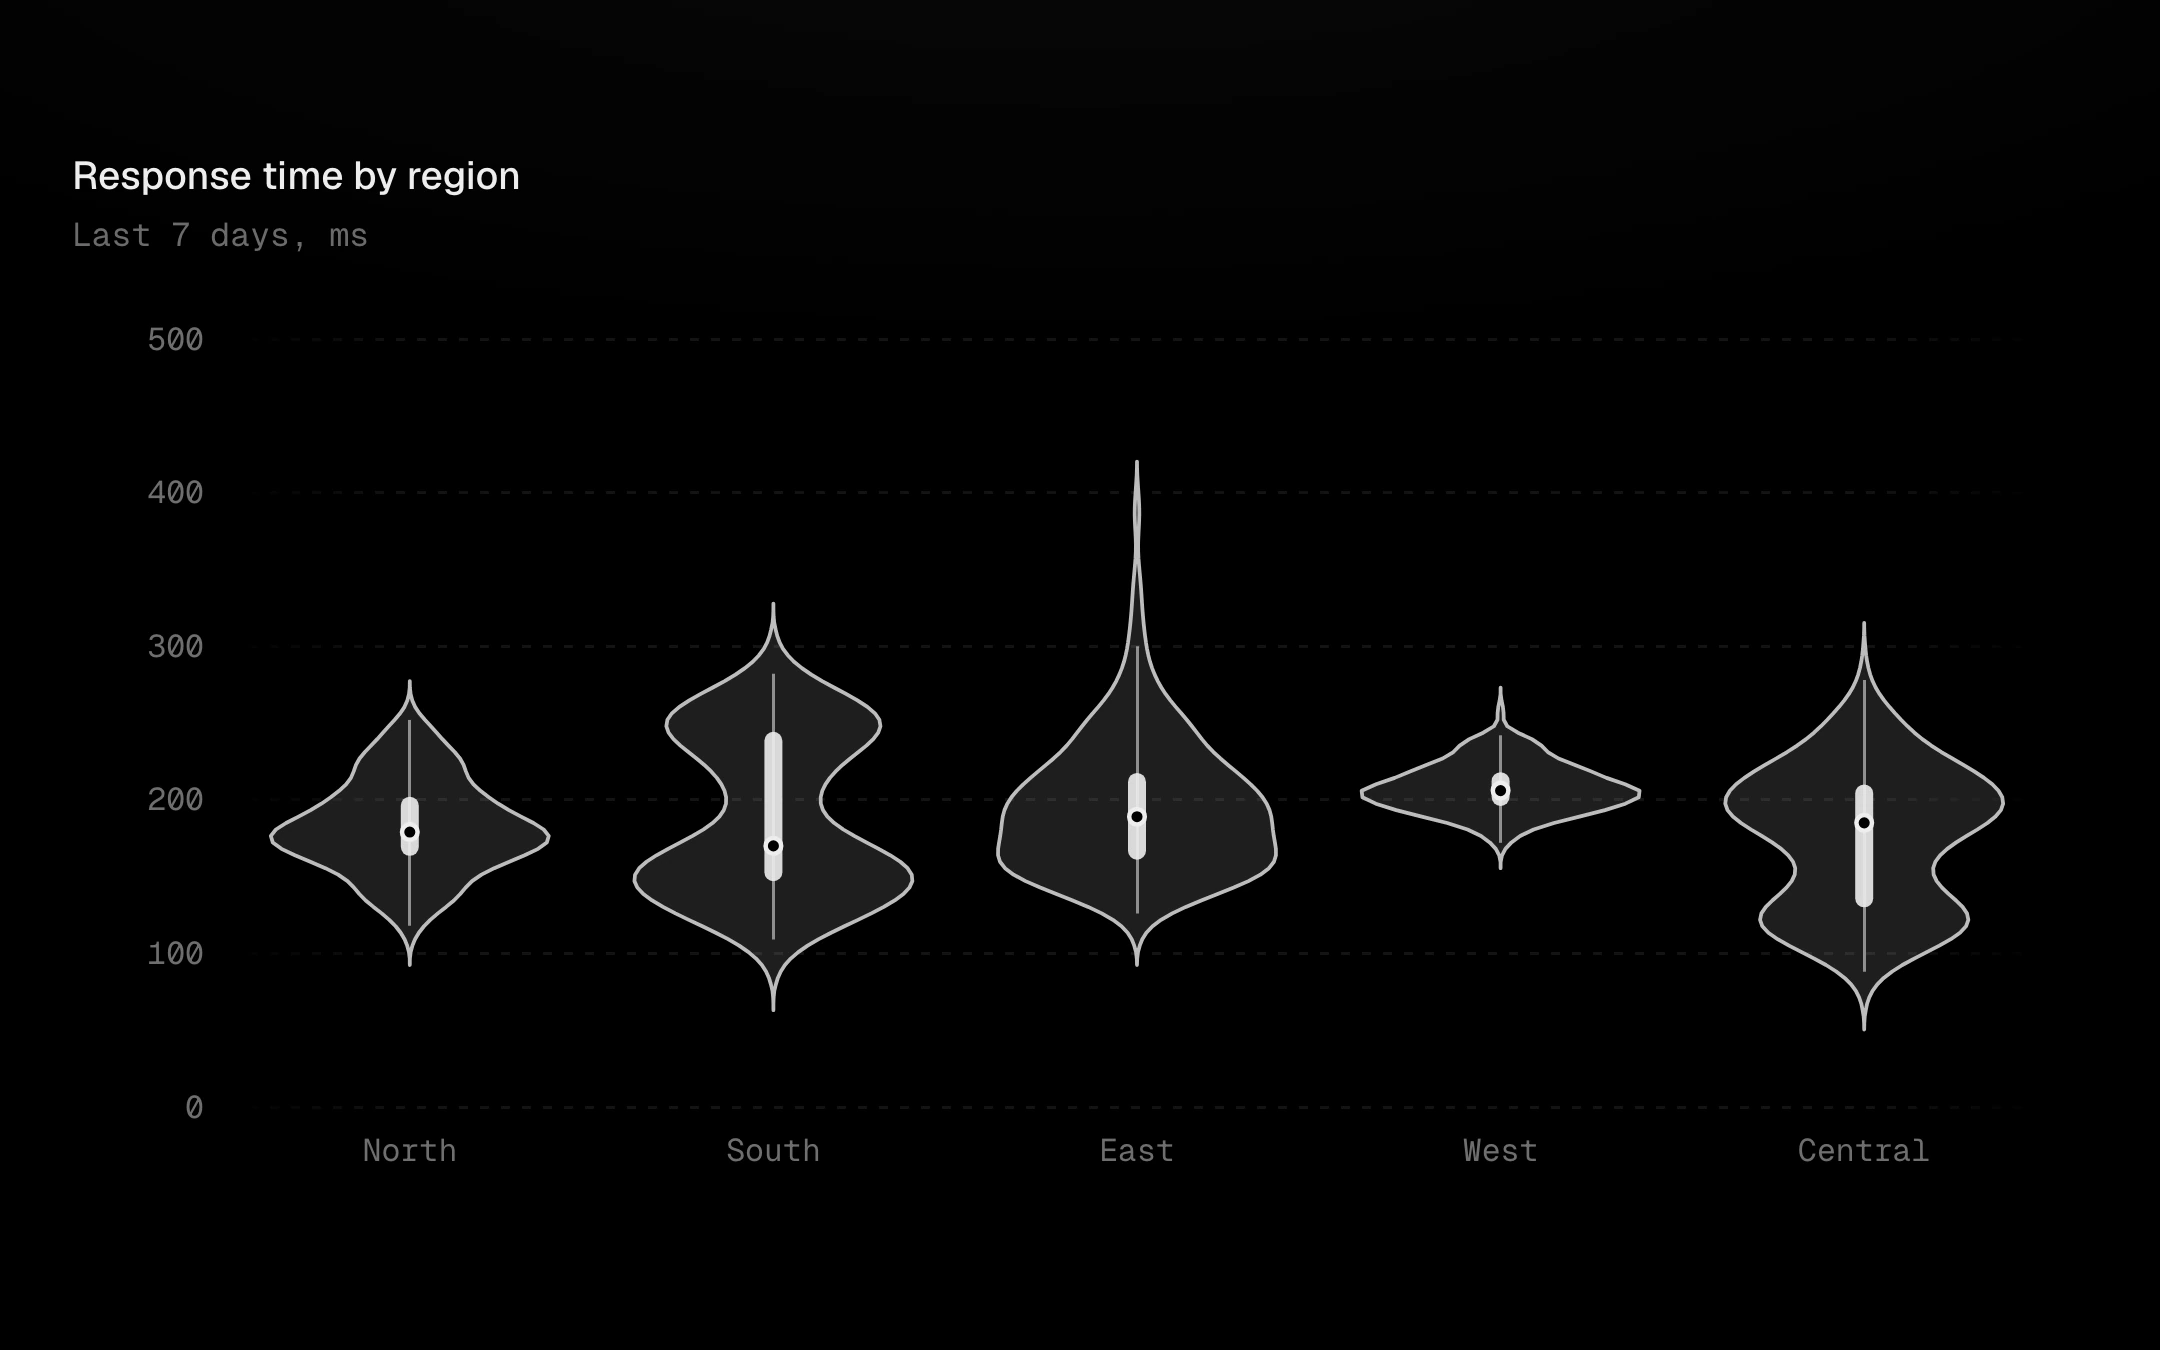
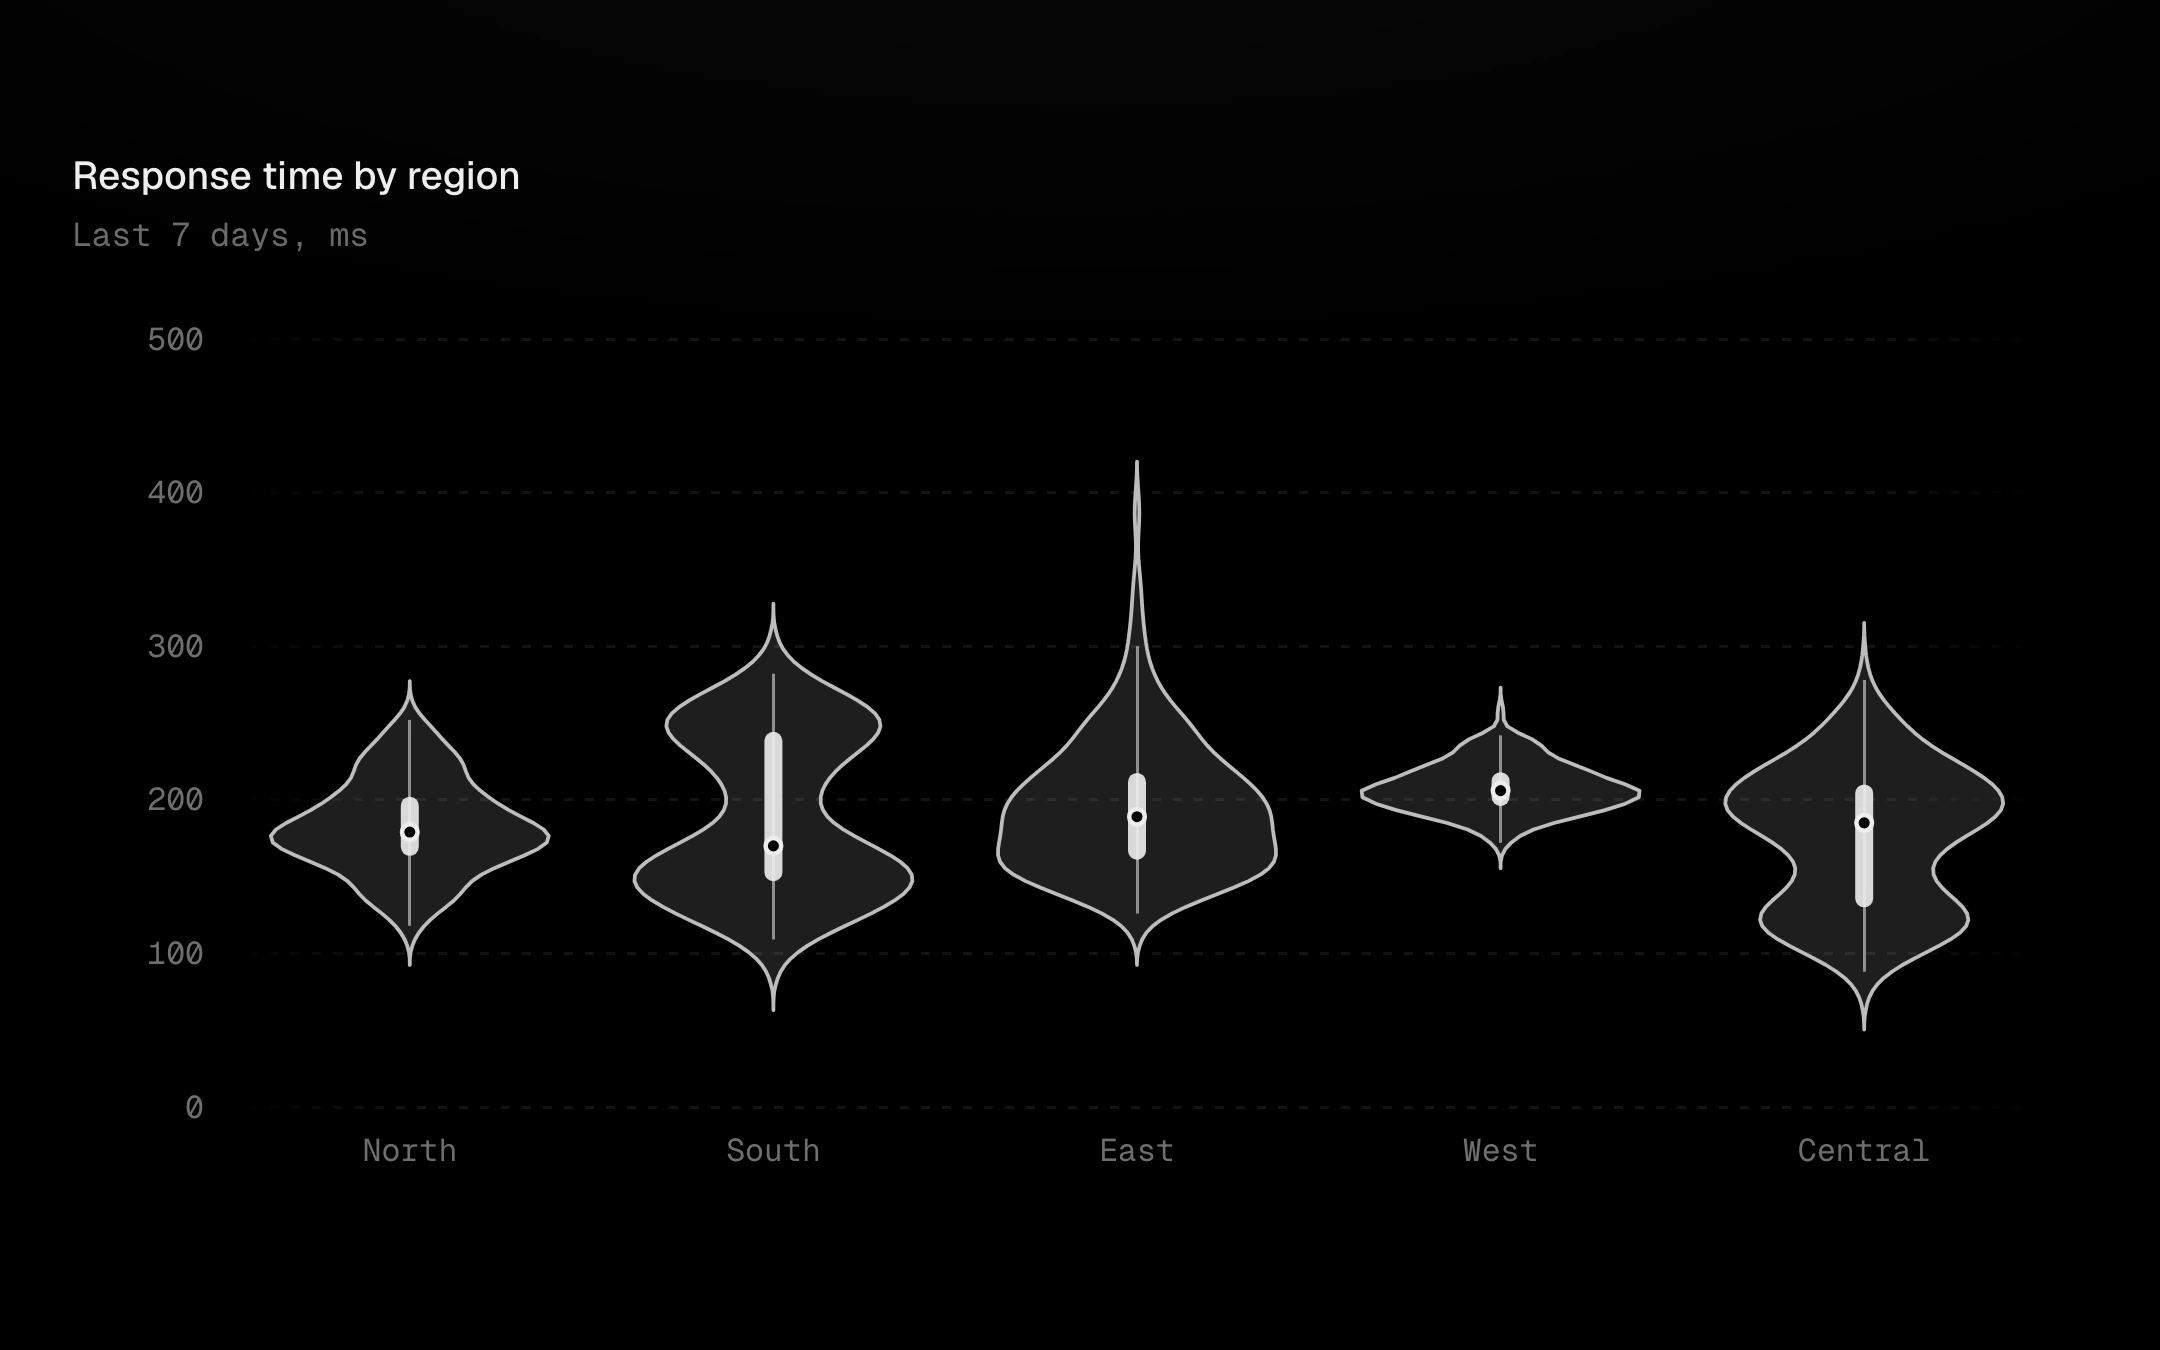
Kernel-density violins per group: each body is the distribution's shape mirrored about its axis, with a box inside (IQR bar, whiskers, a punched-out median) or dashed quartile rules, and an optional strip of the raw samples.
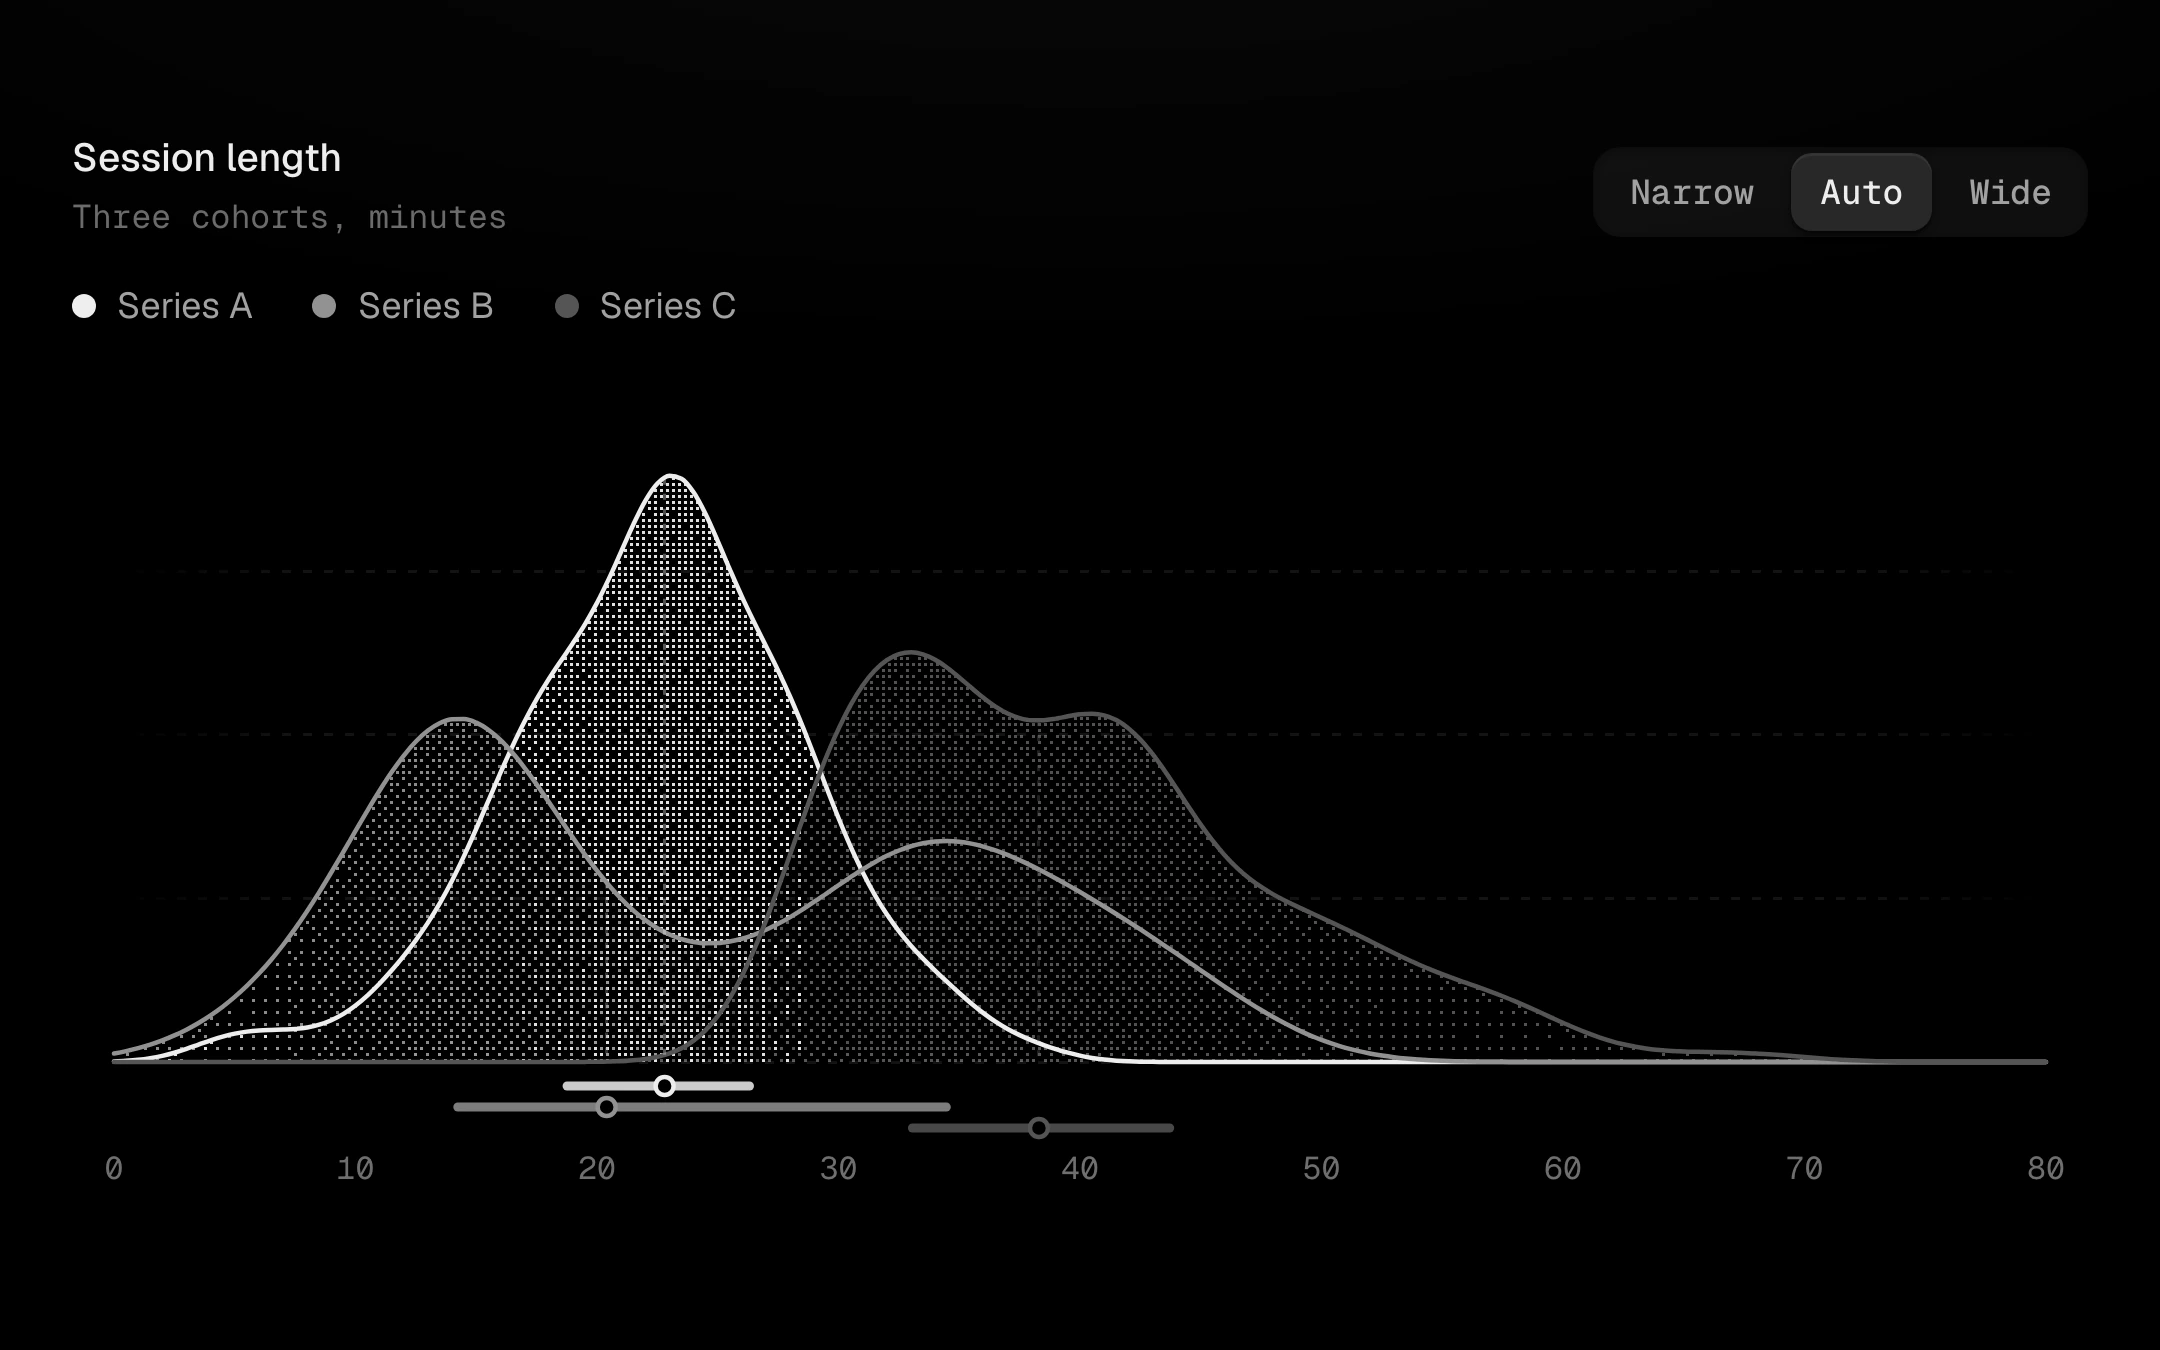
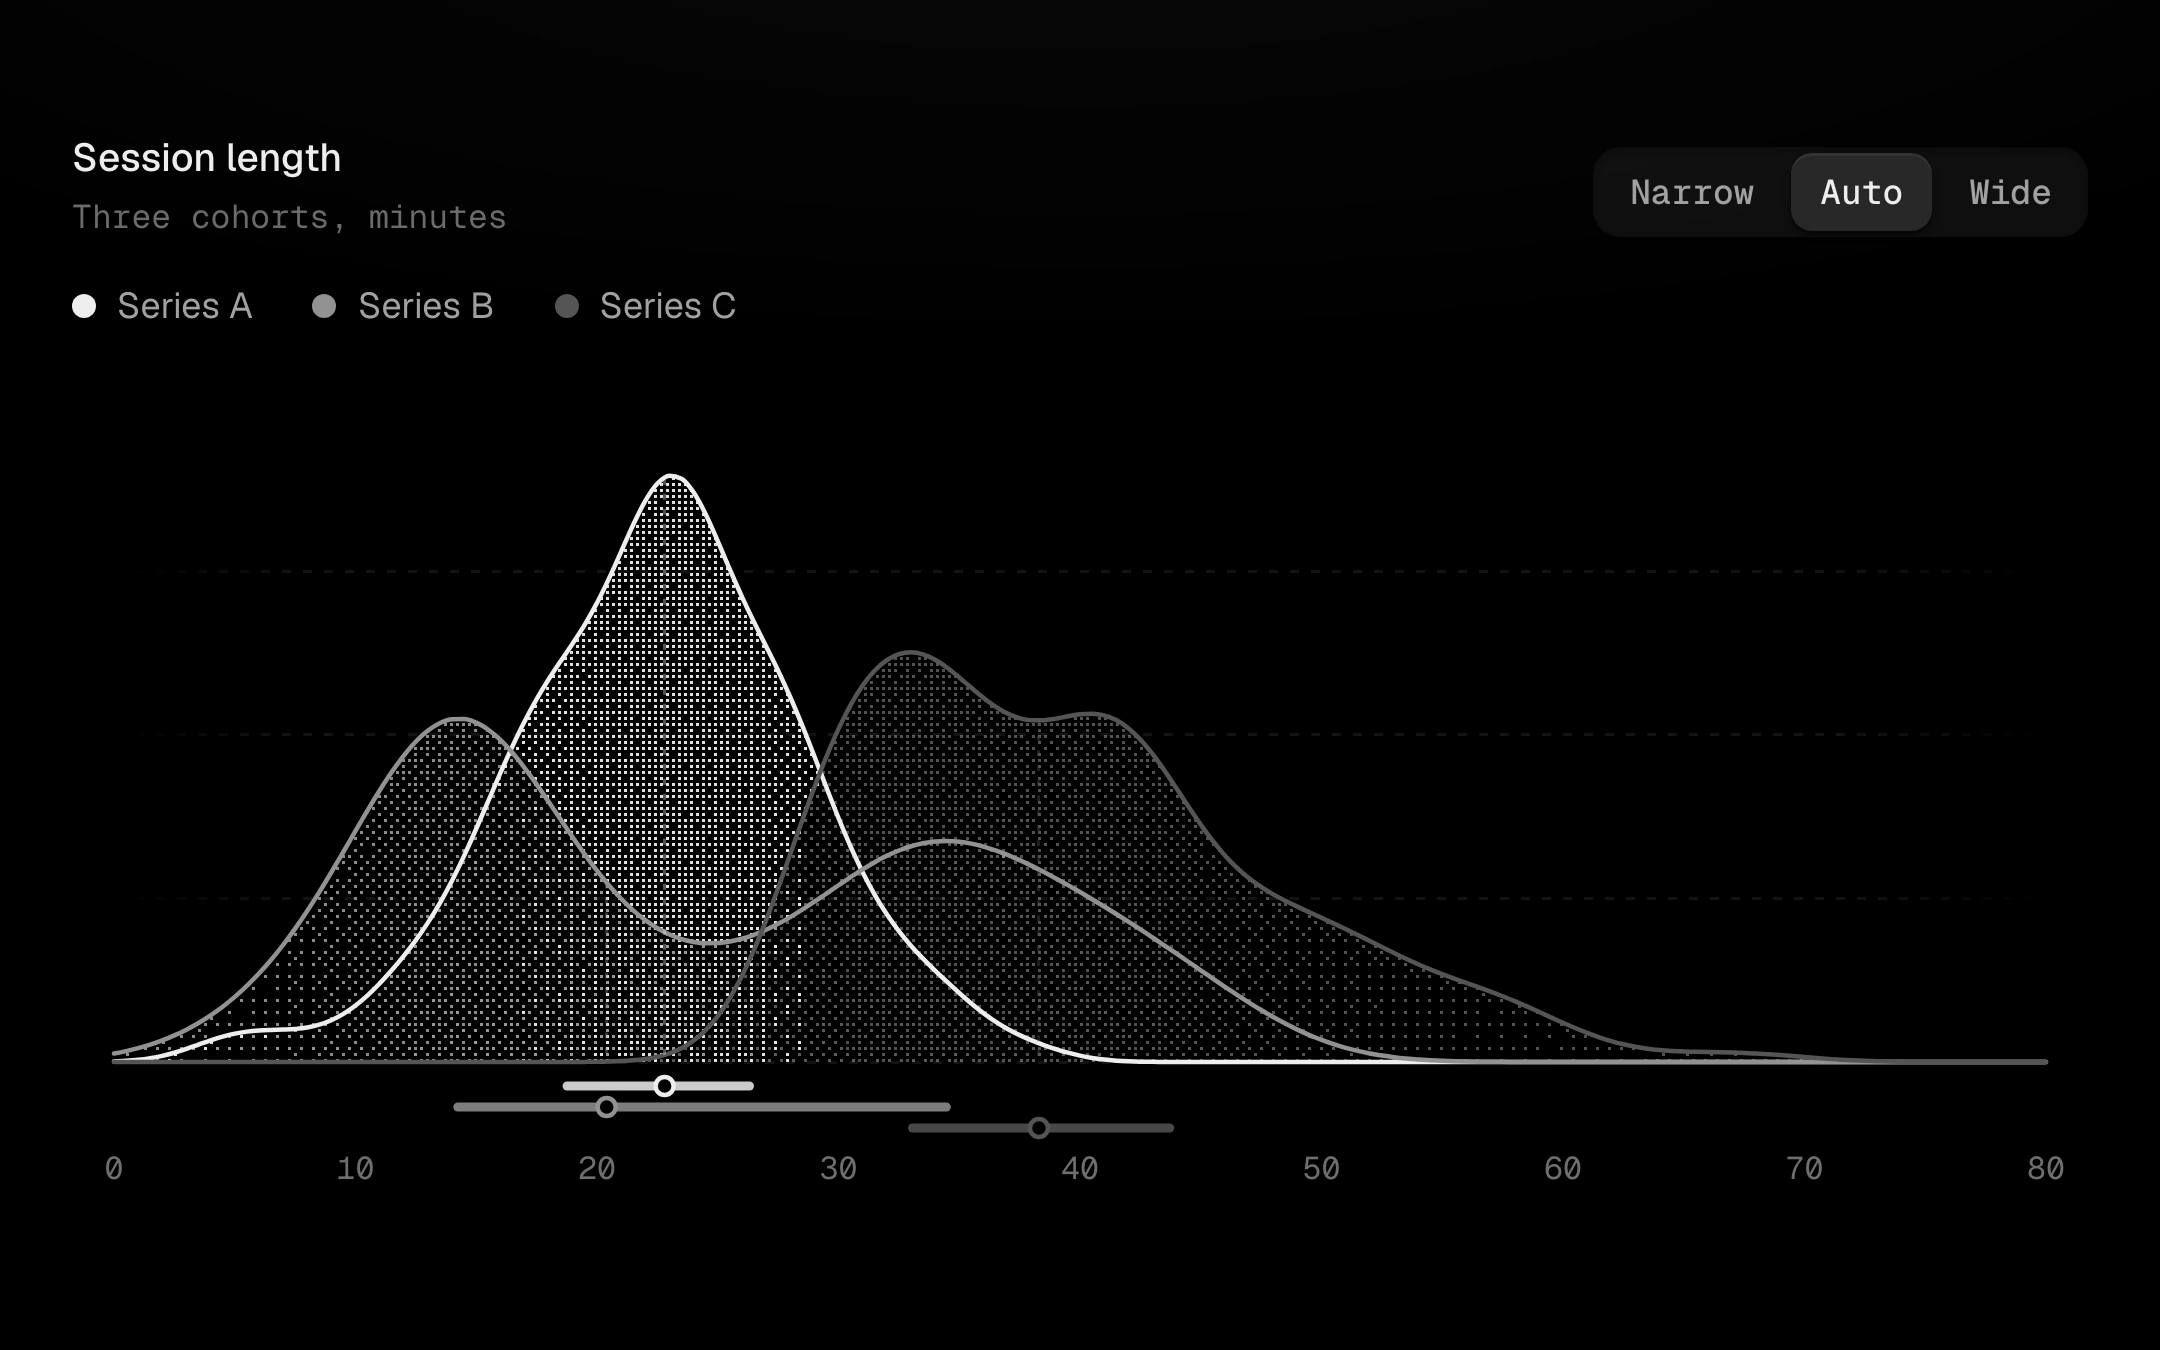
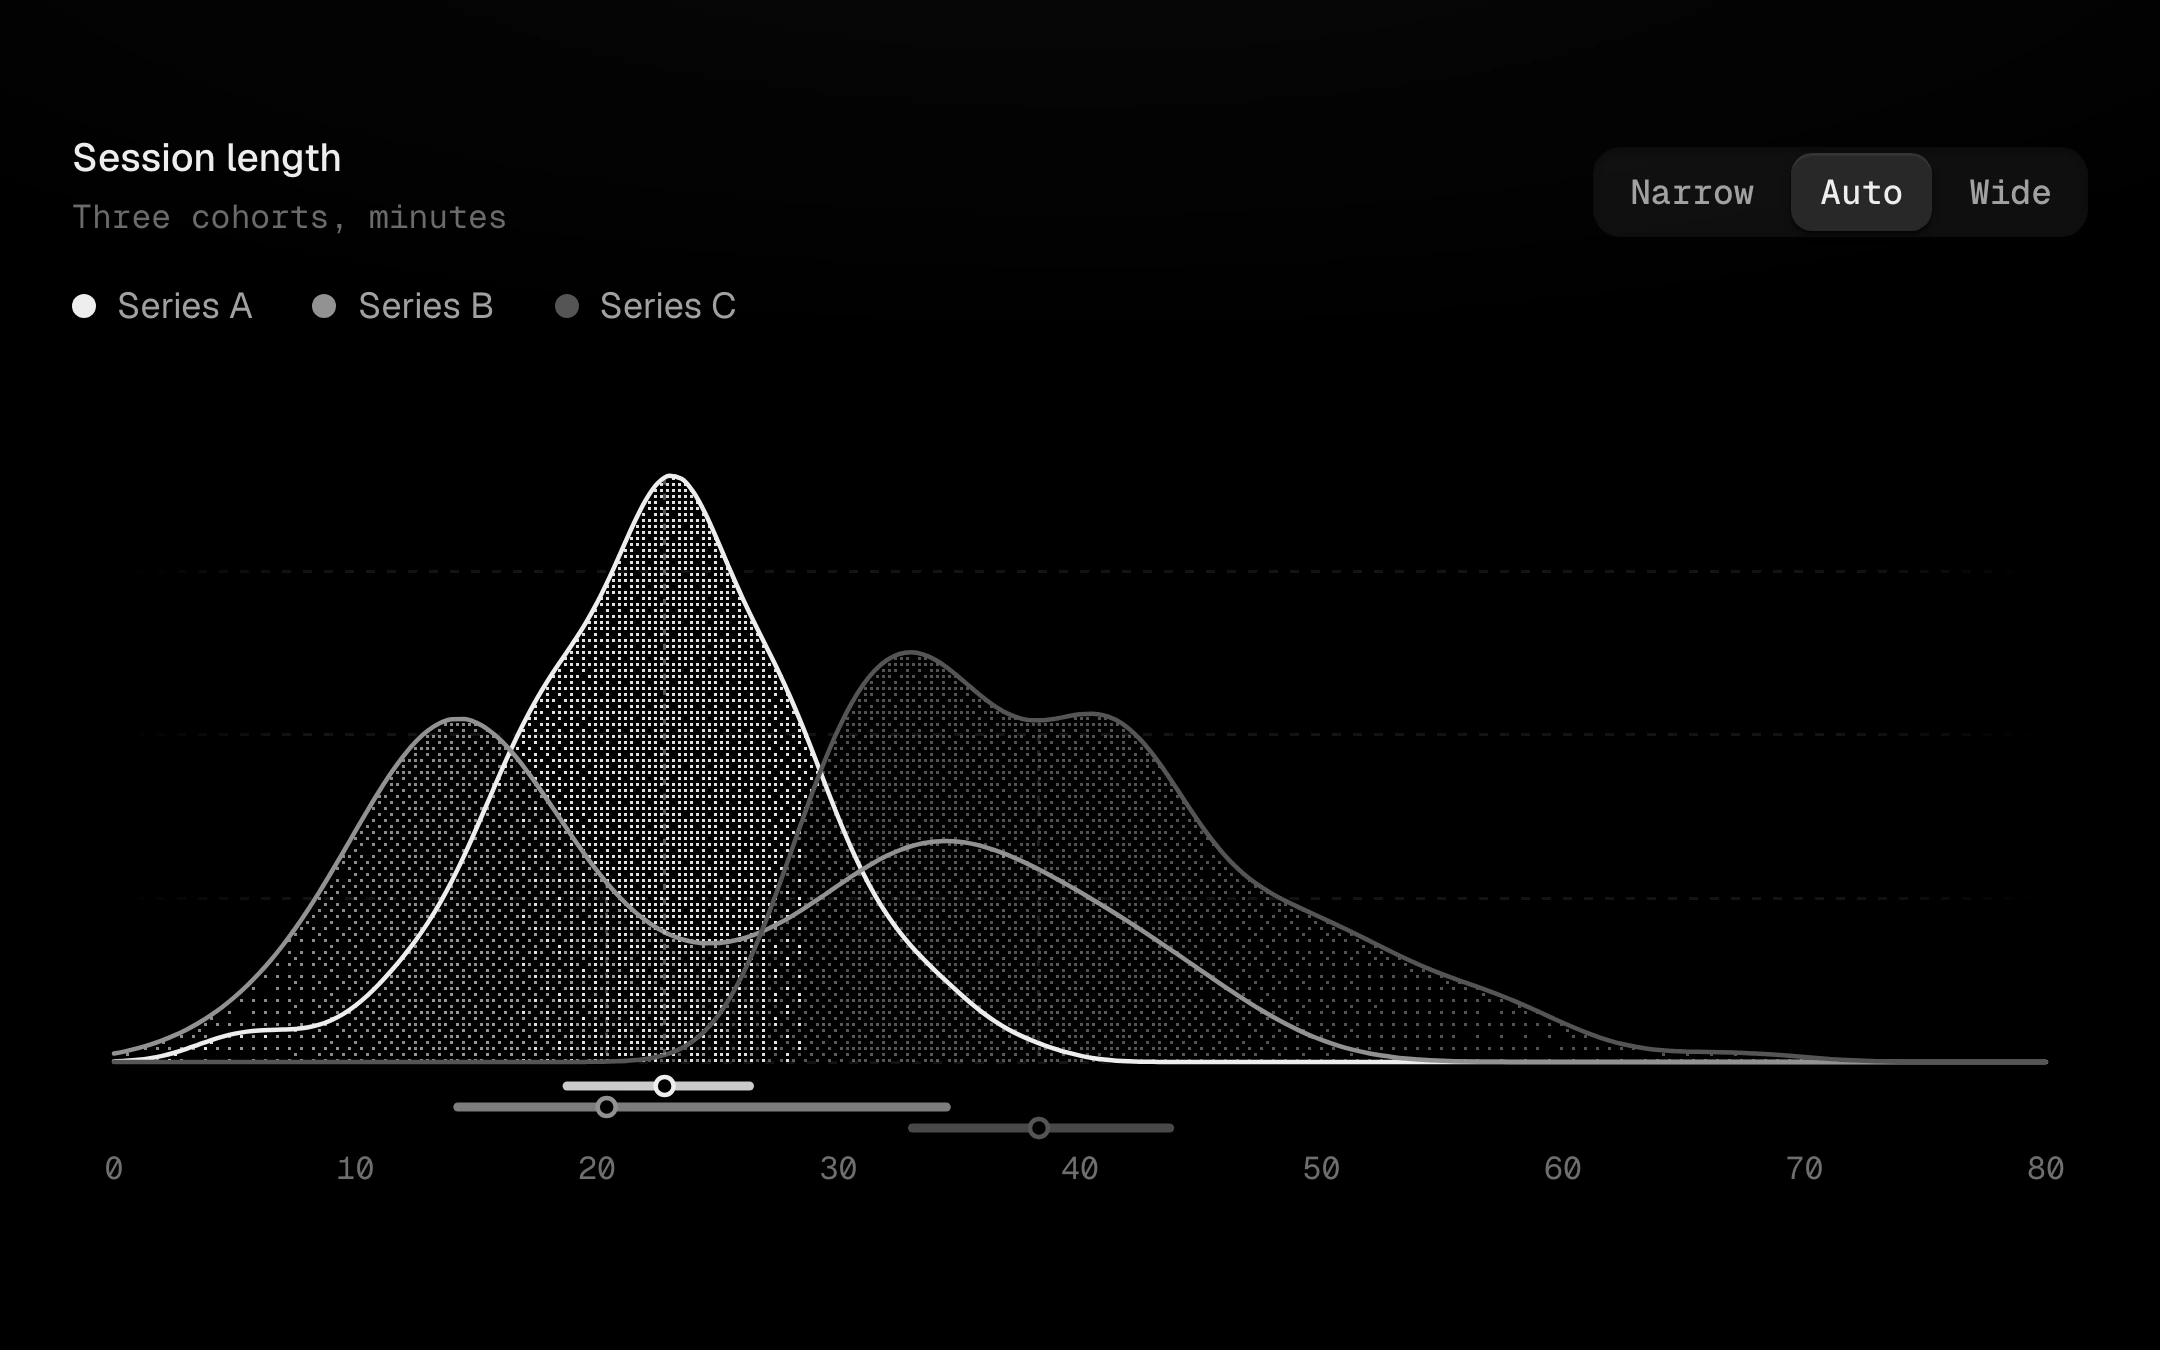
Smooth kernel-density curves, overlaid on one baseline or stacked as ridges that occlude the row behind.
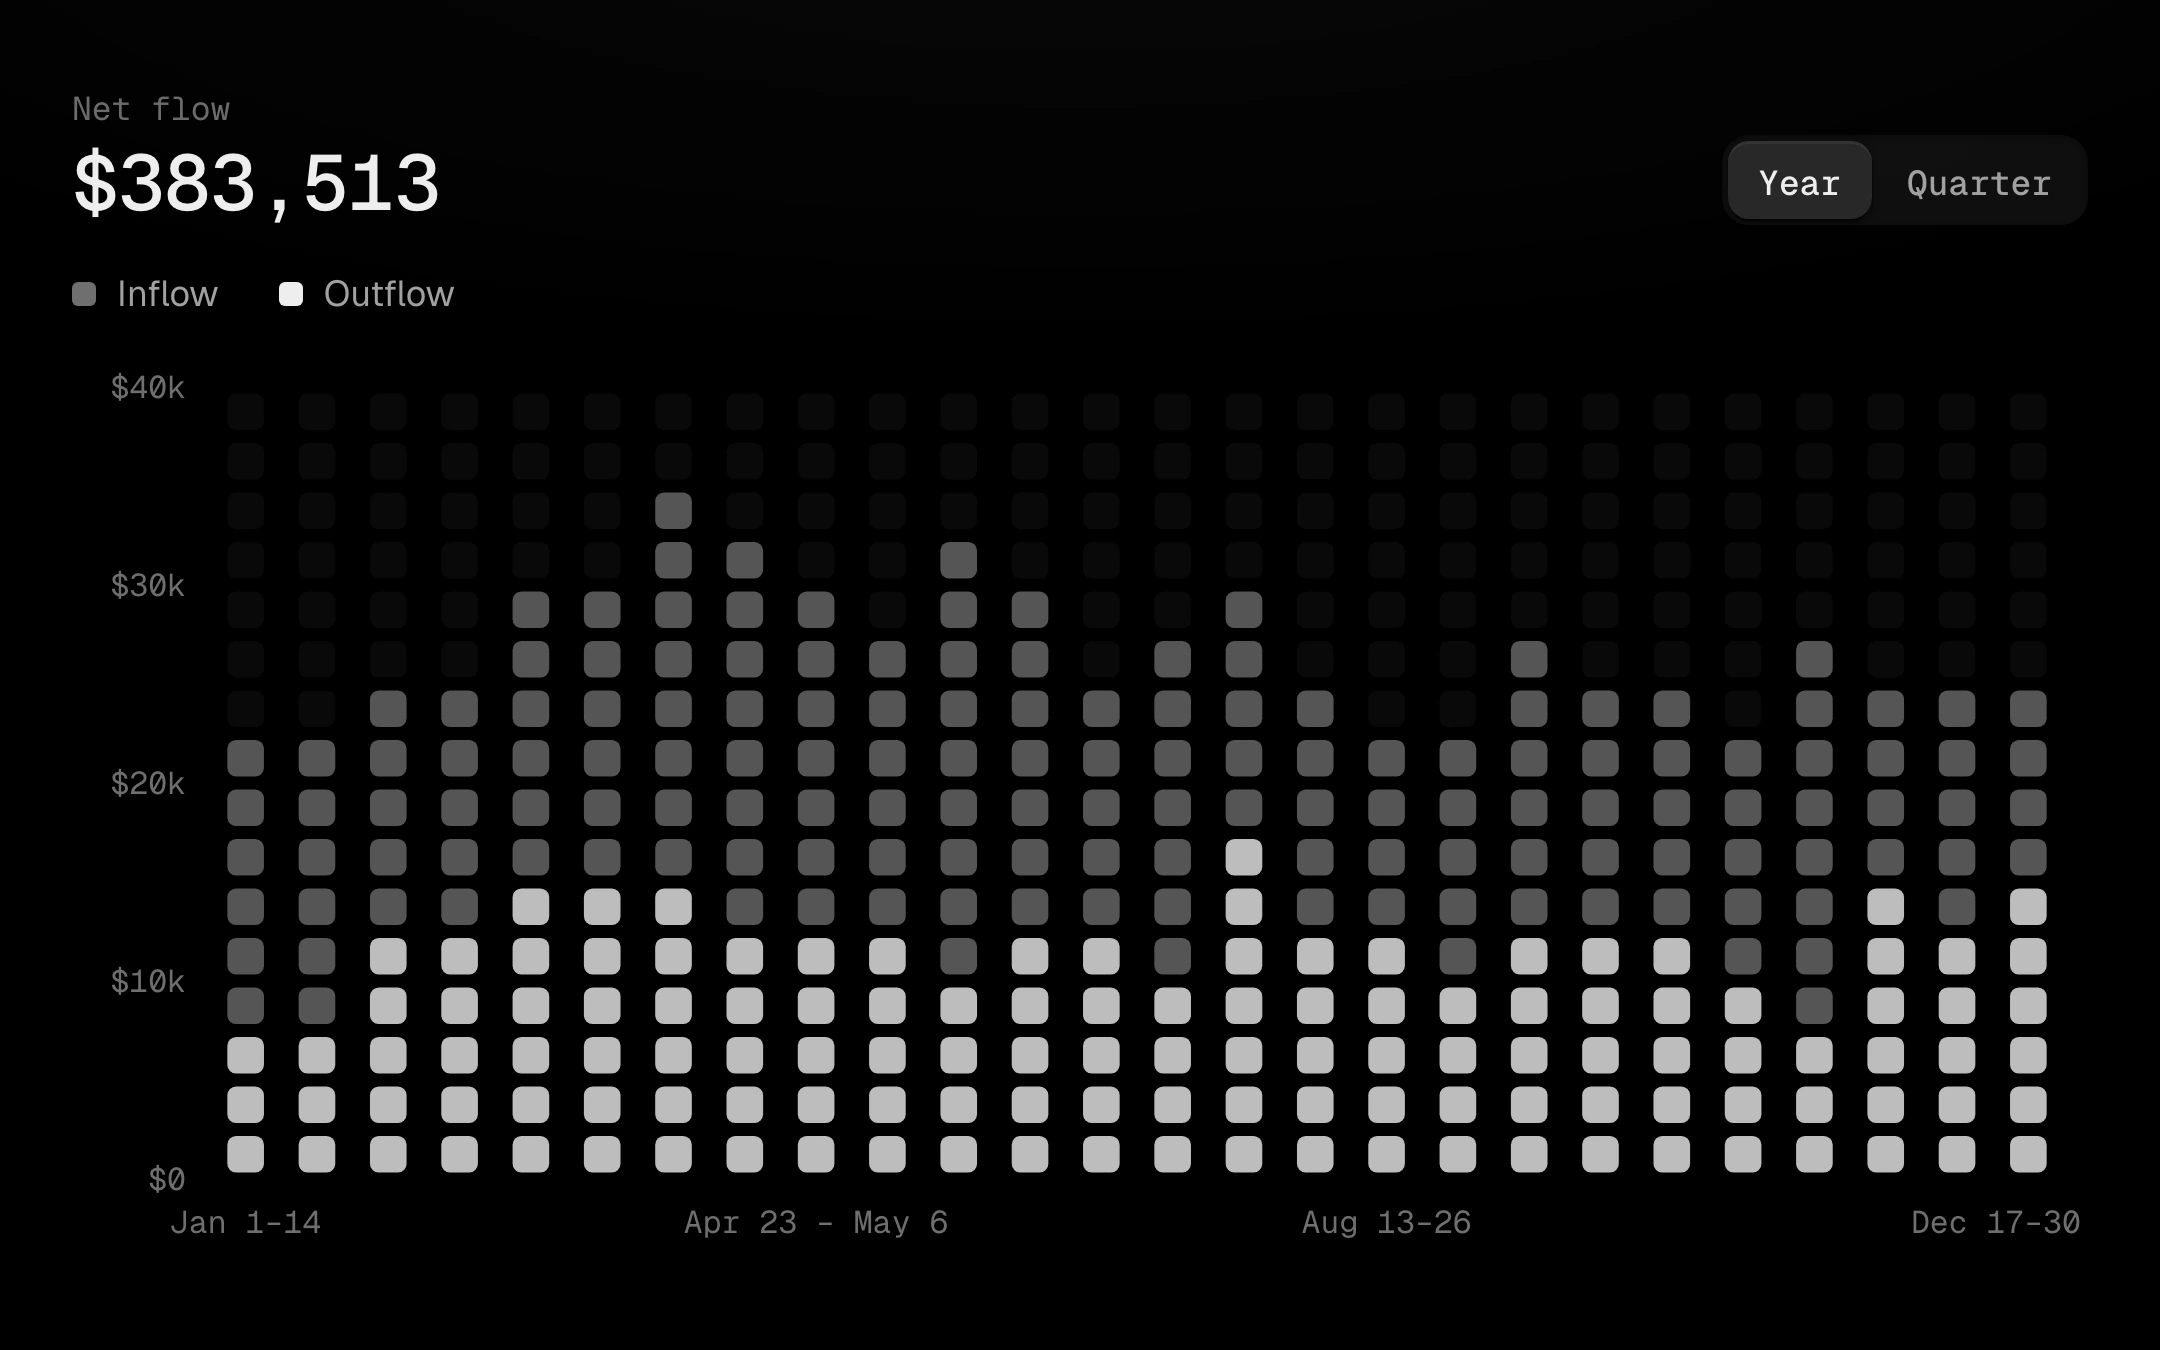
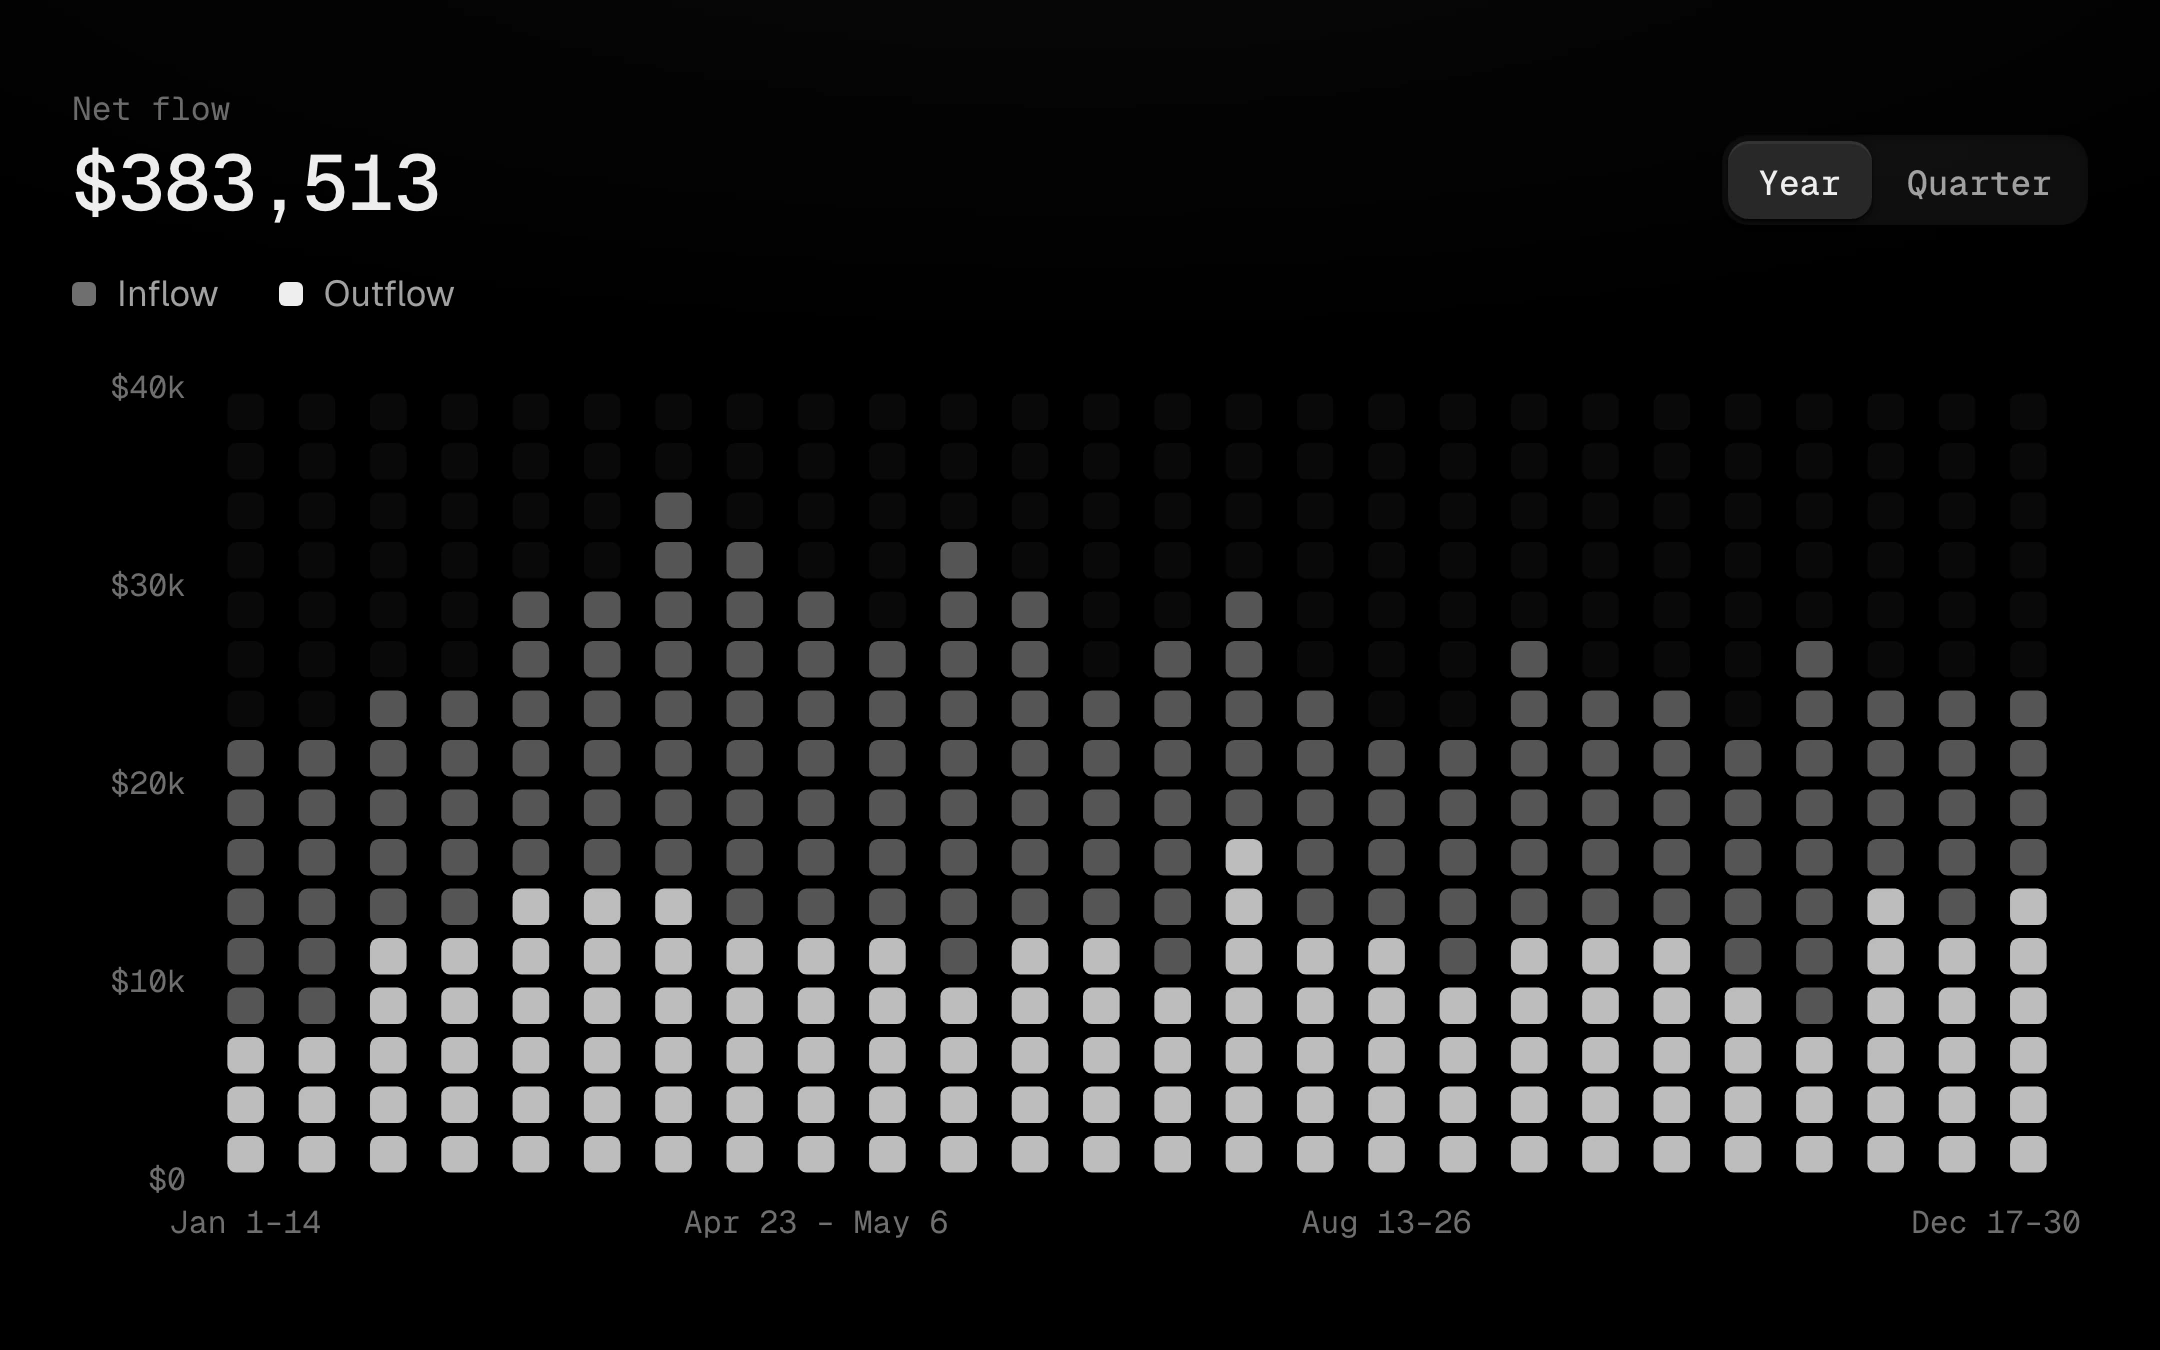
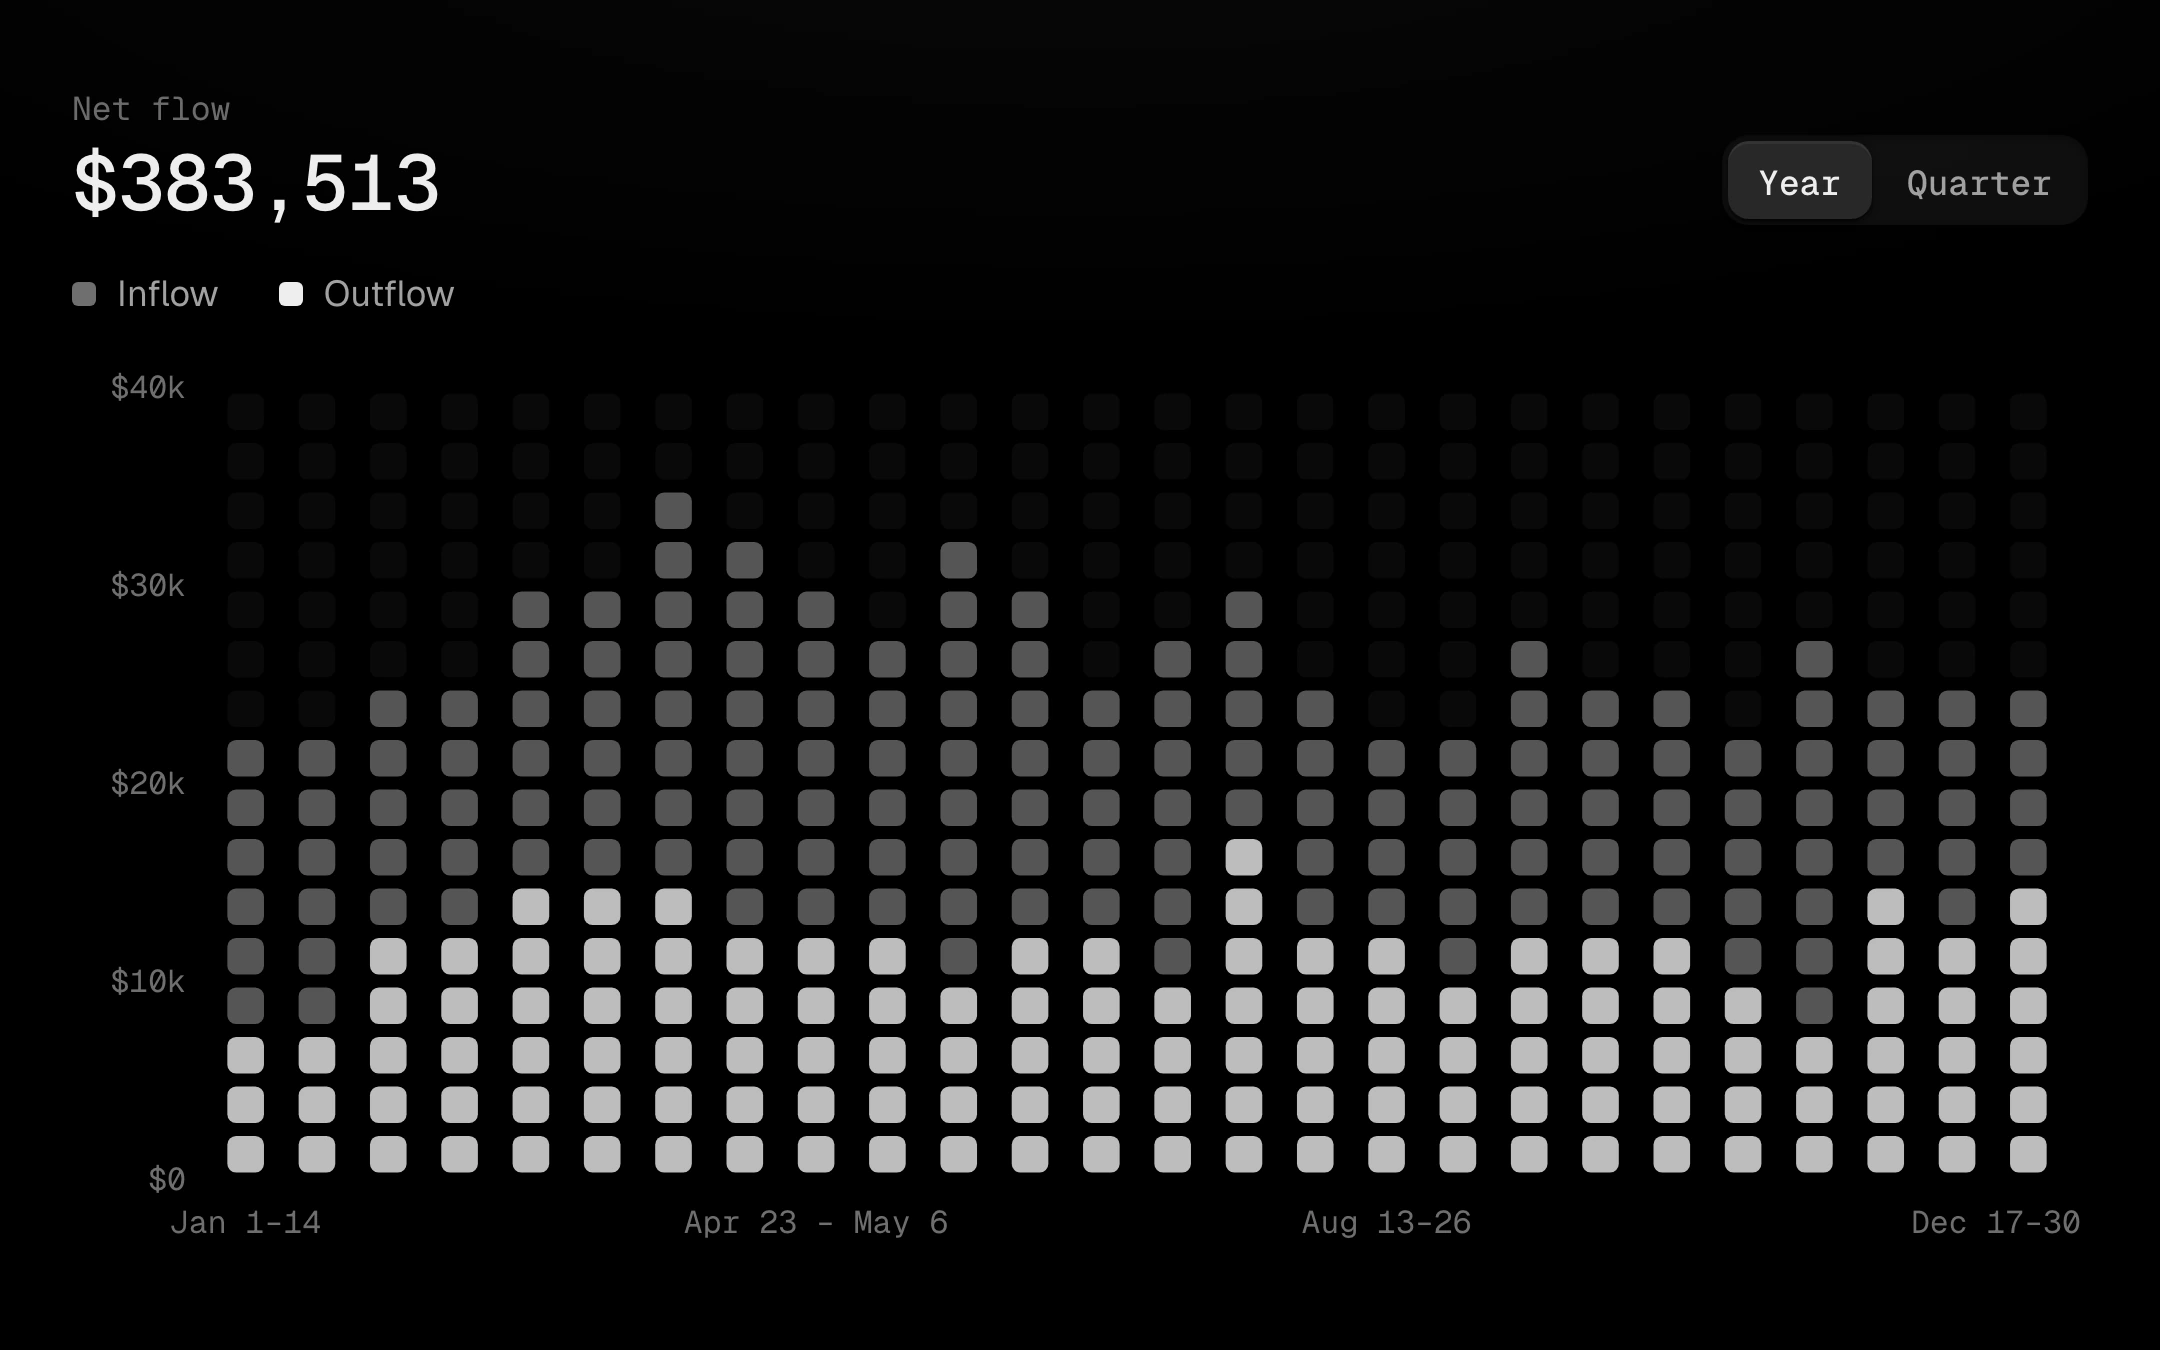
A unit chart: every period is a column of equal-value squares, so one square is always the same amount and nothing can be exaggerated.
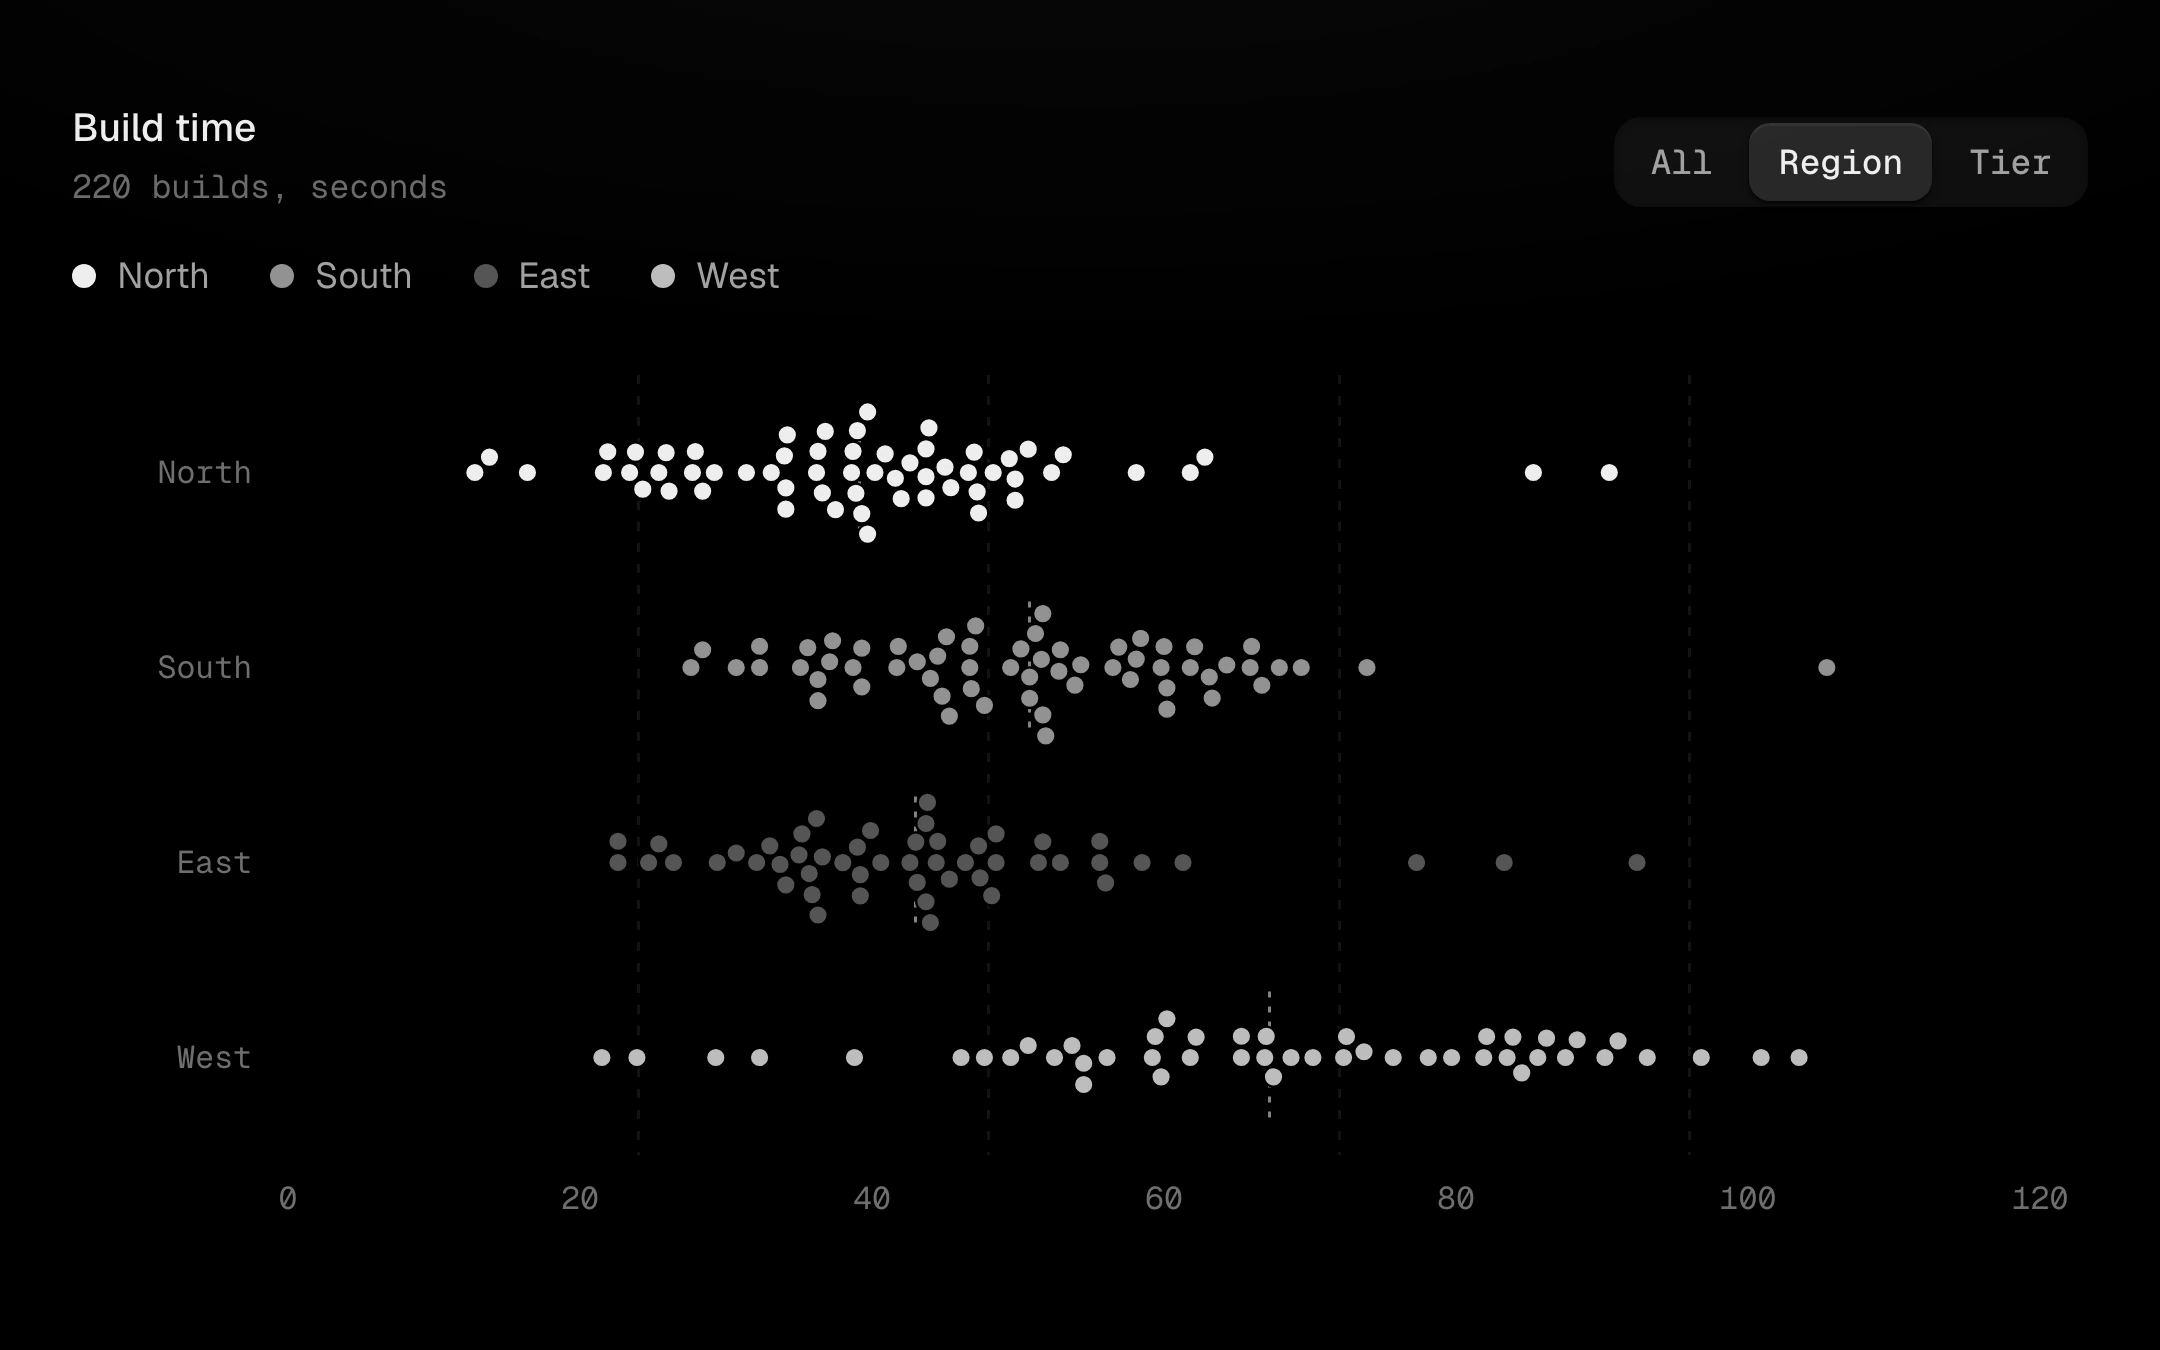
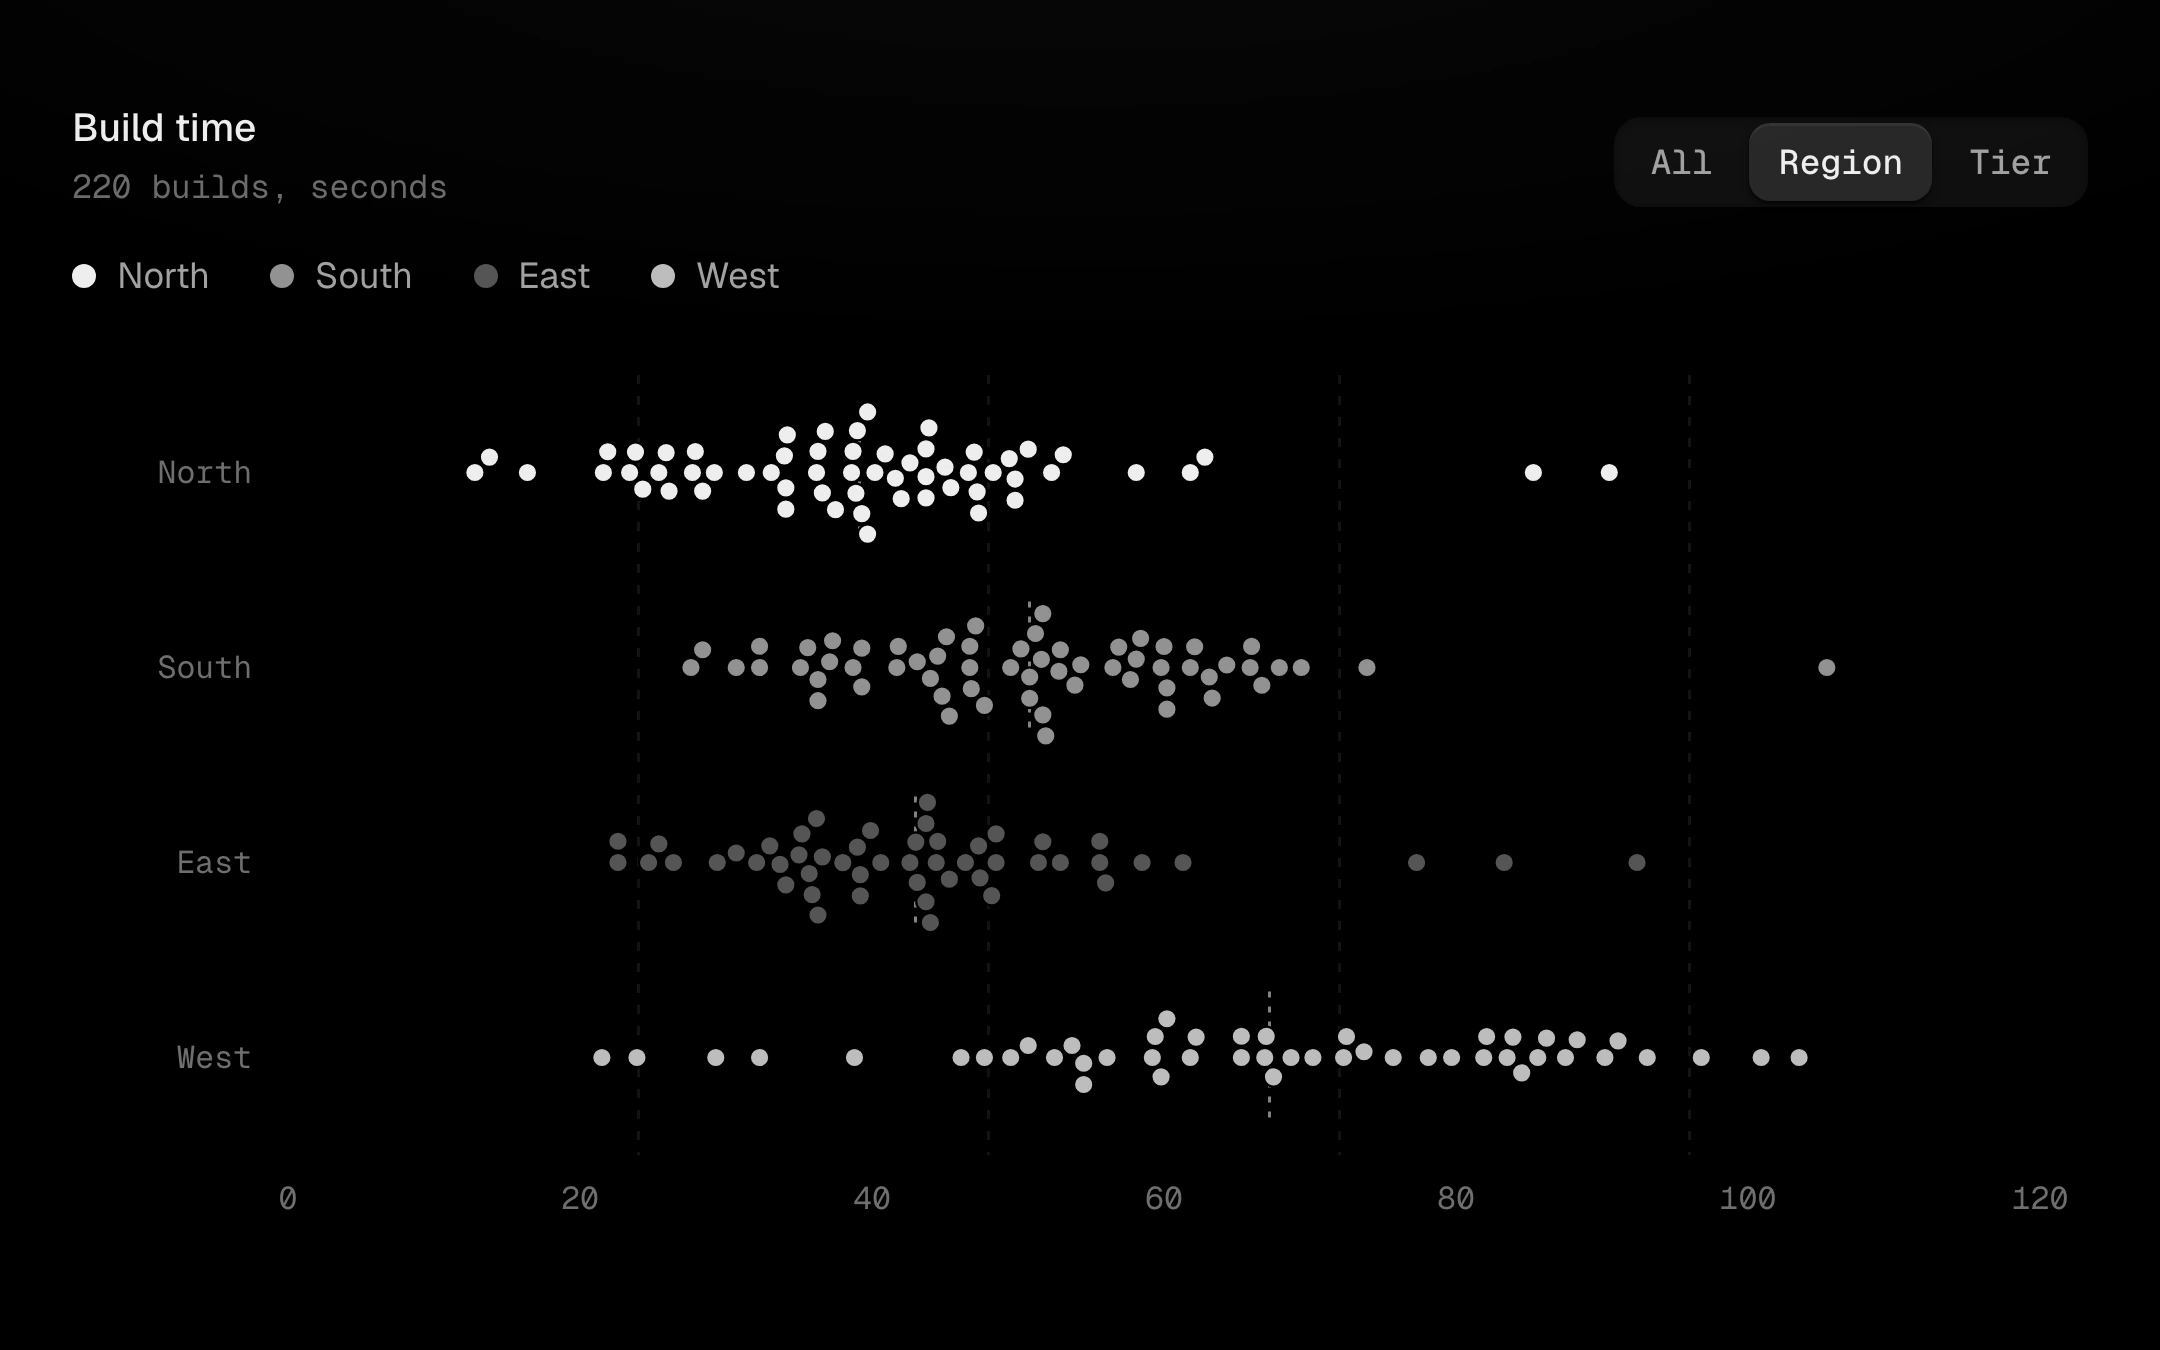
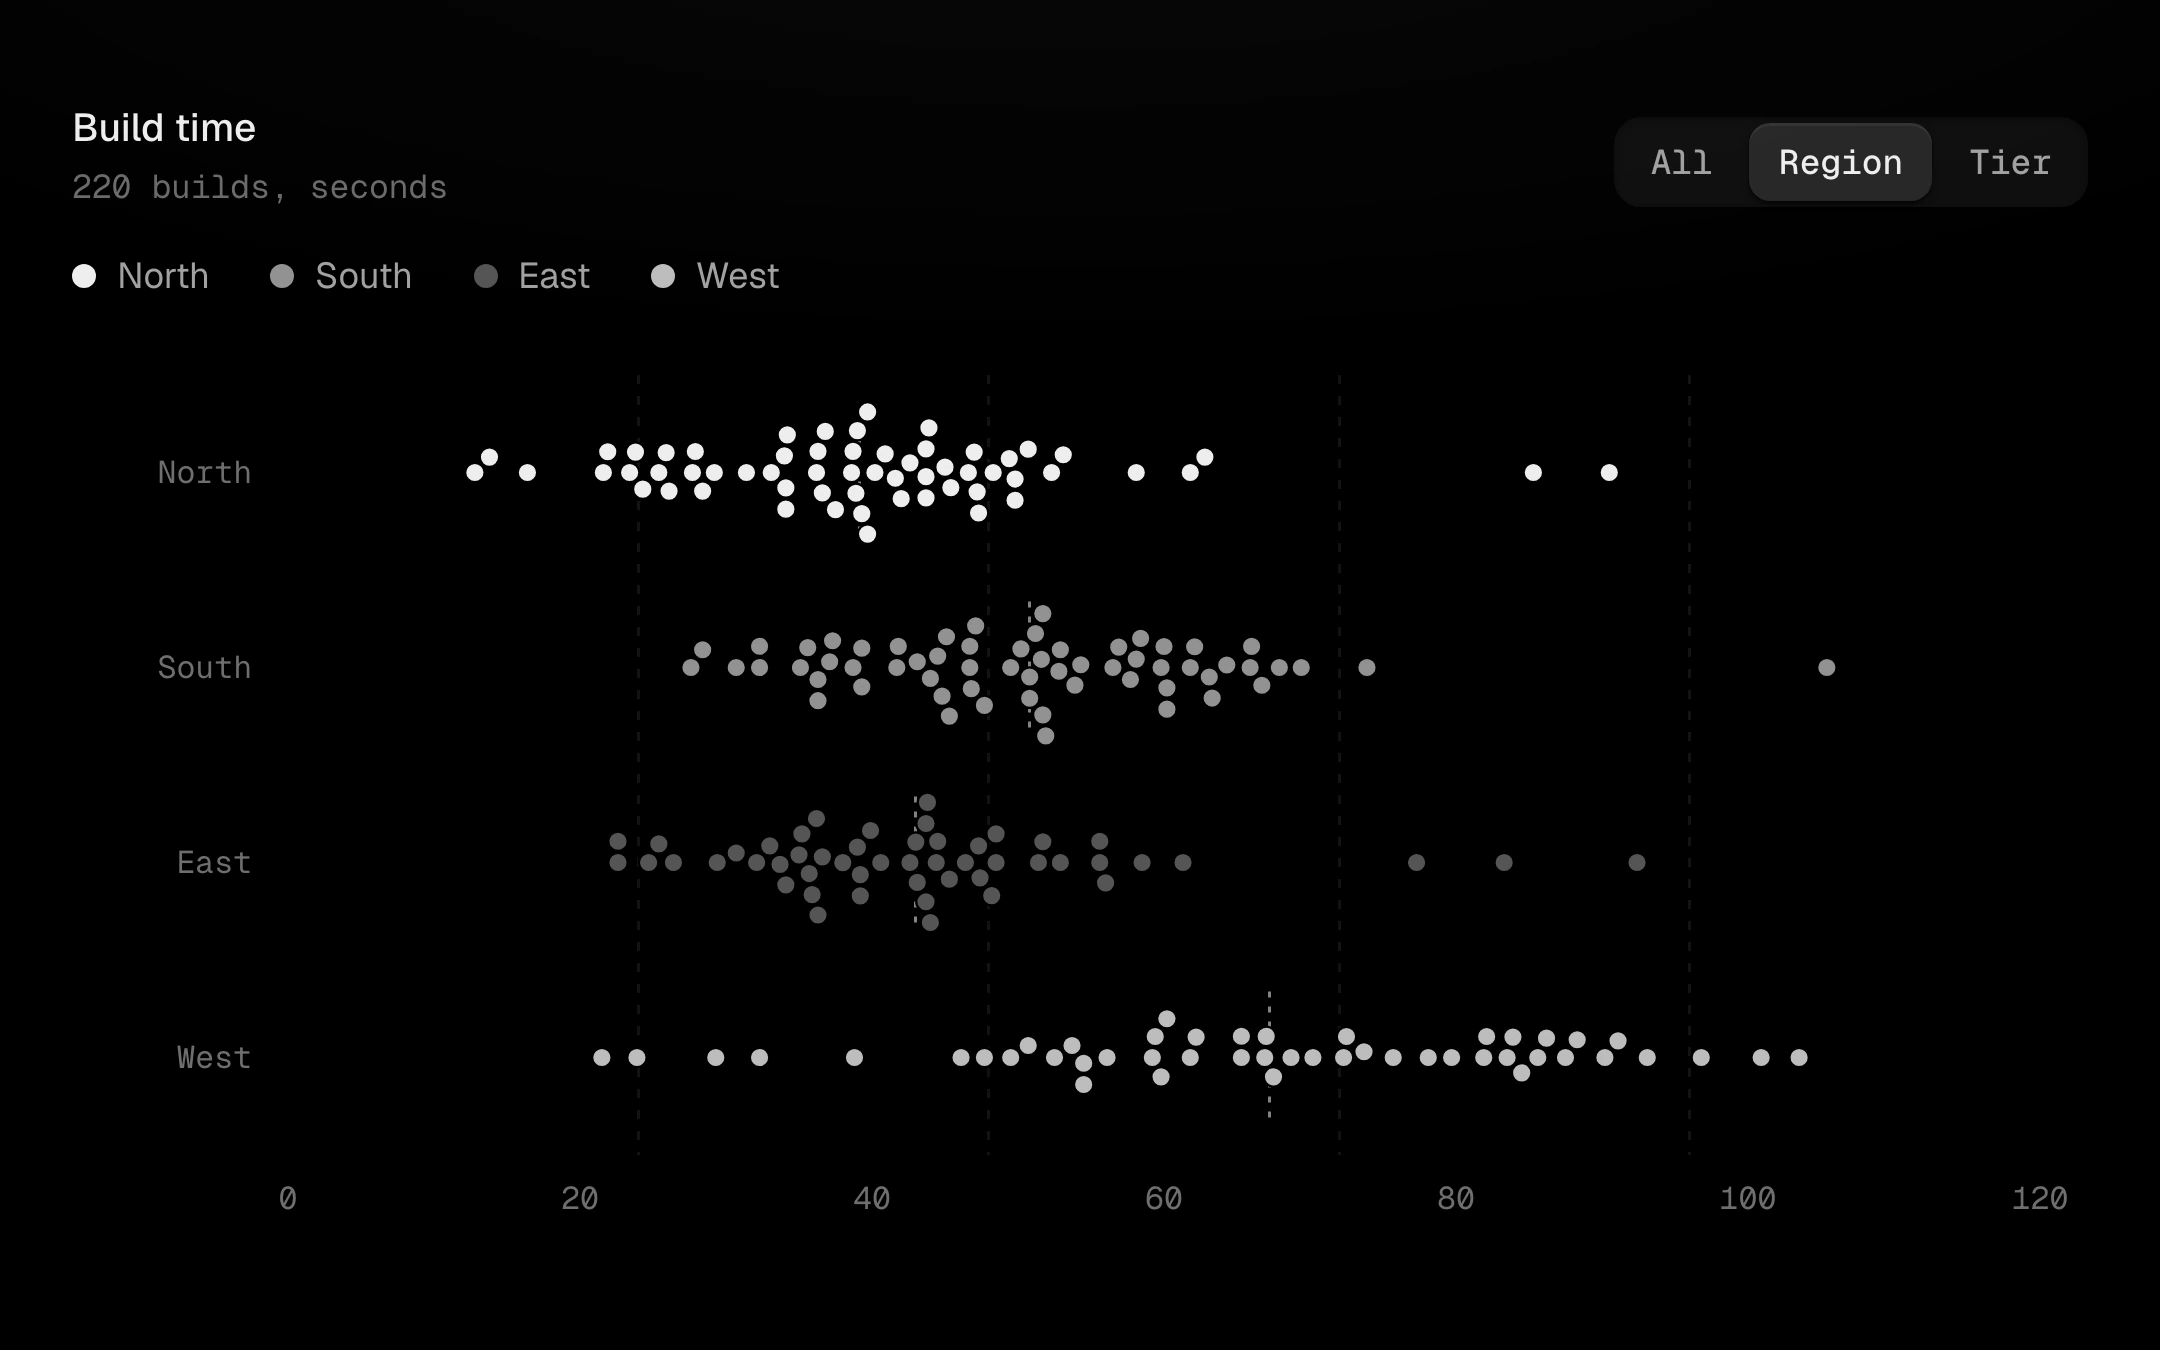
A deterministic swarm plot: every sample is a dot on the value axis, nudged up or down just enough not to touch its neighbours, so the outline of each swarm is the distribution and every point can still be pointed at.
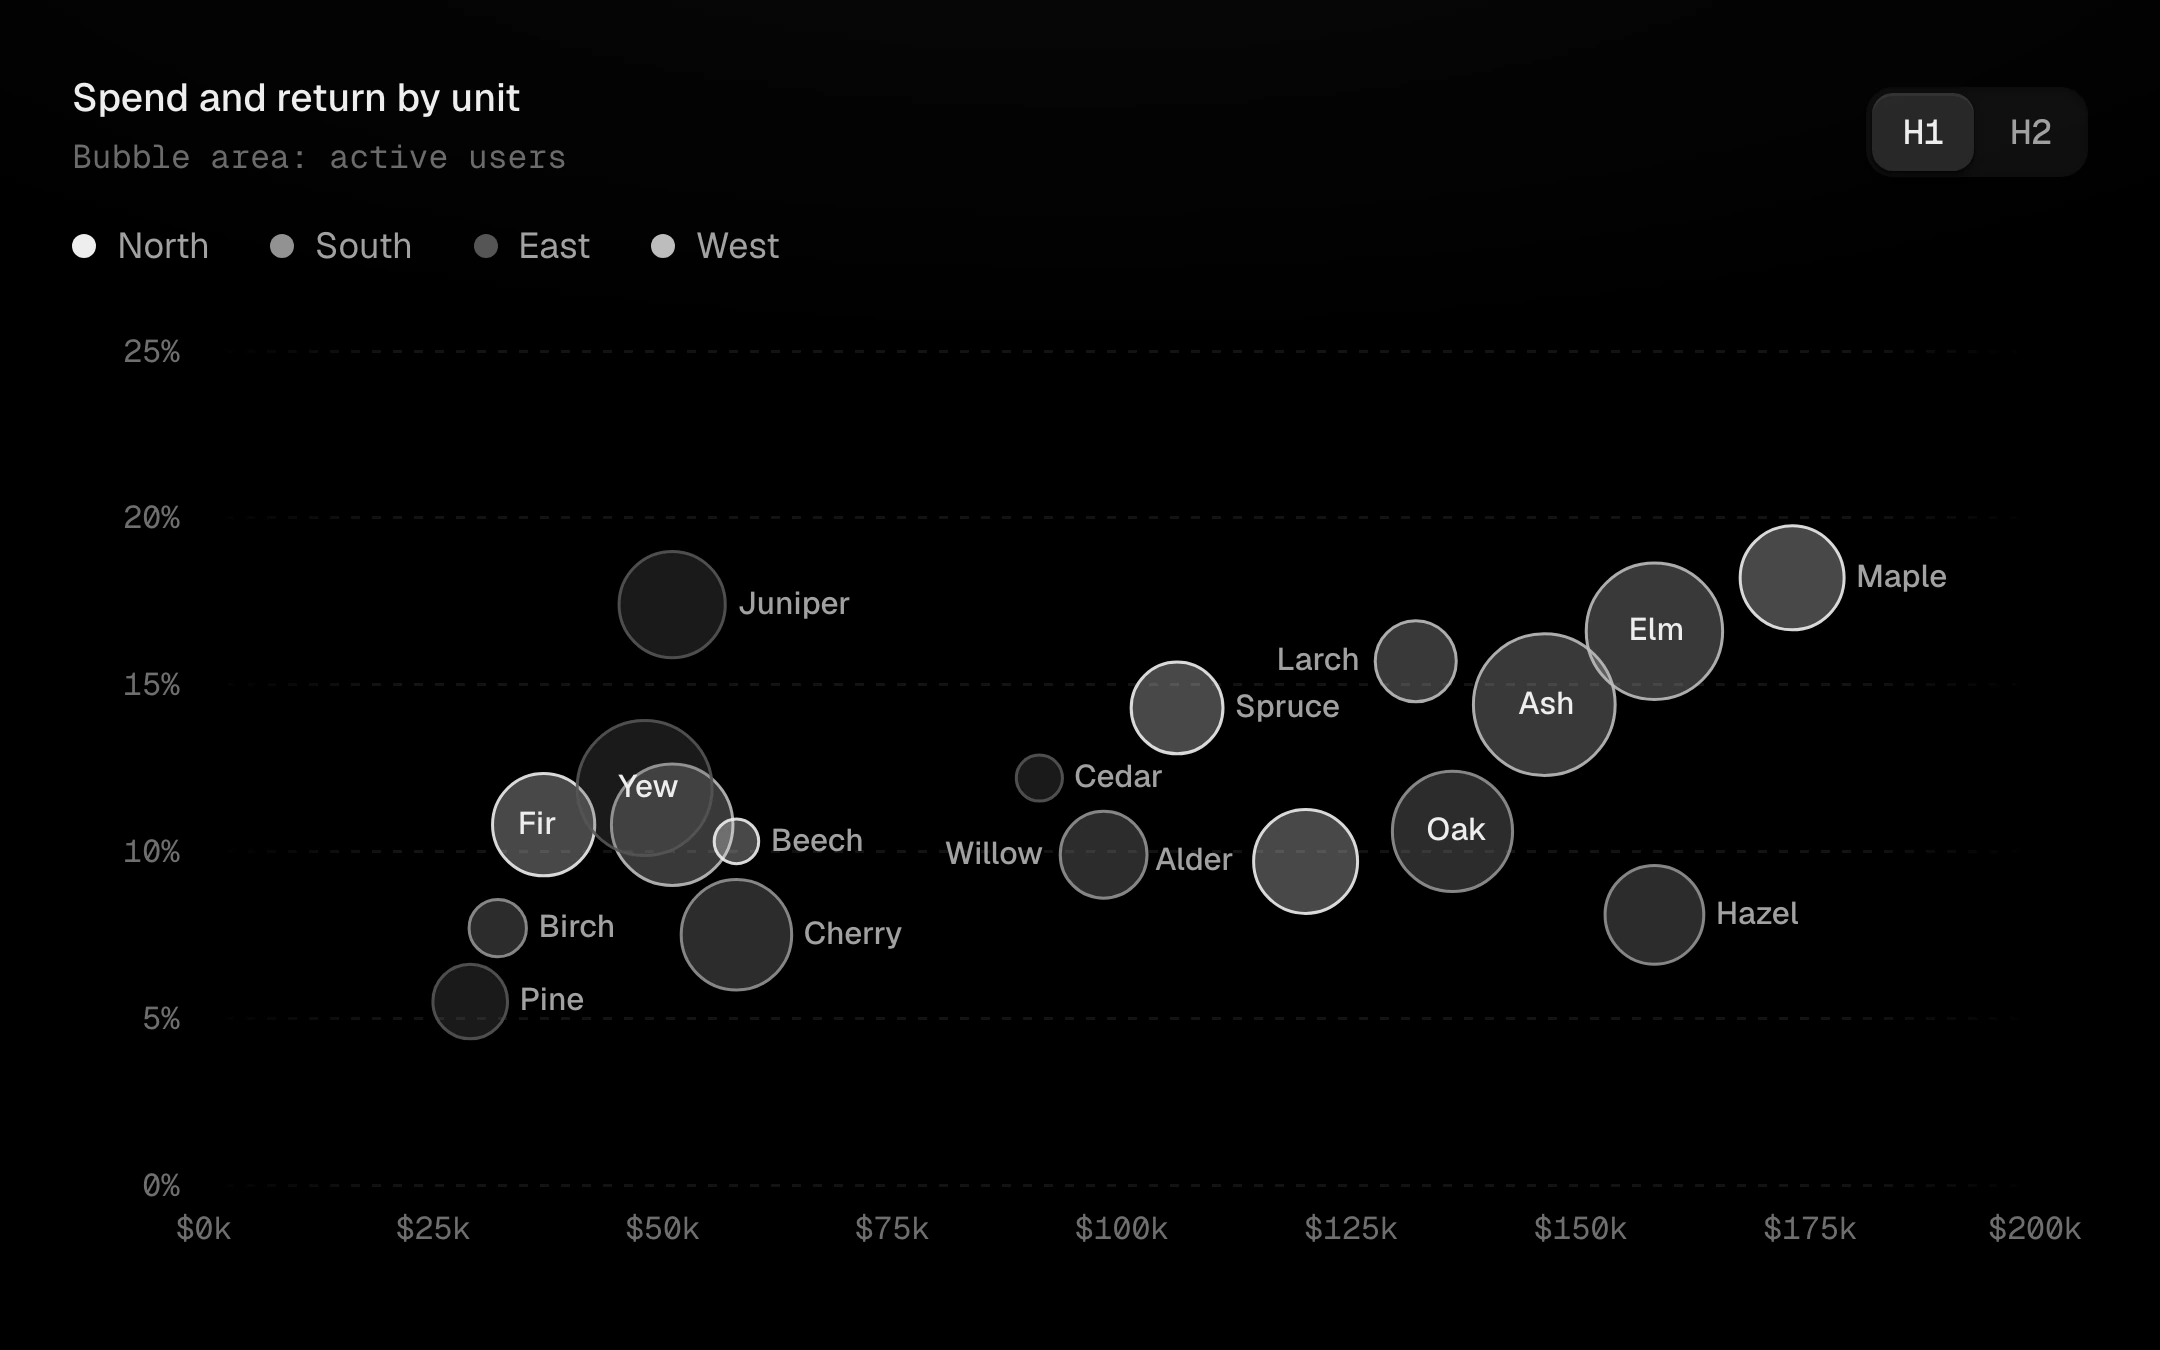
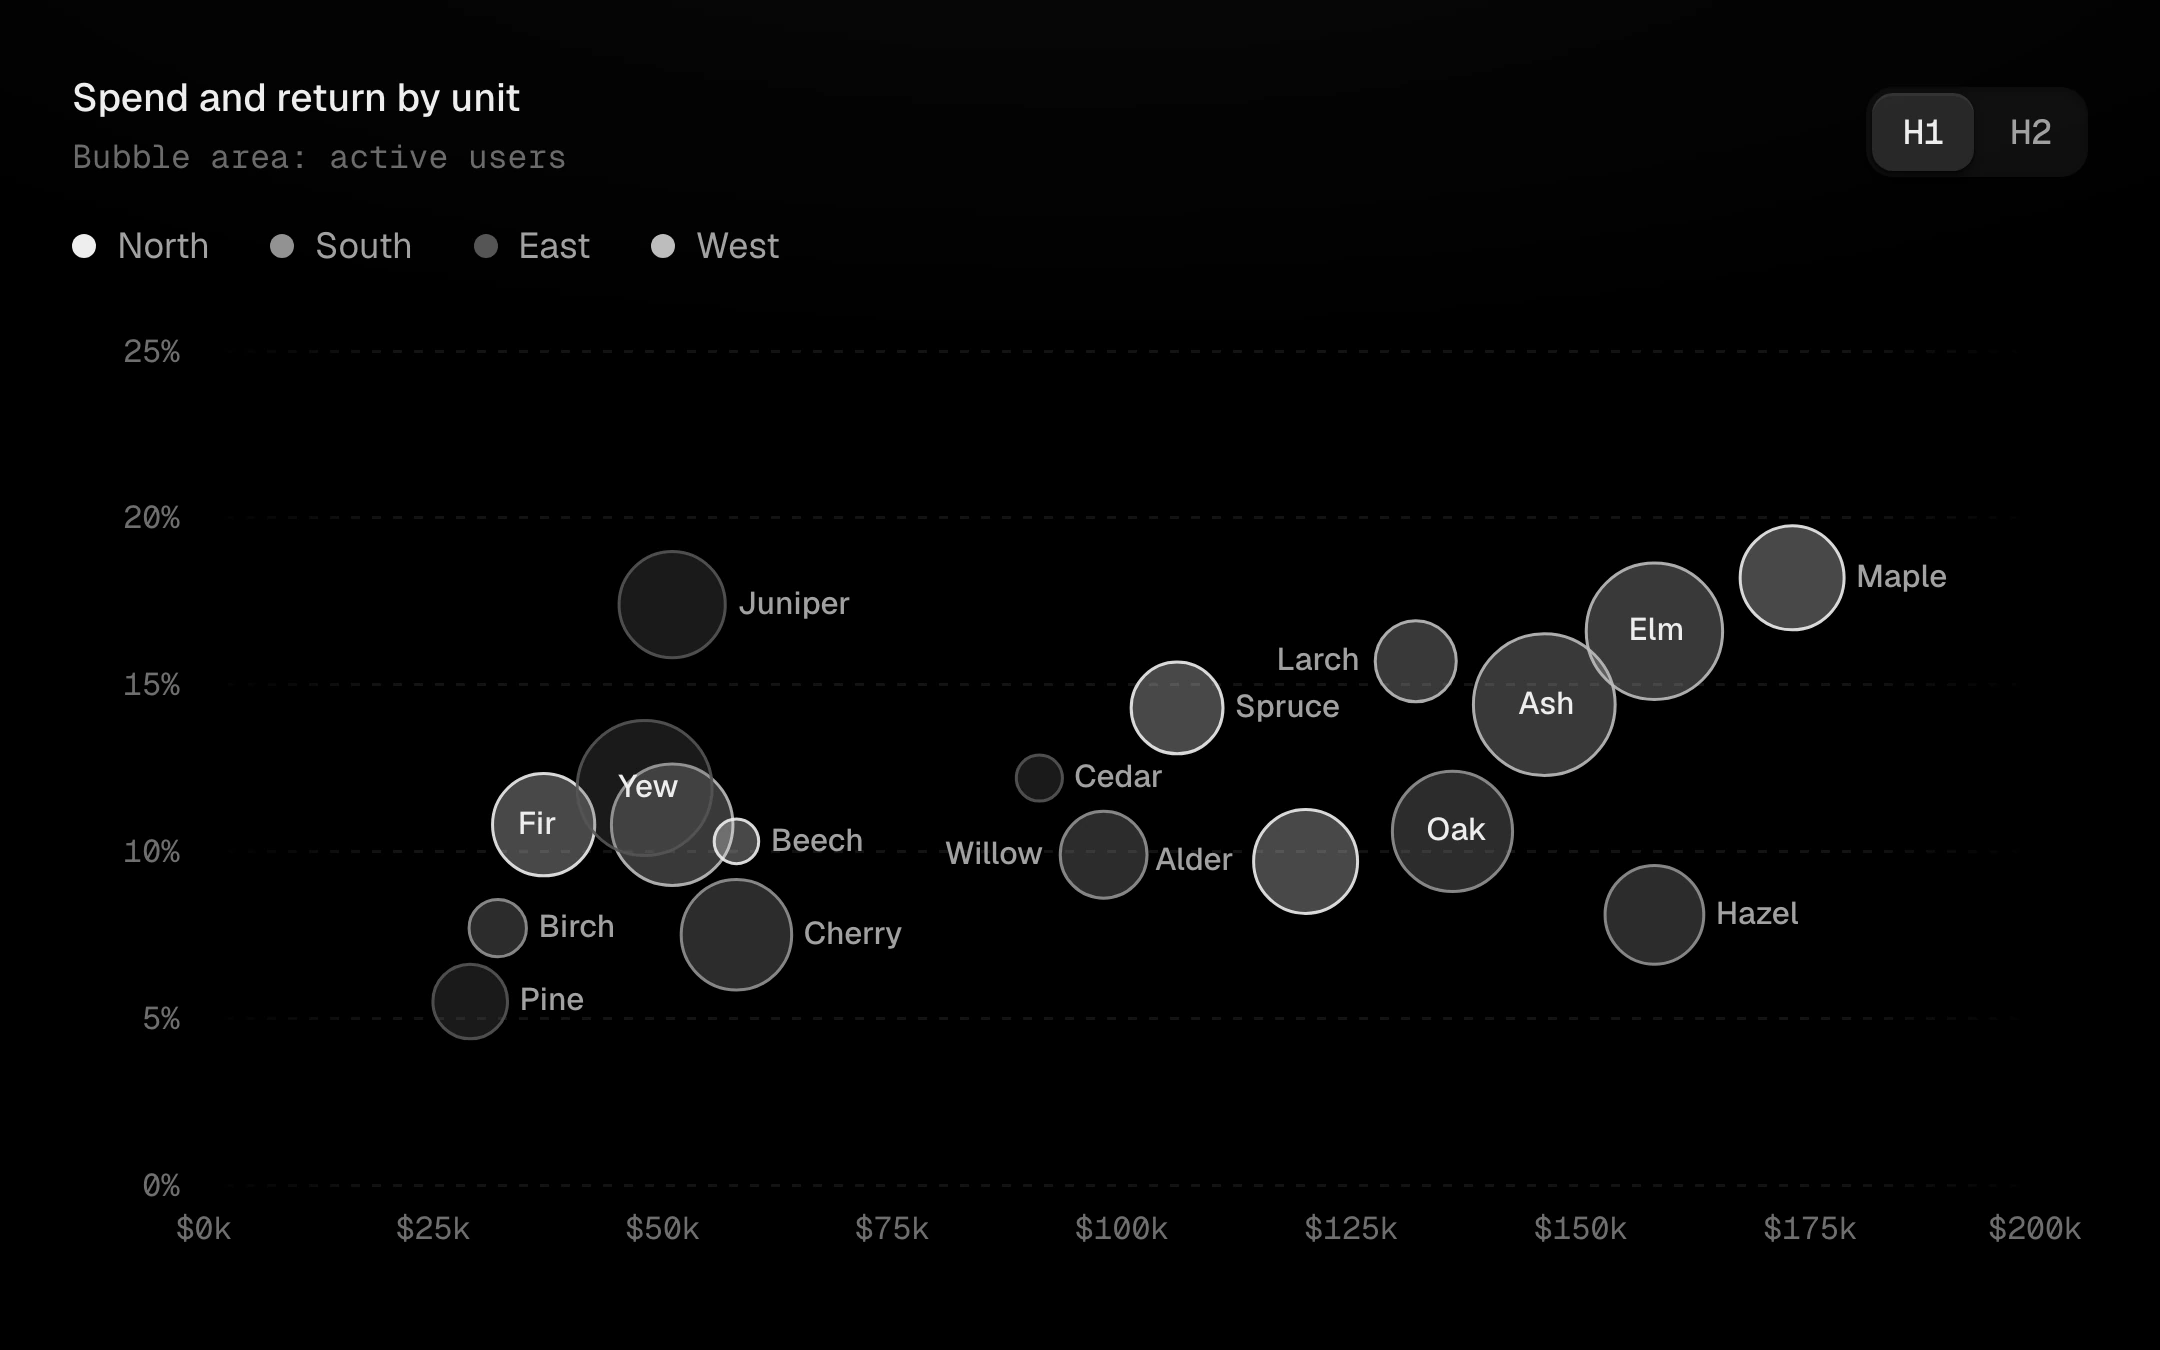
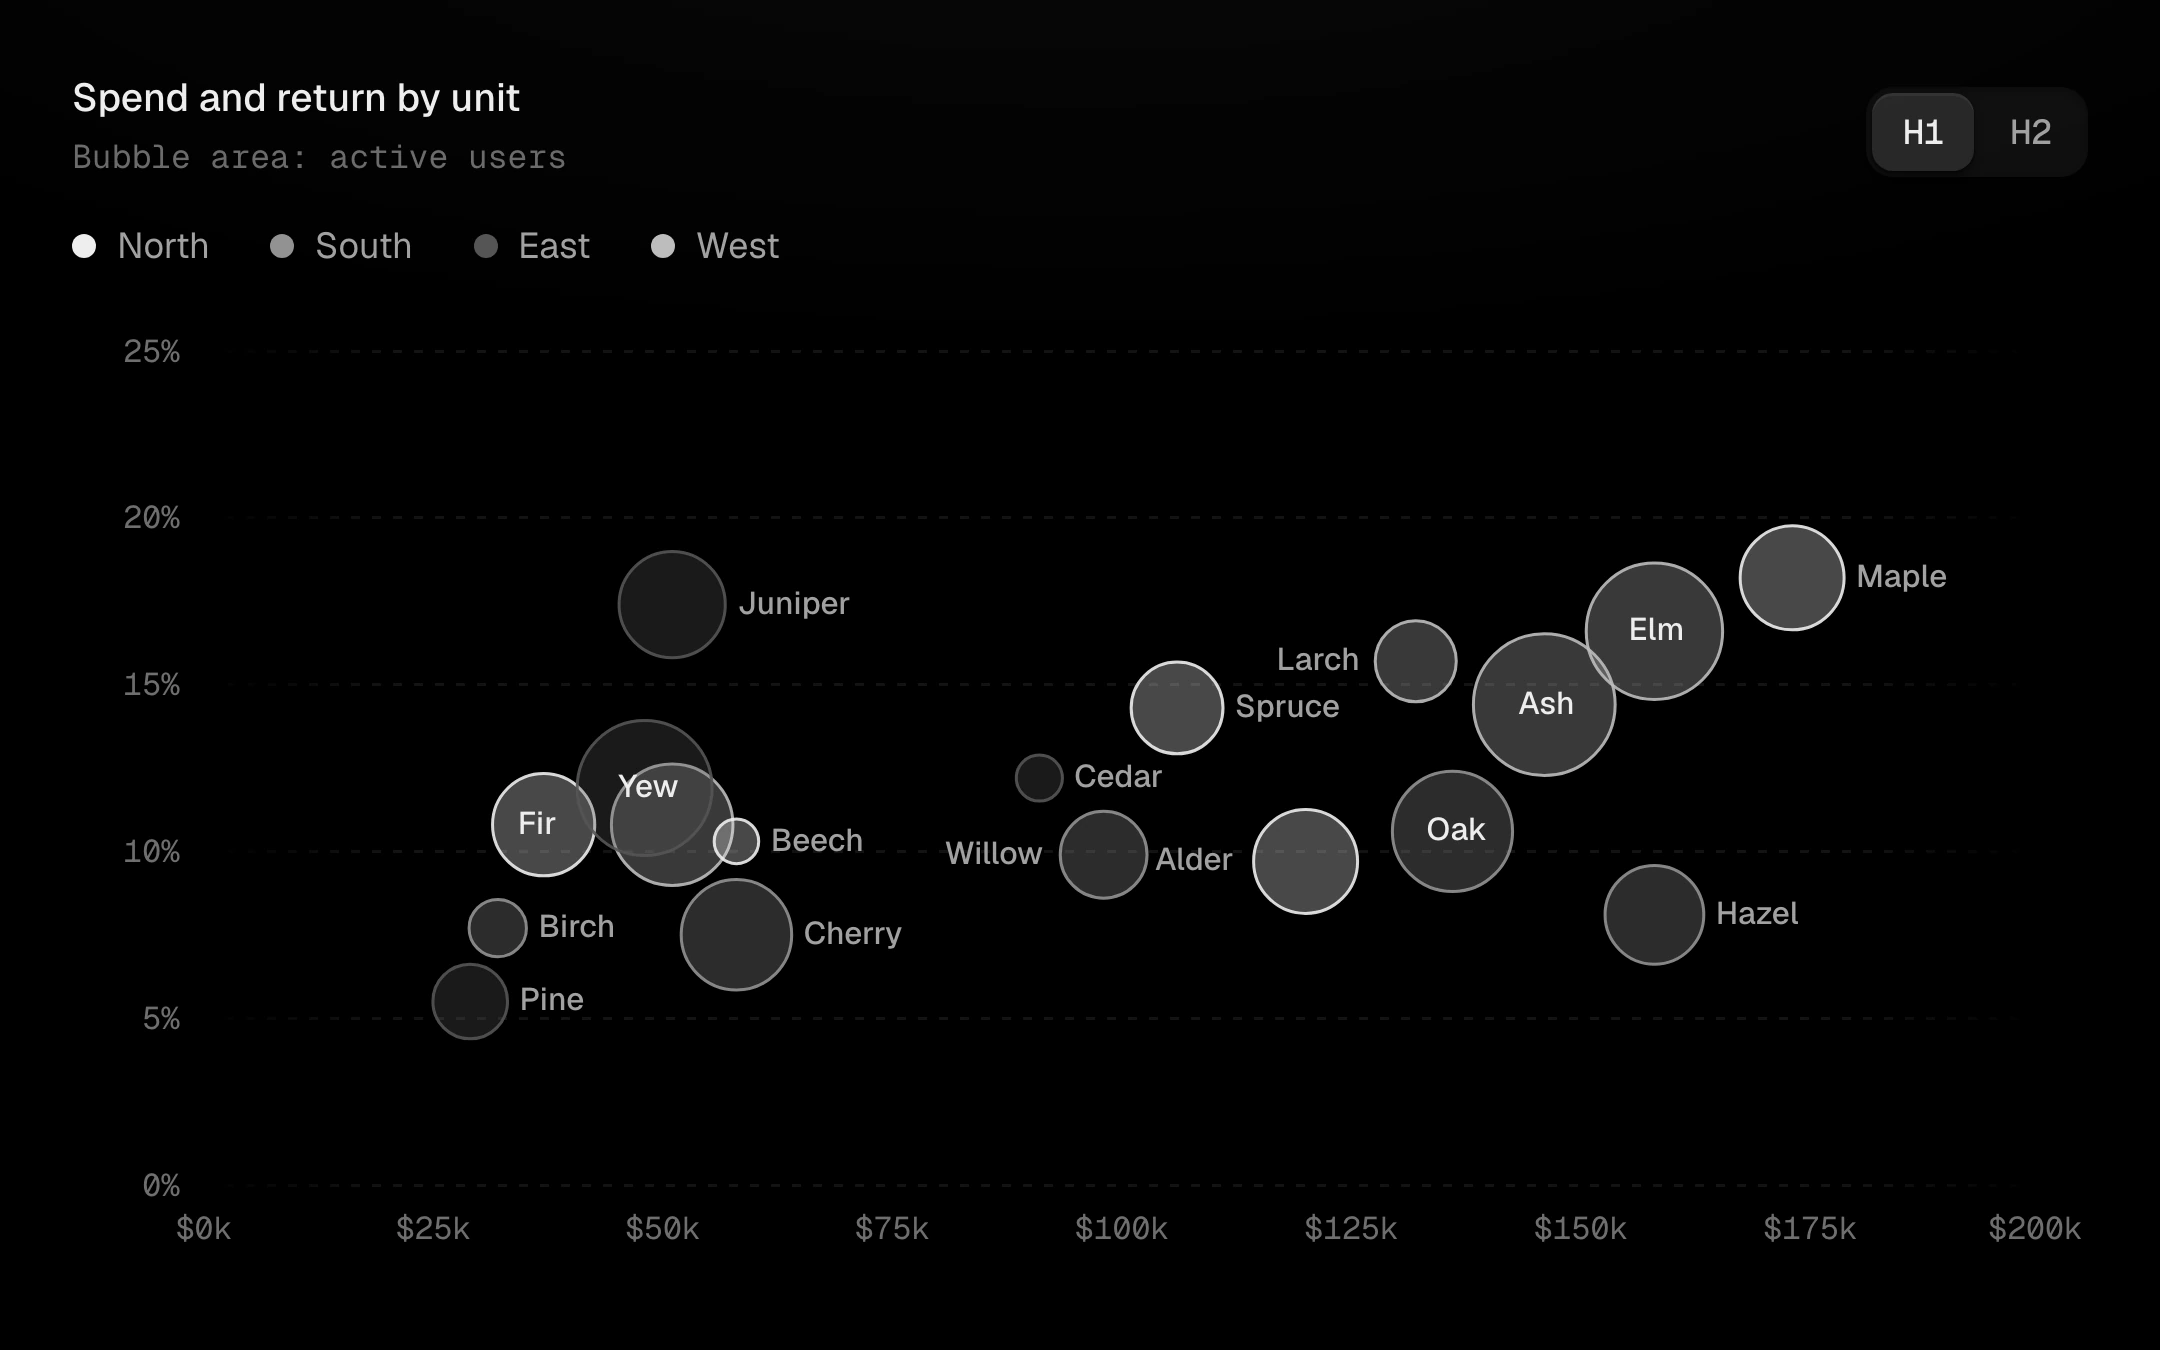
Bubbles for x, y, size and category: area encodes size on a square-root scale and each category is a step on the grey ladder.
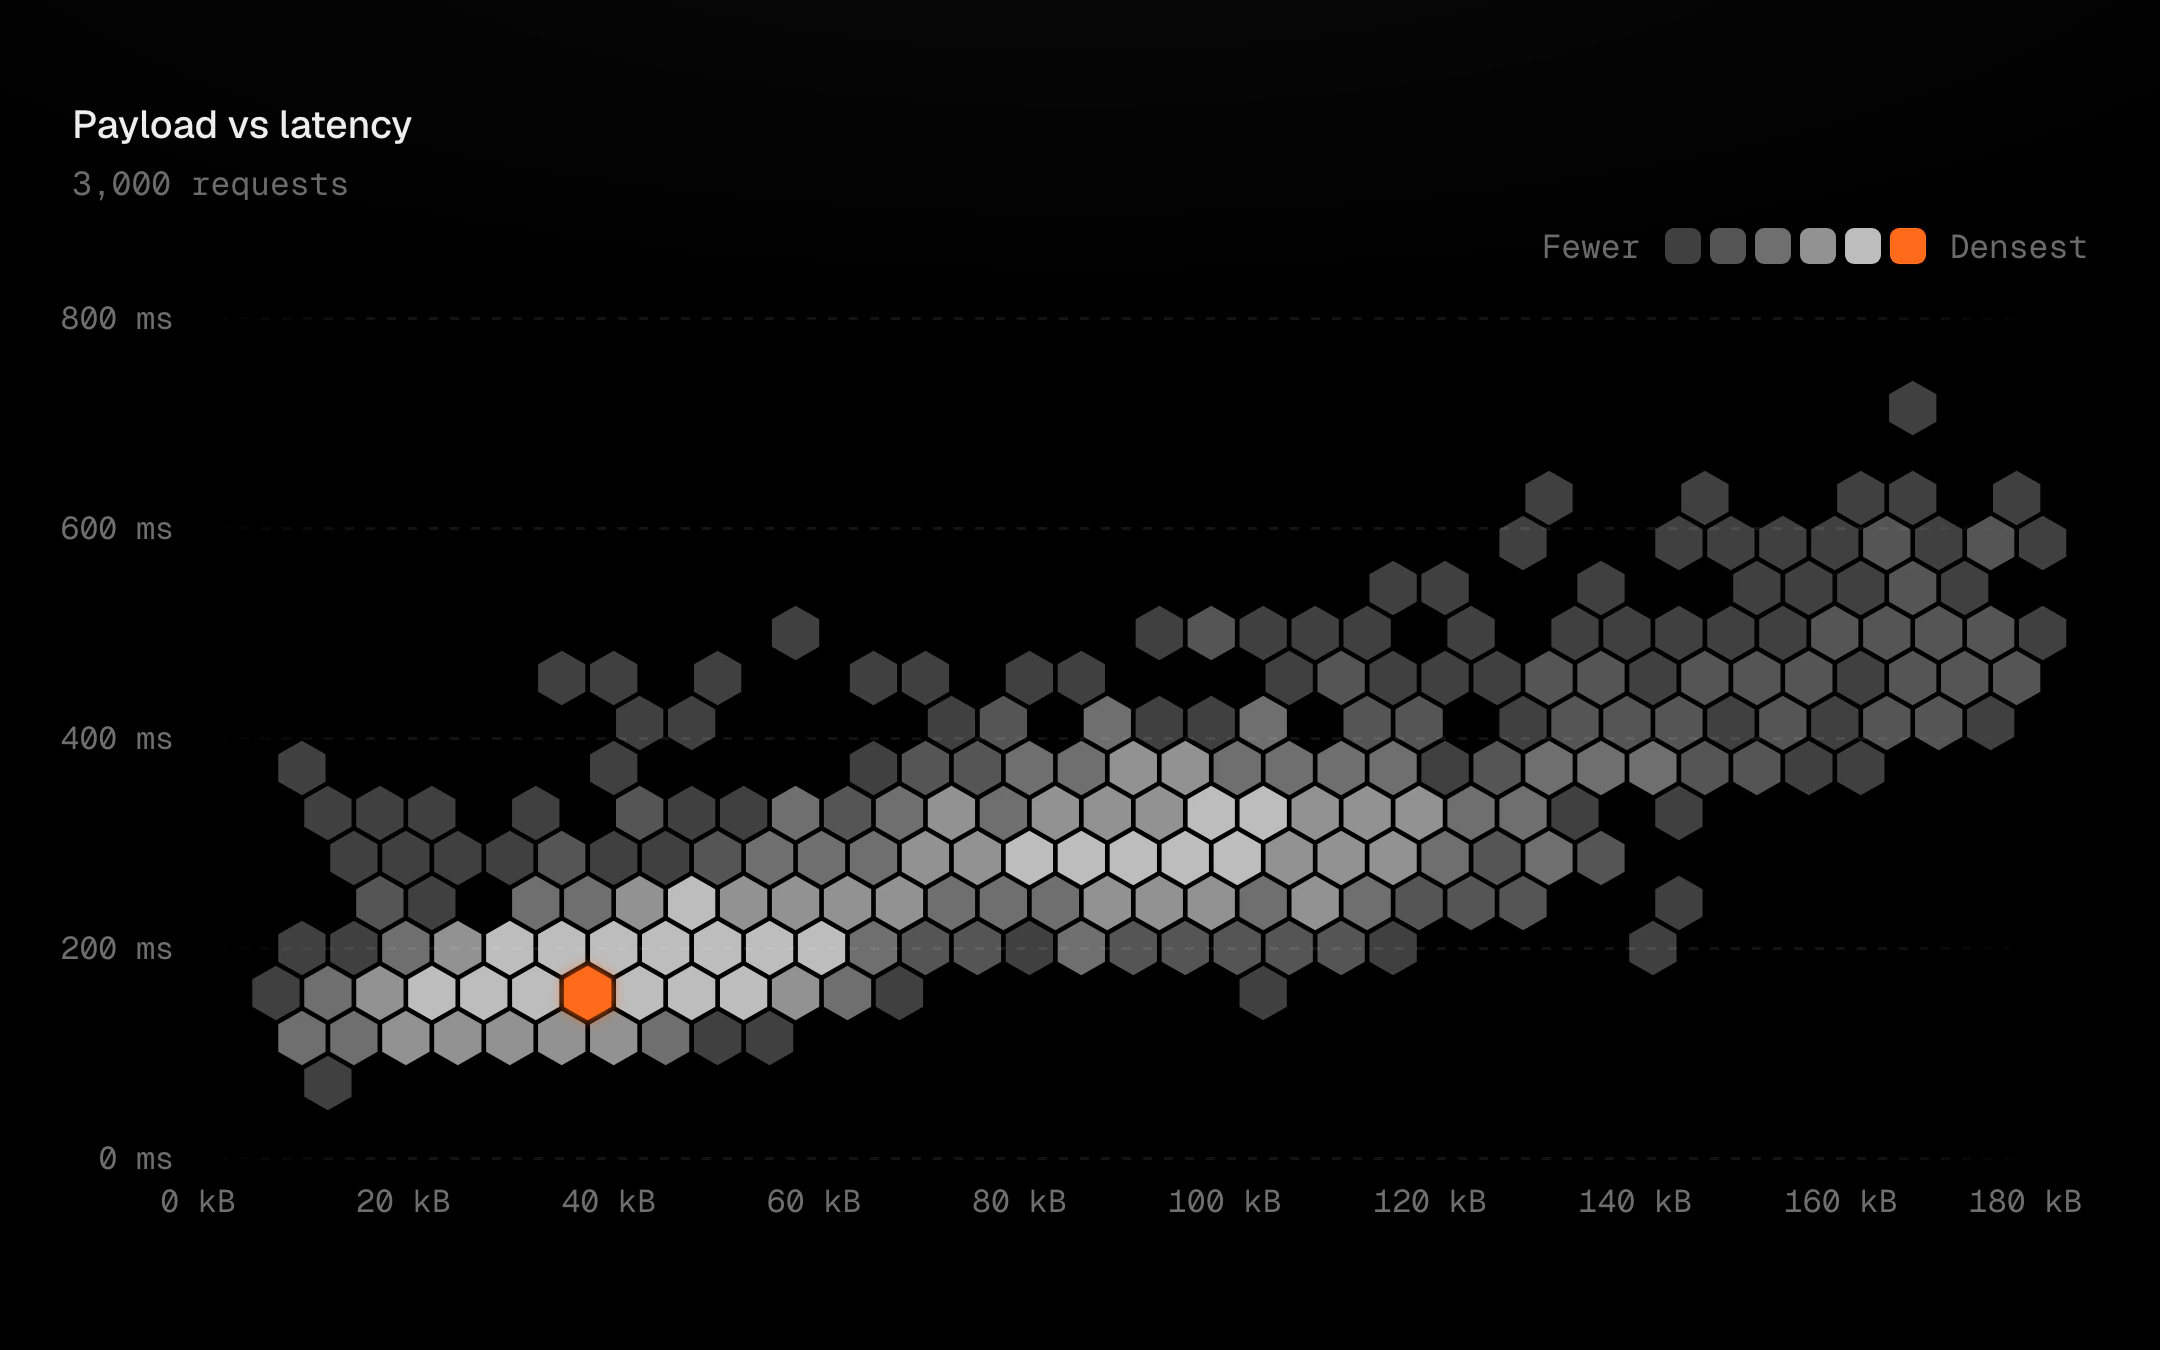
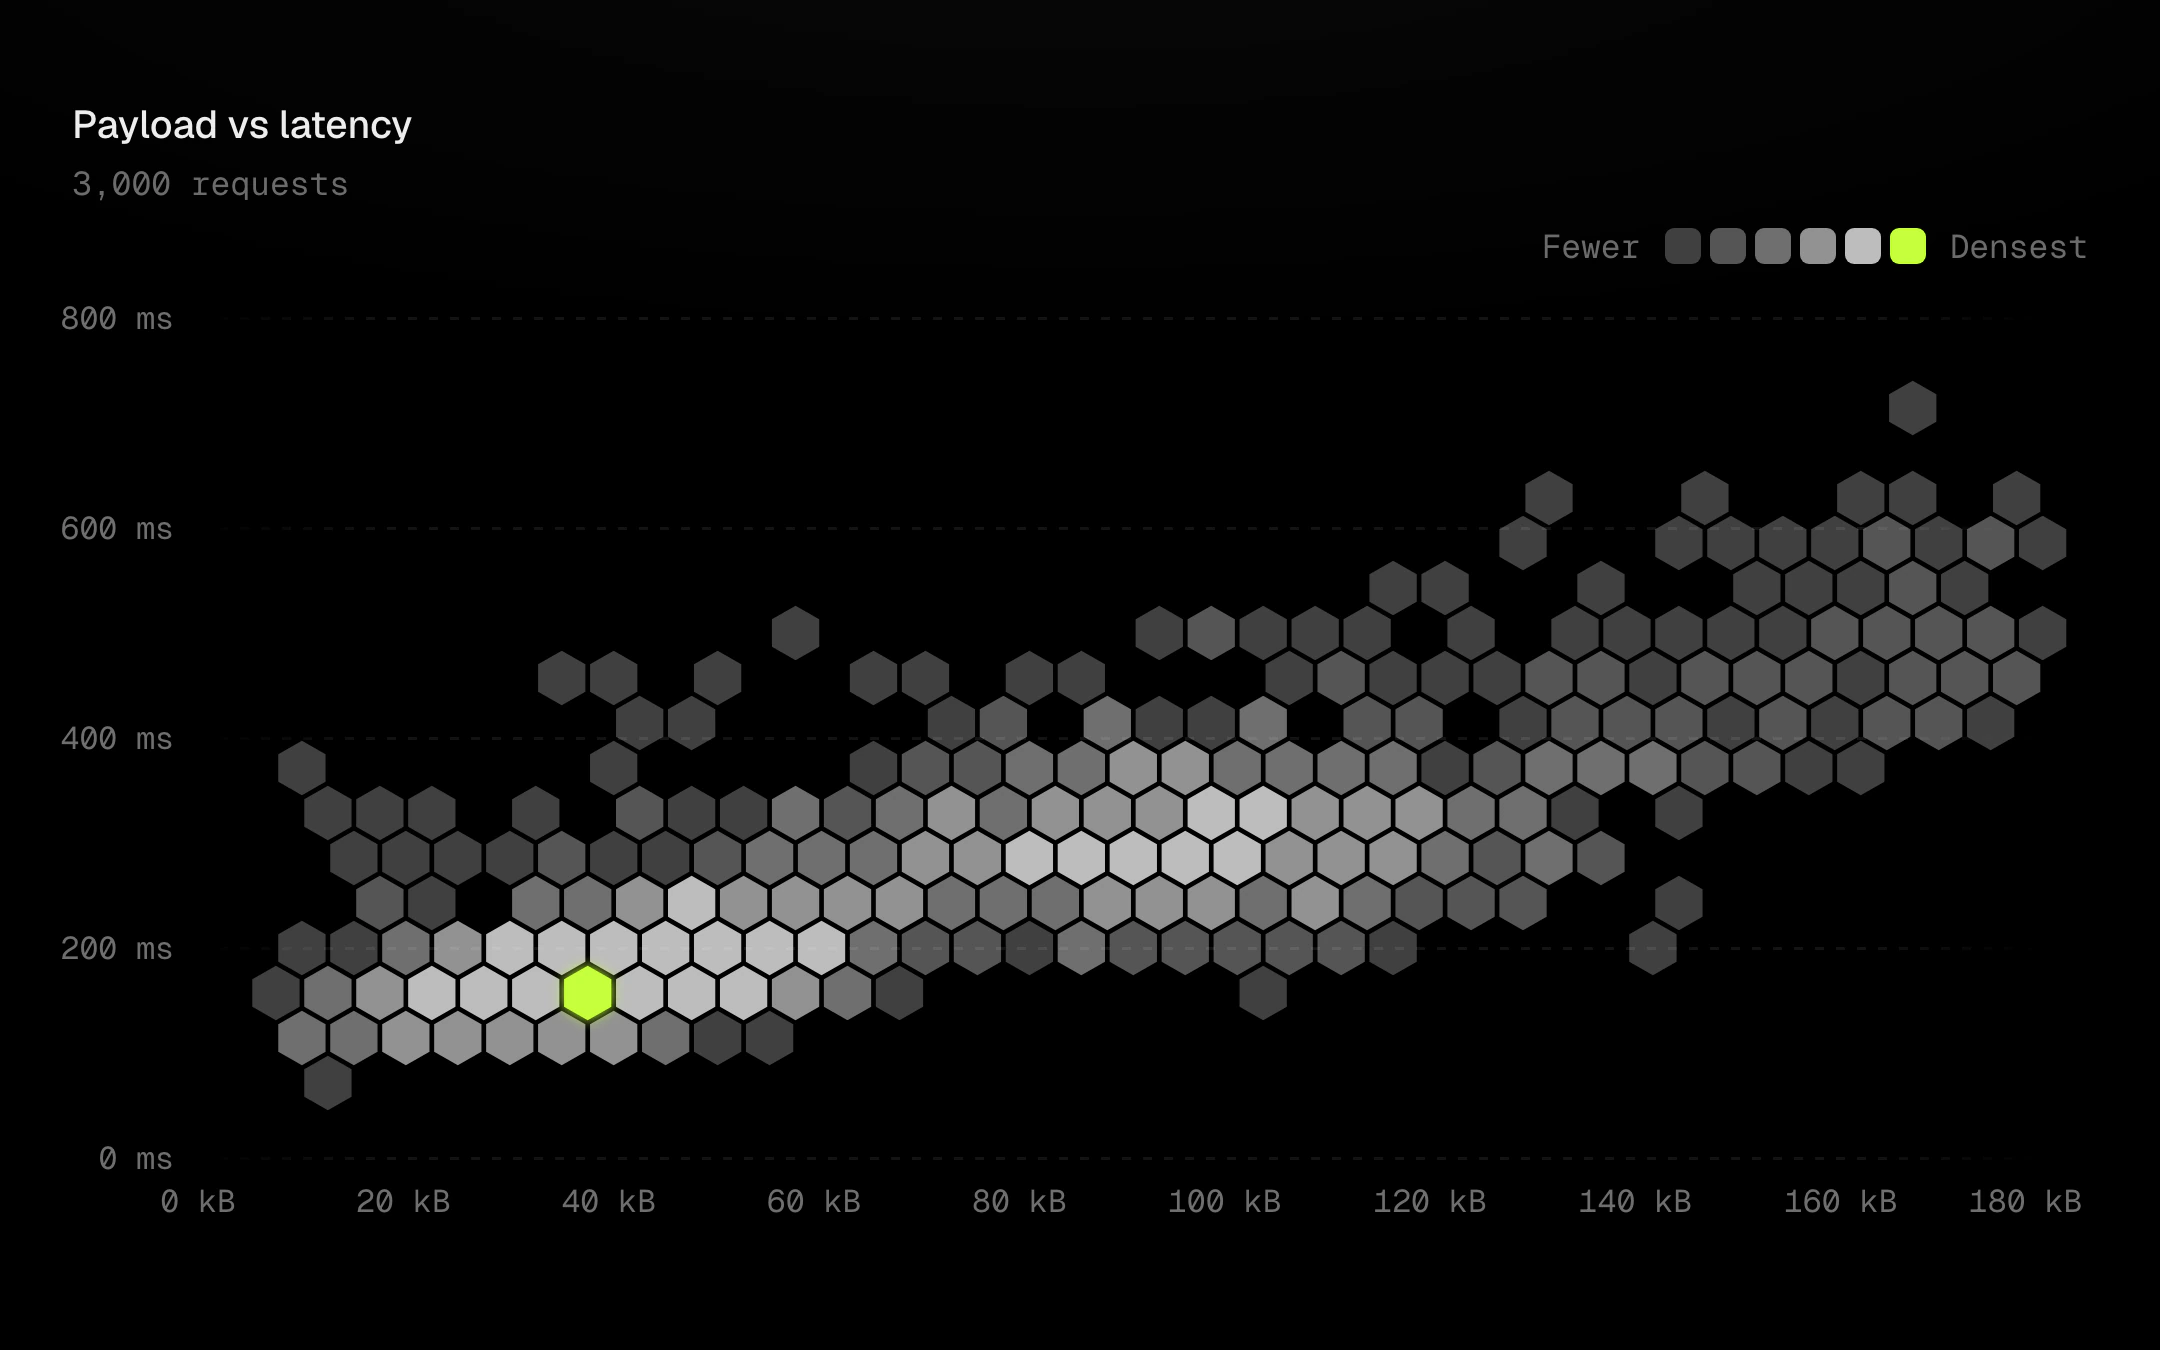
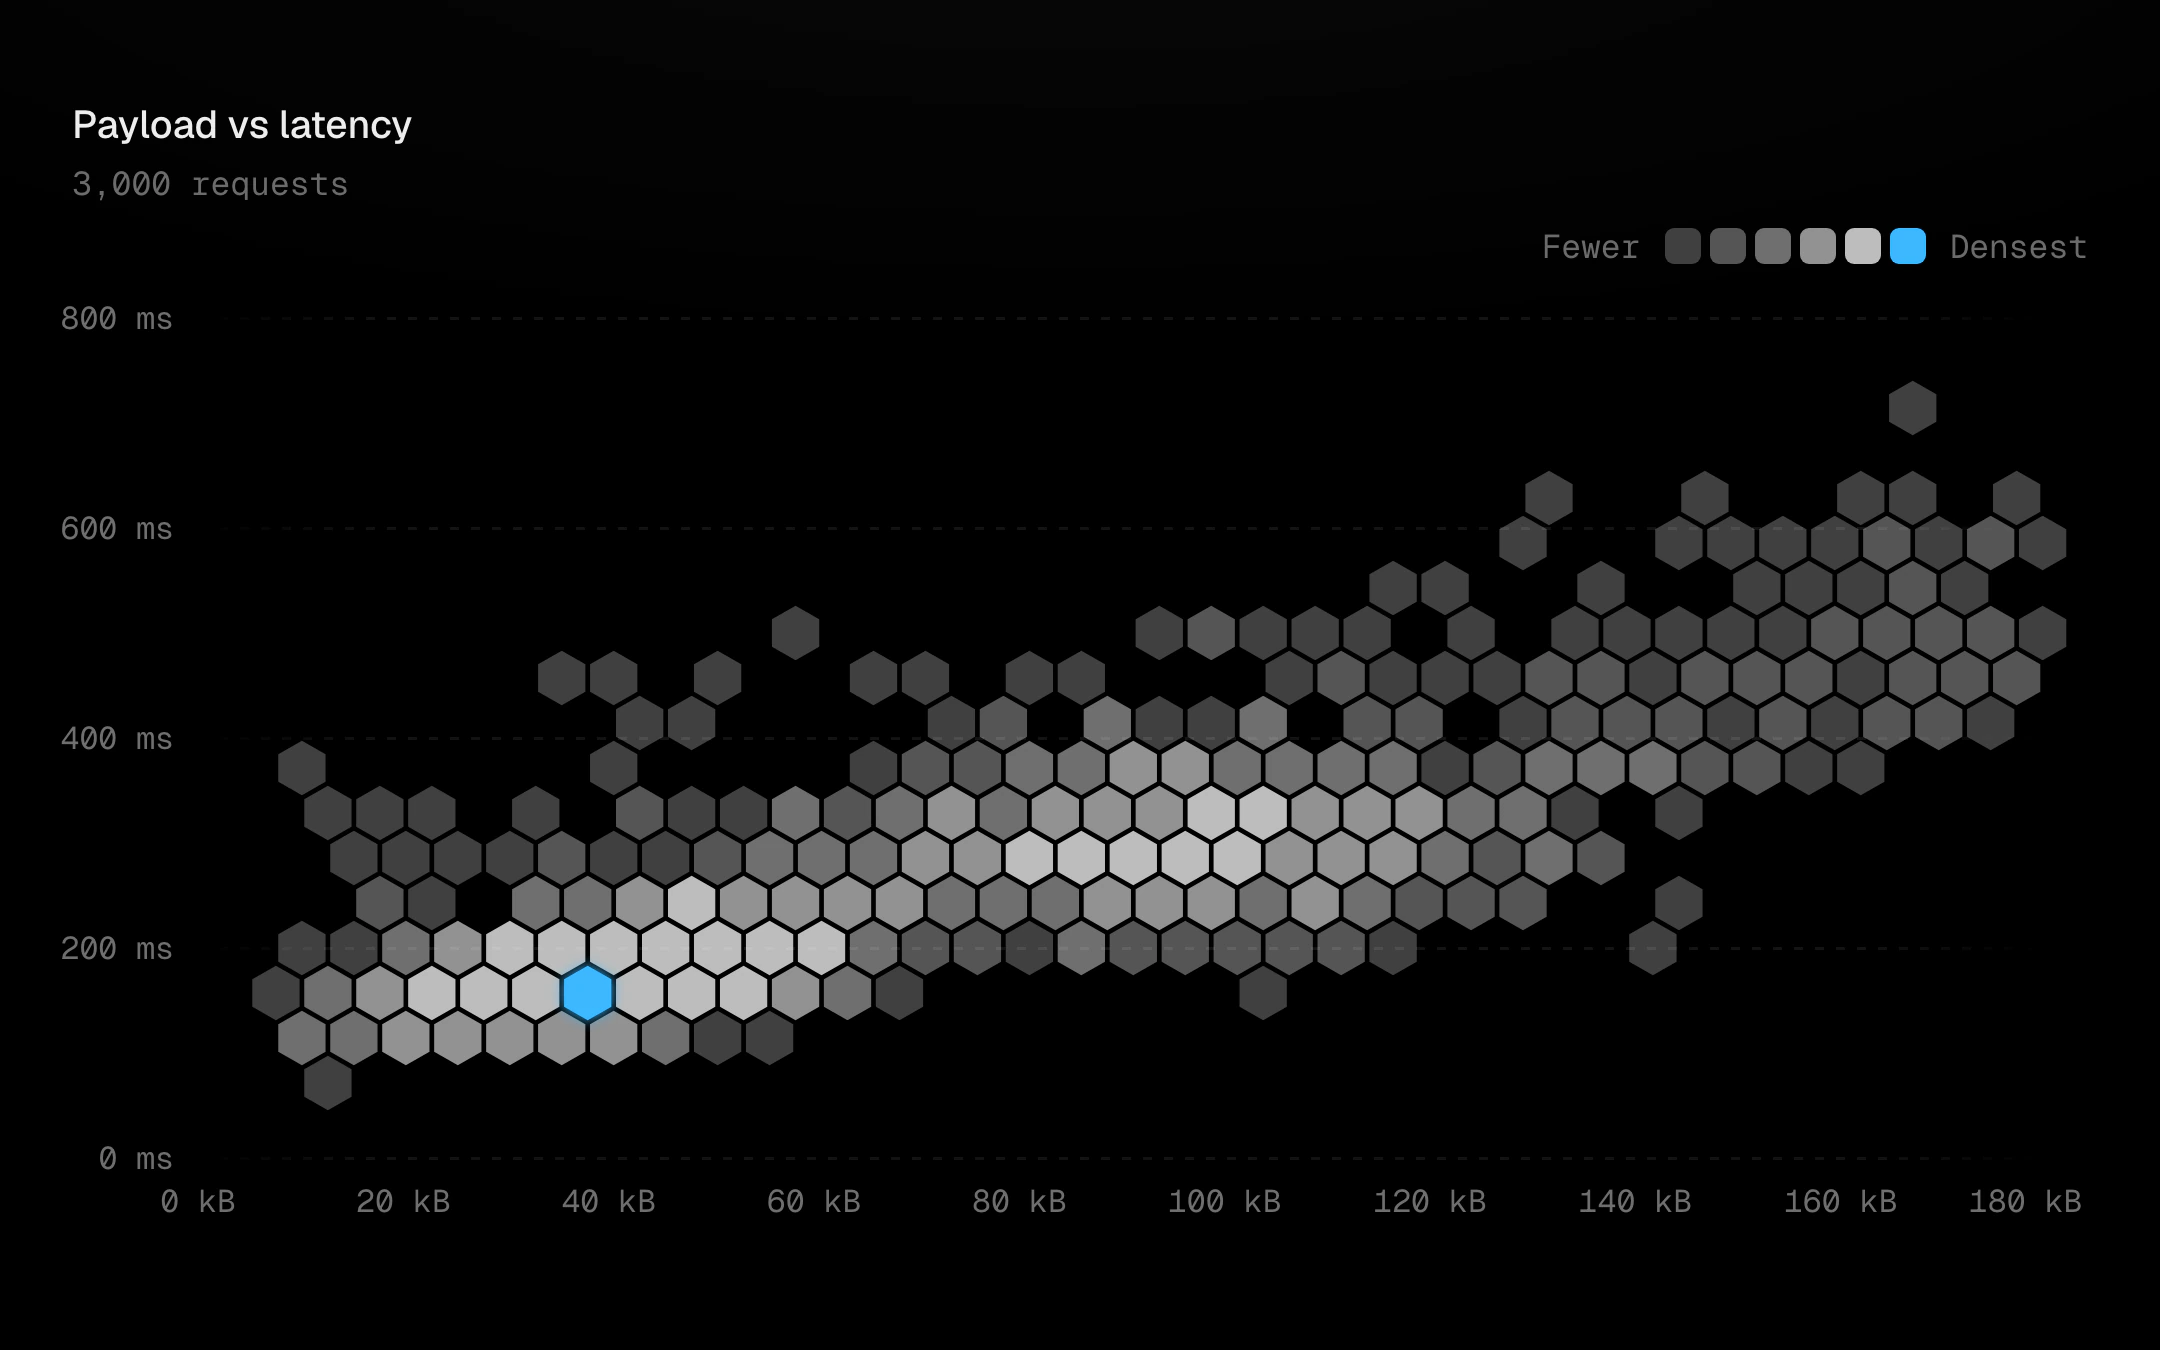
A few thousand points binned into hexagons and drawn on a canvas, with SVG axes, keyboard and states on top.
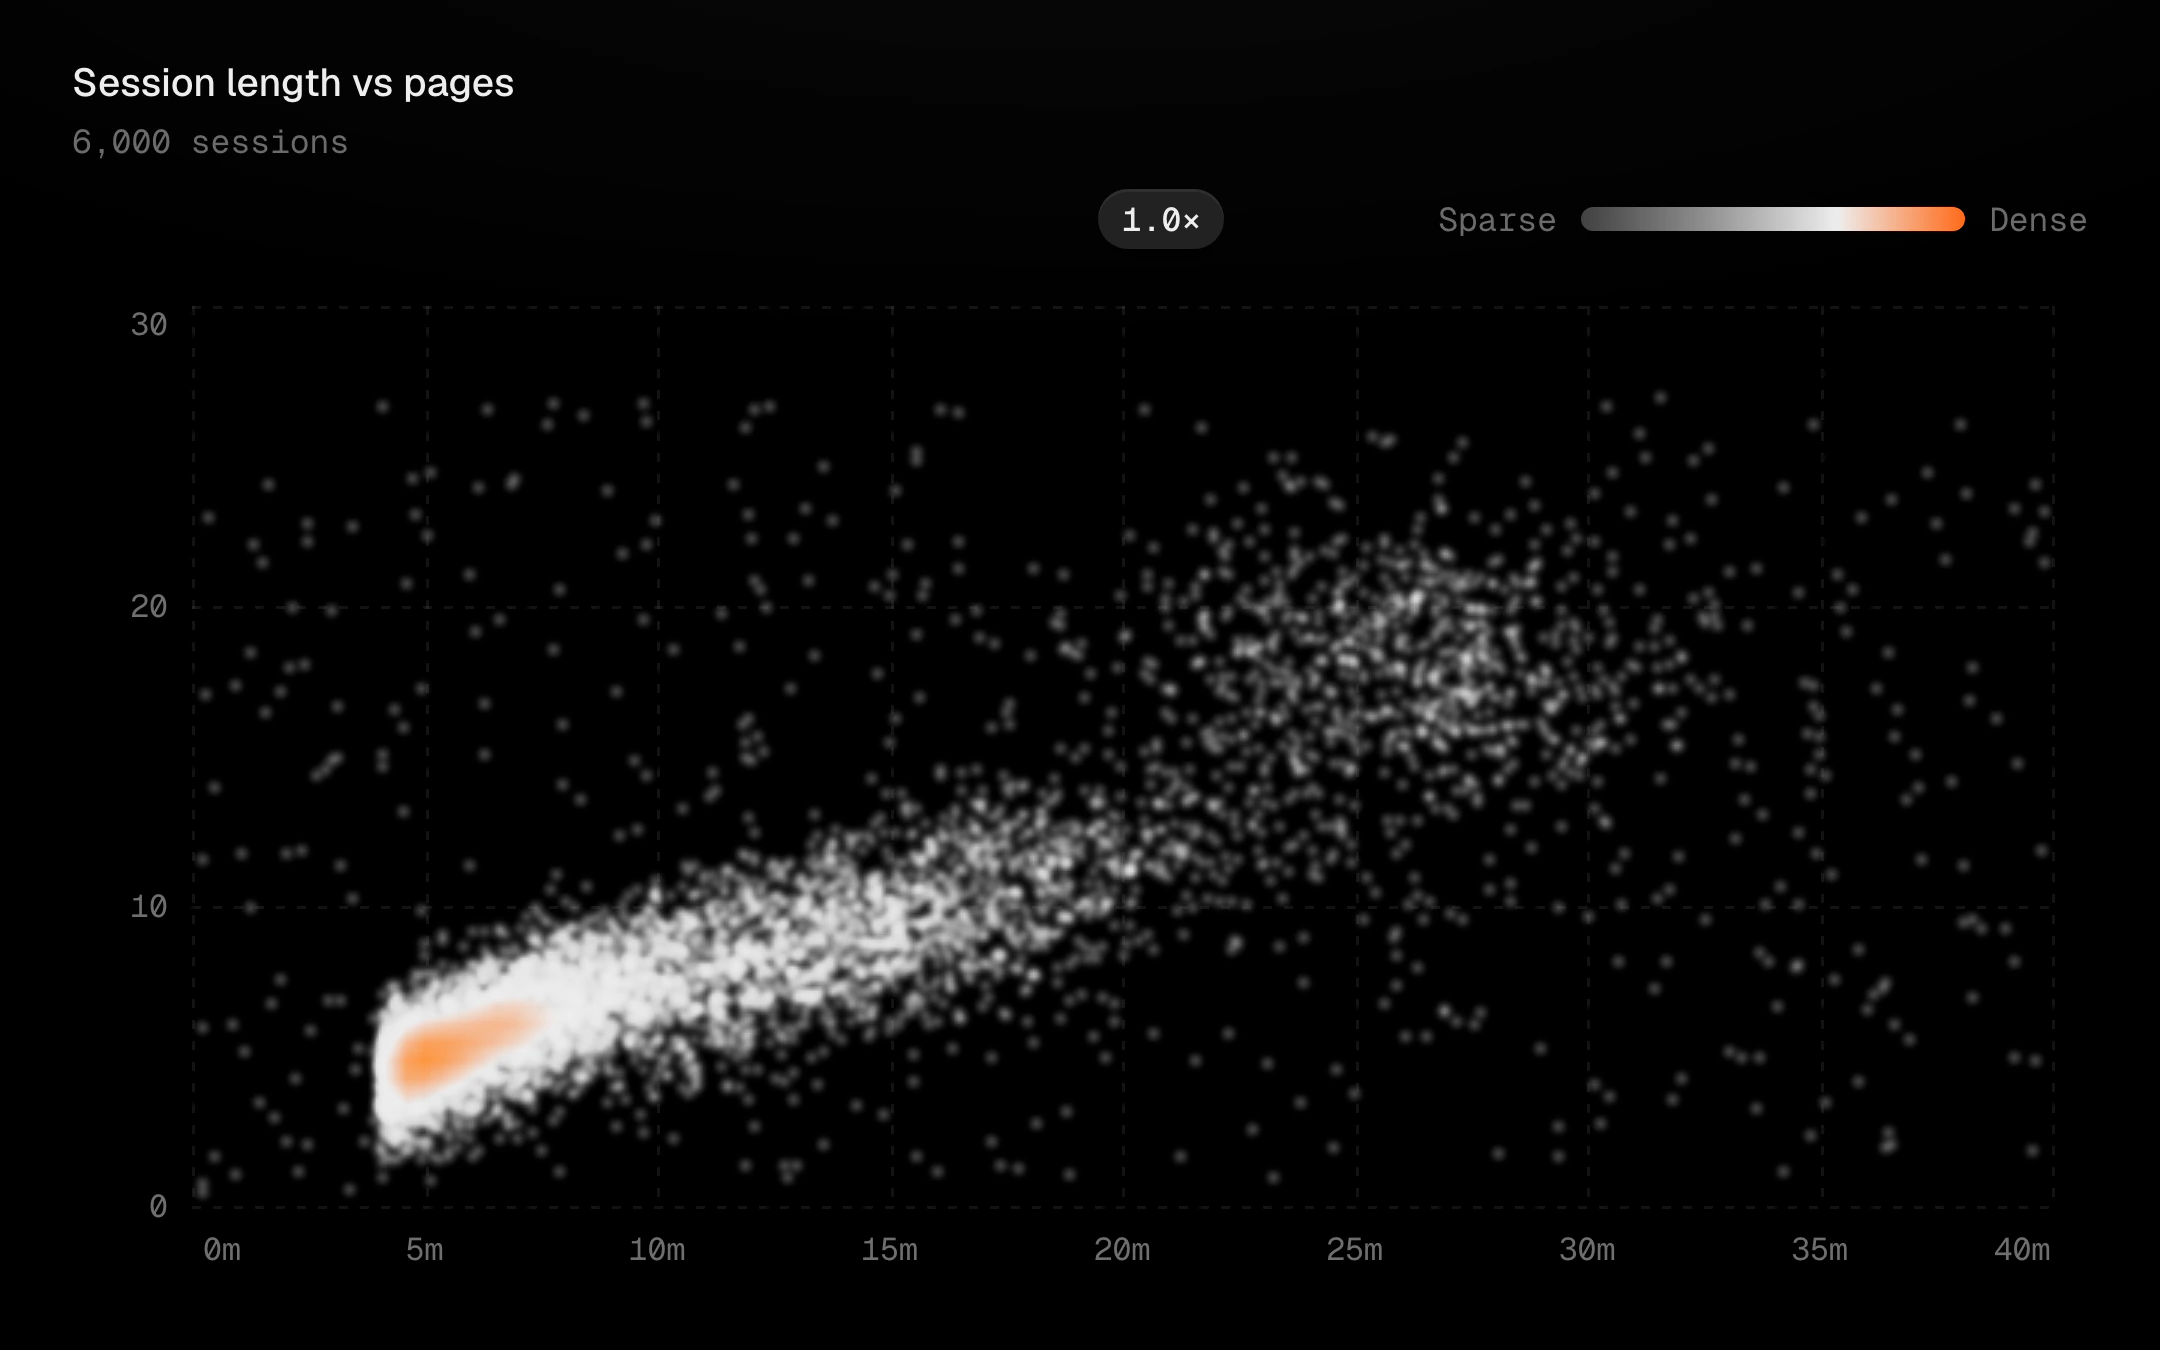
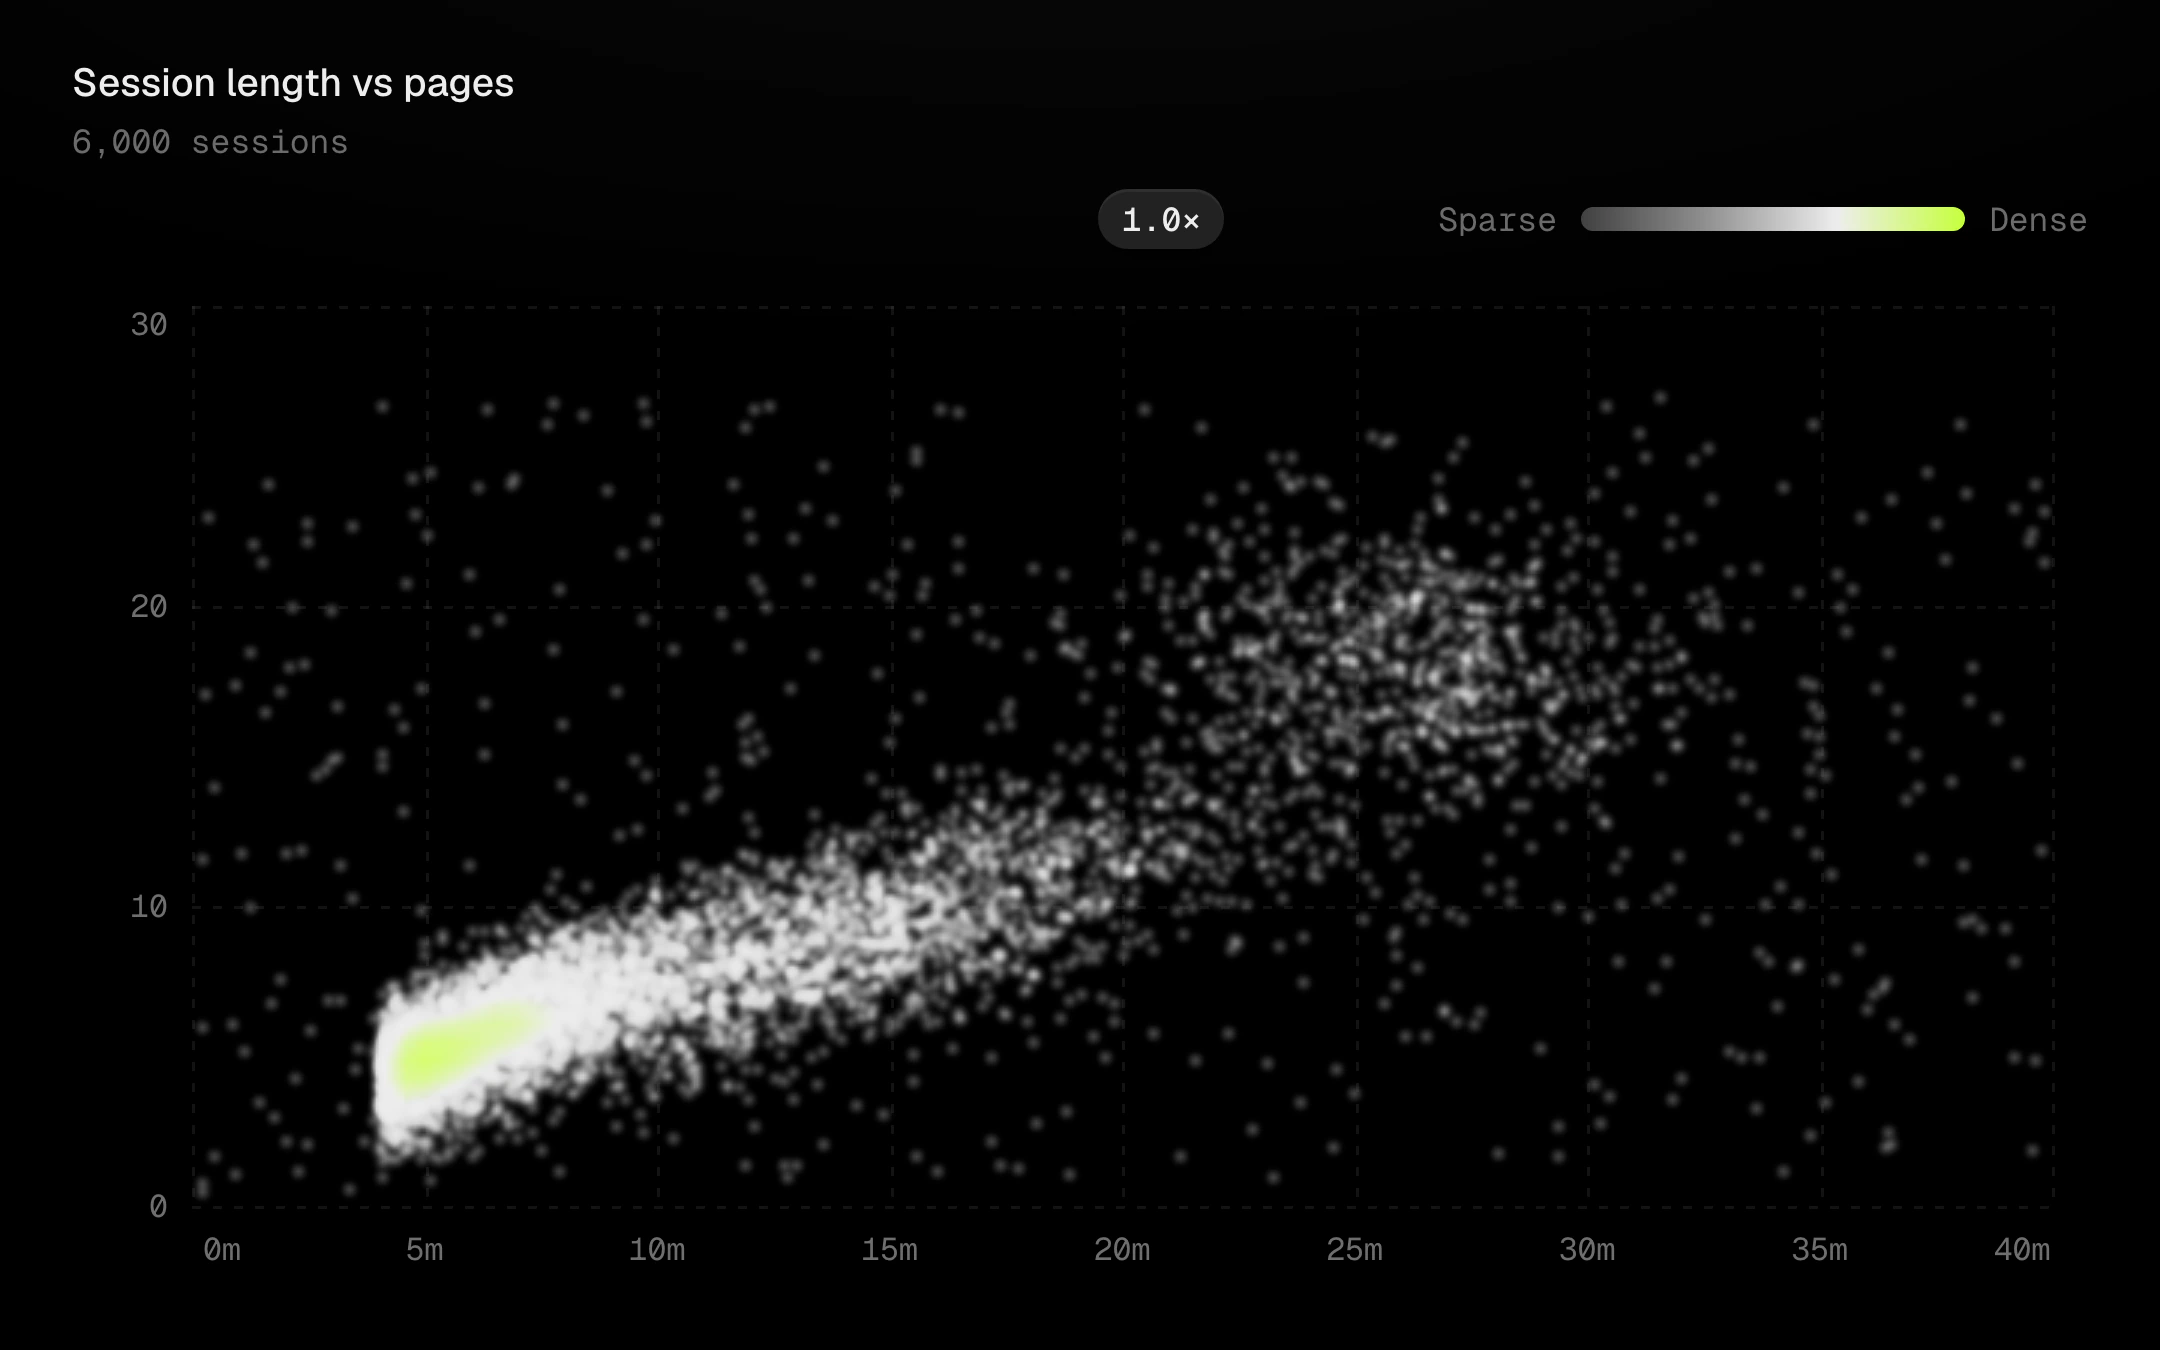
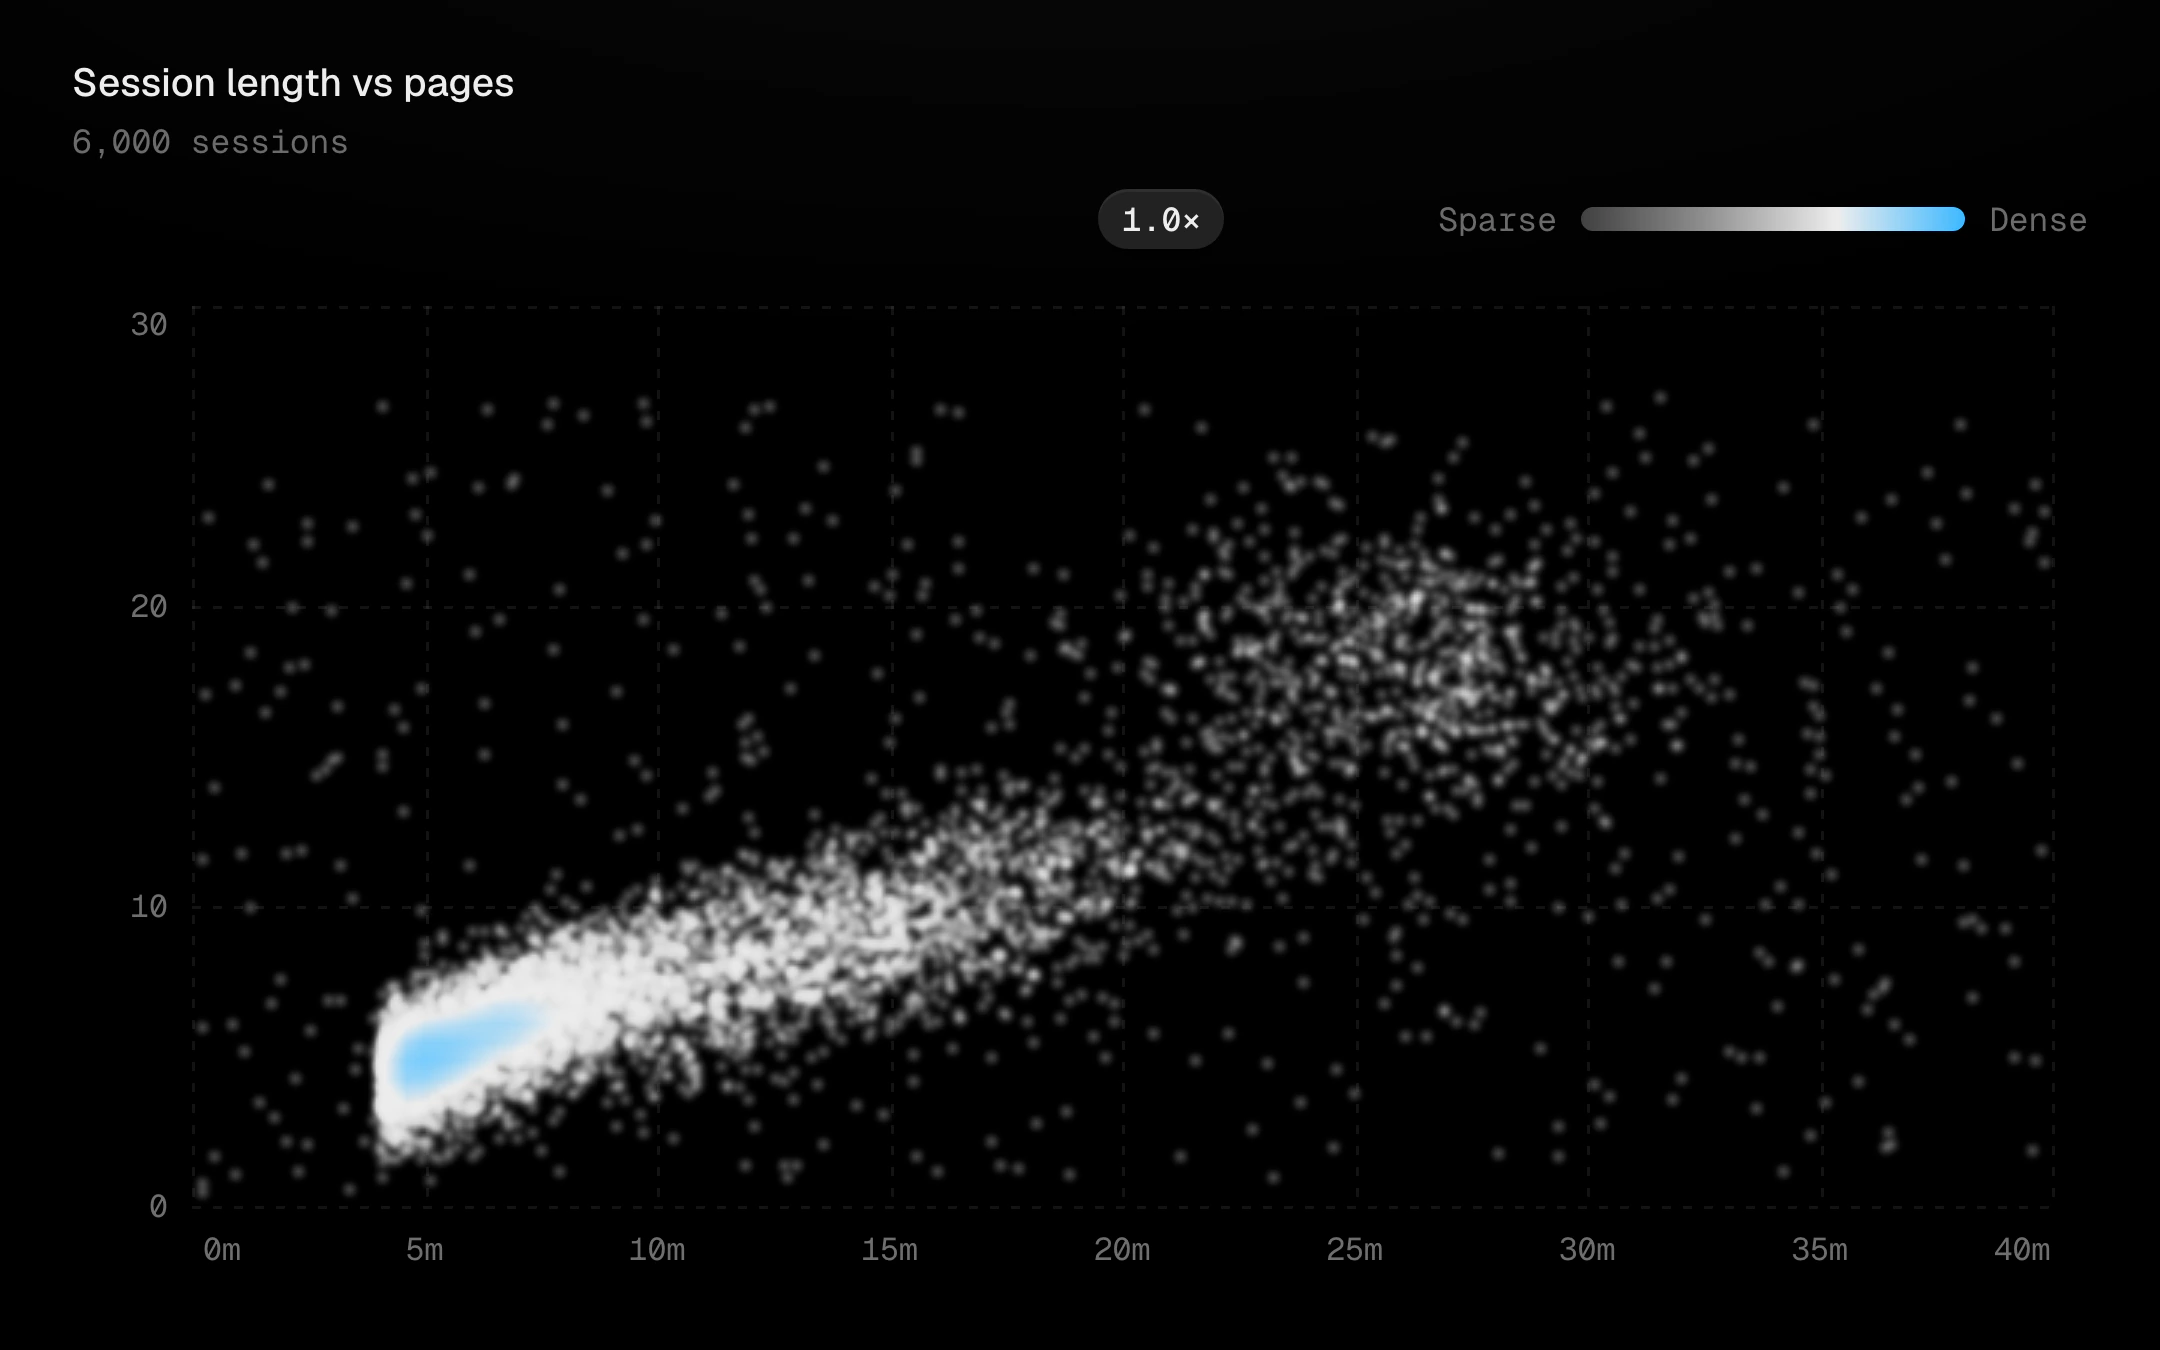
A density scatter without bins.
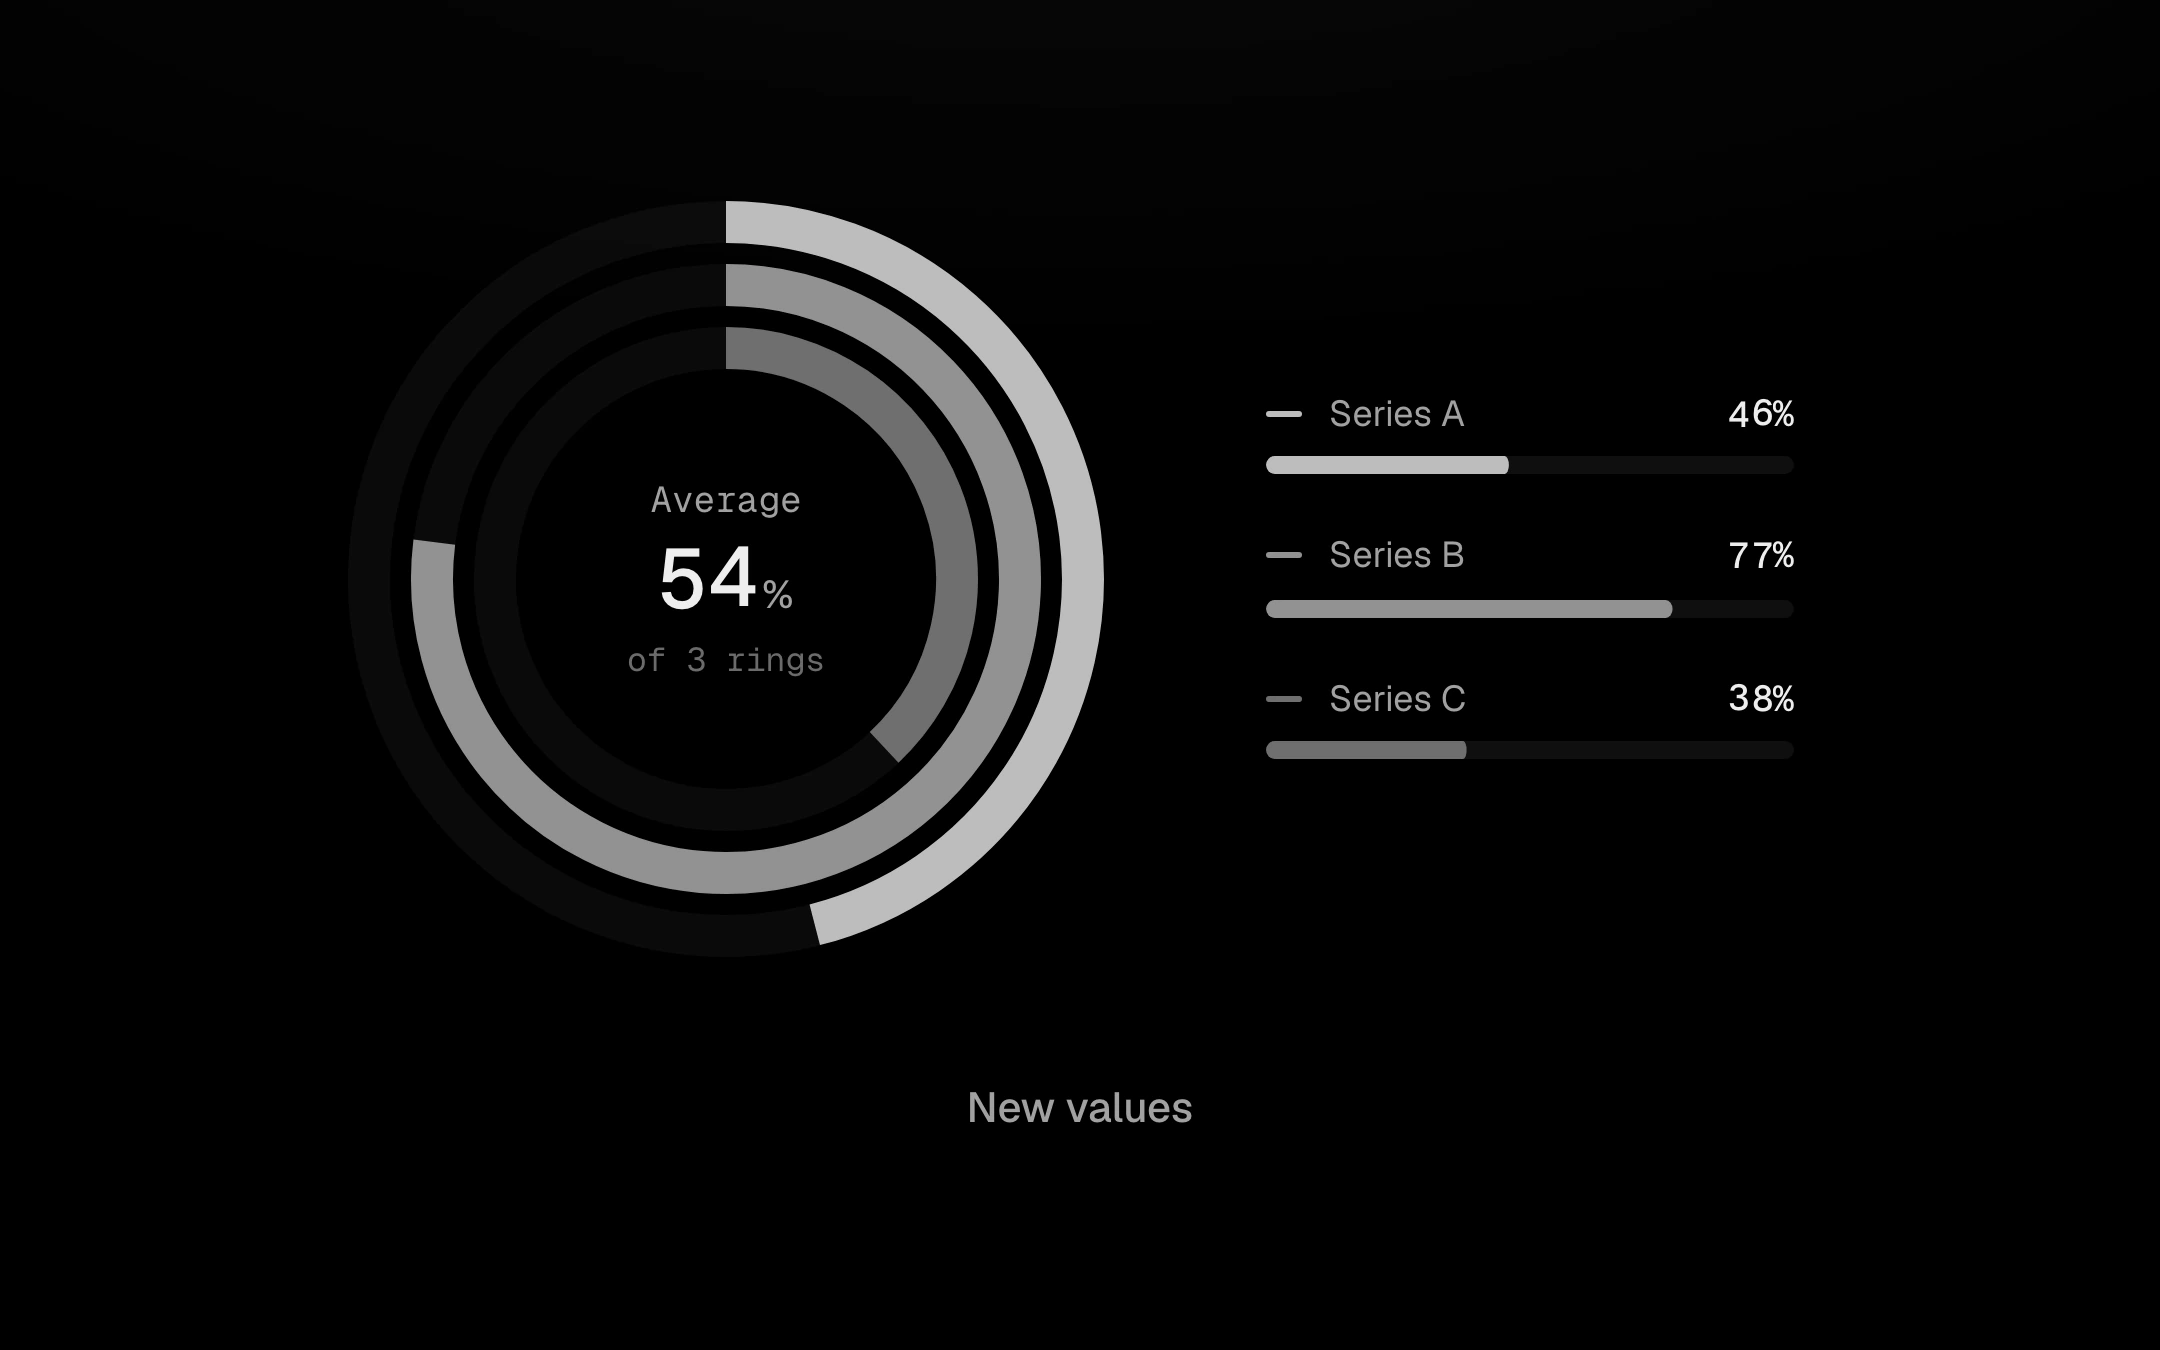
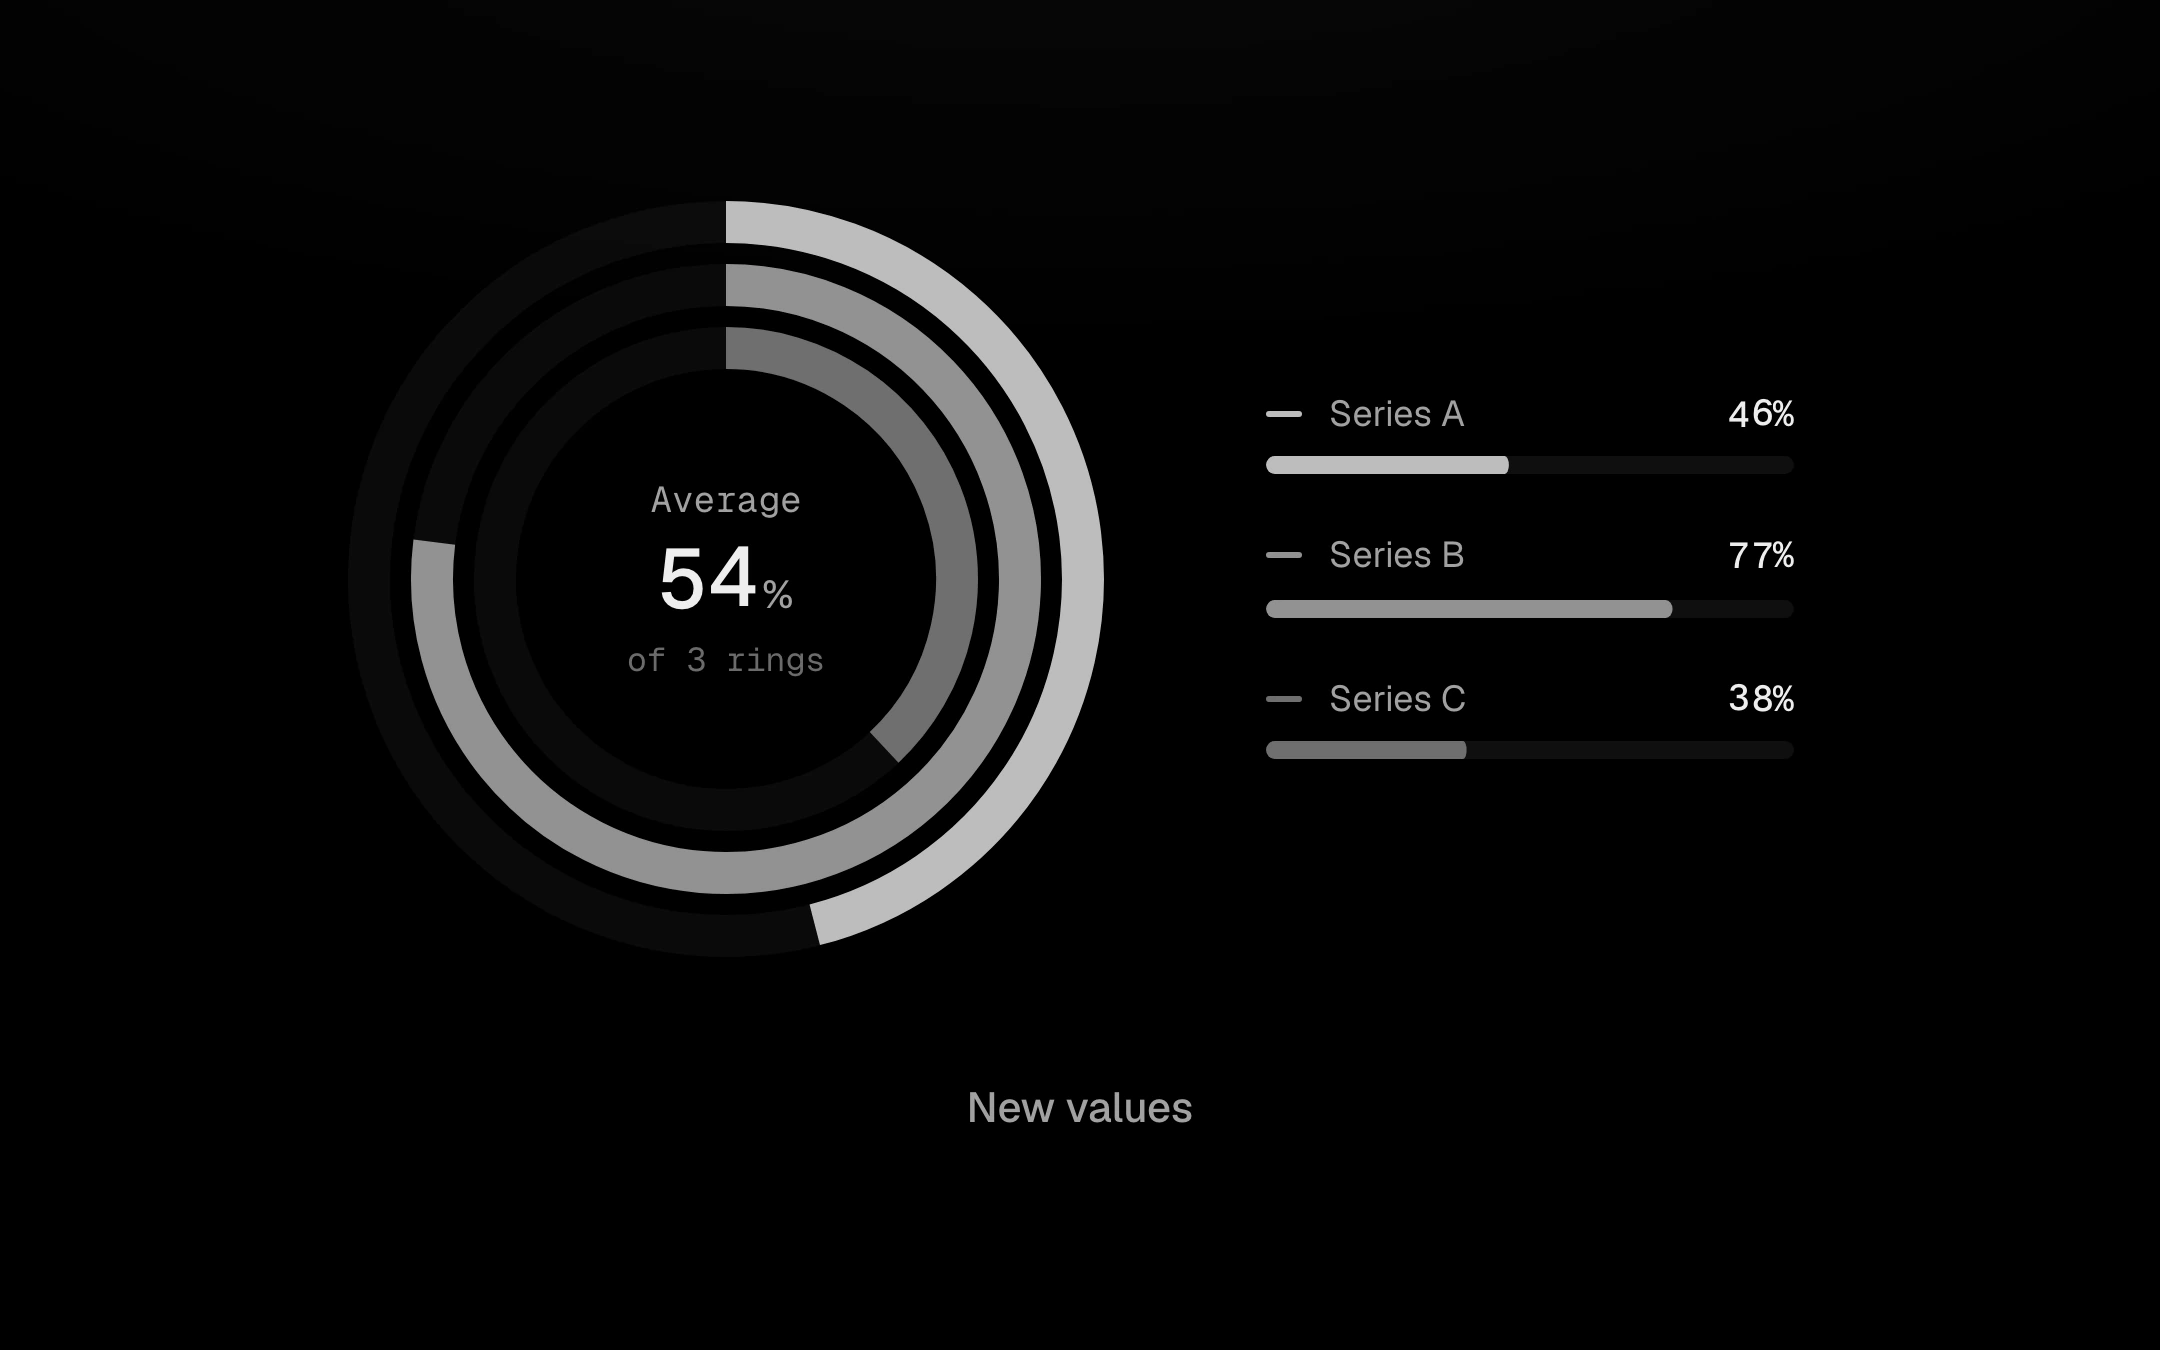
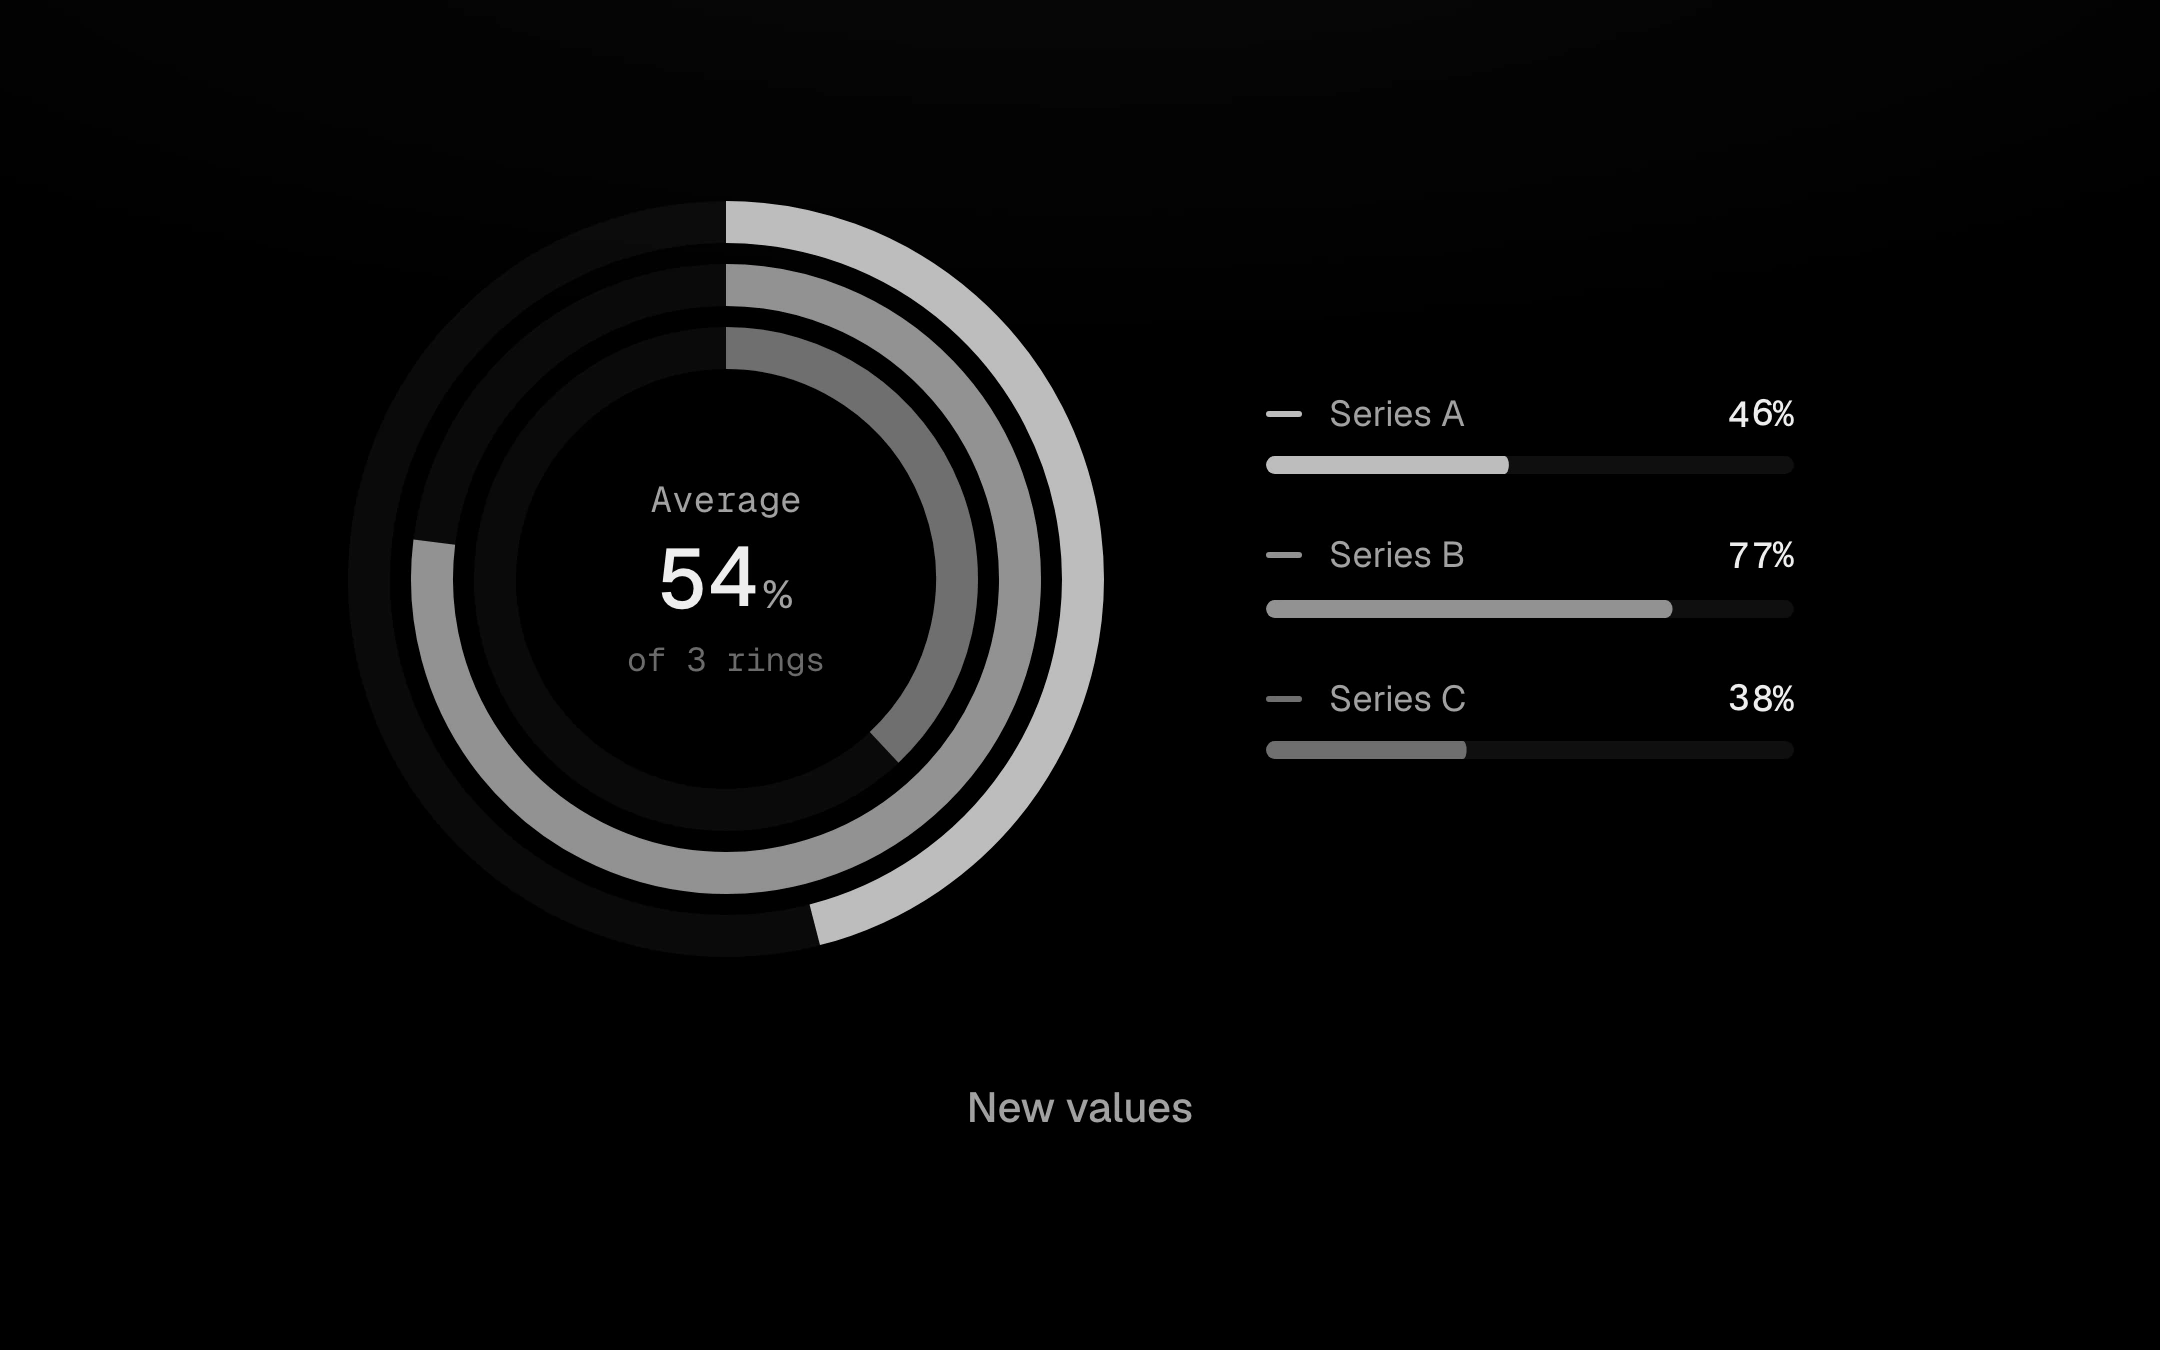
Two to five concentric arcs on faint tracks, read clockwise.
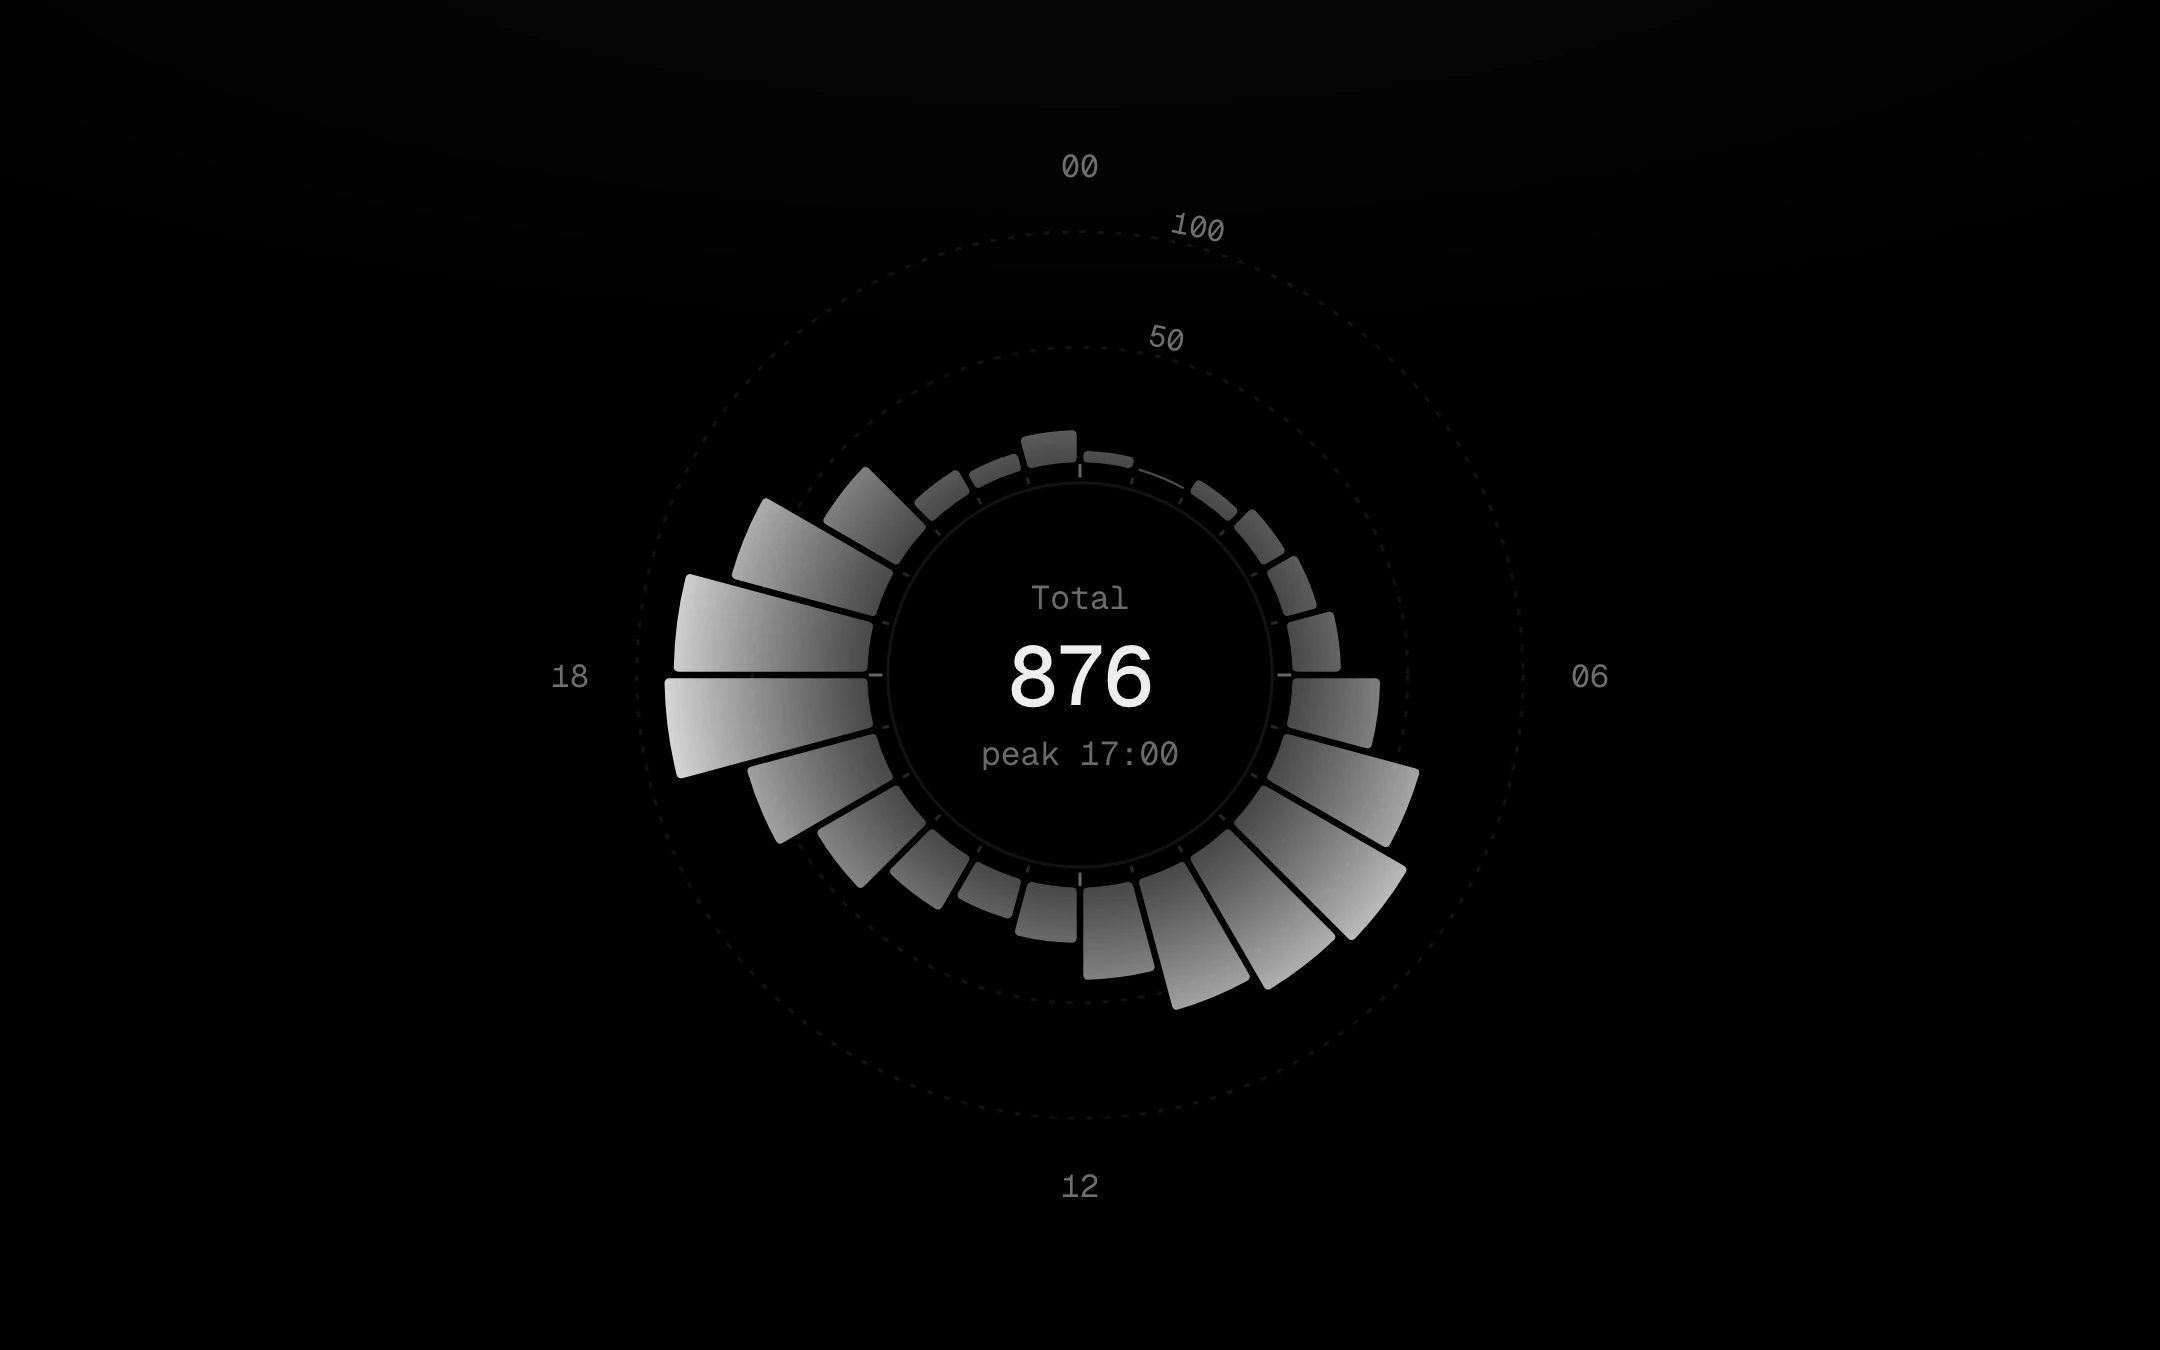
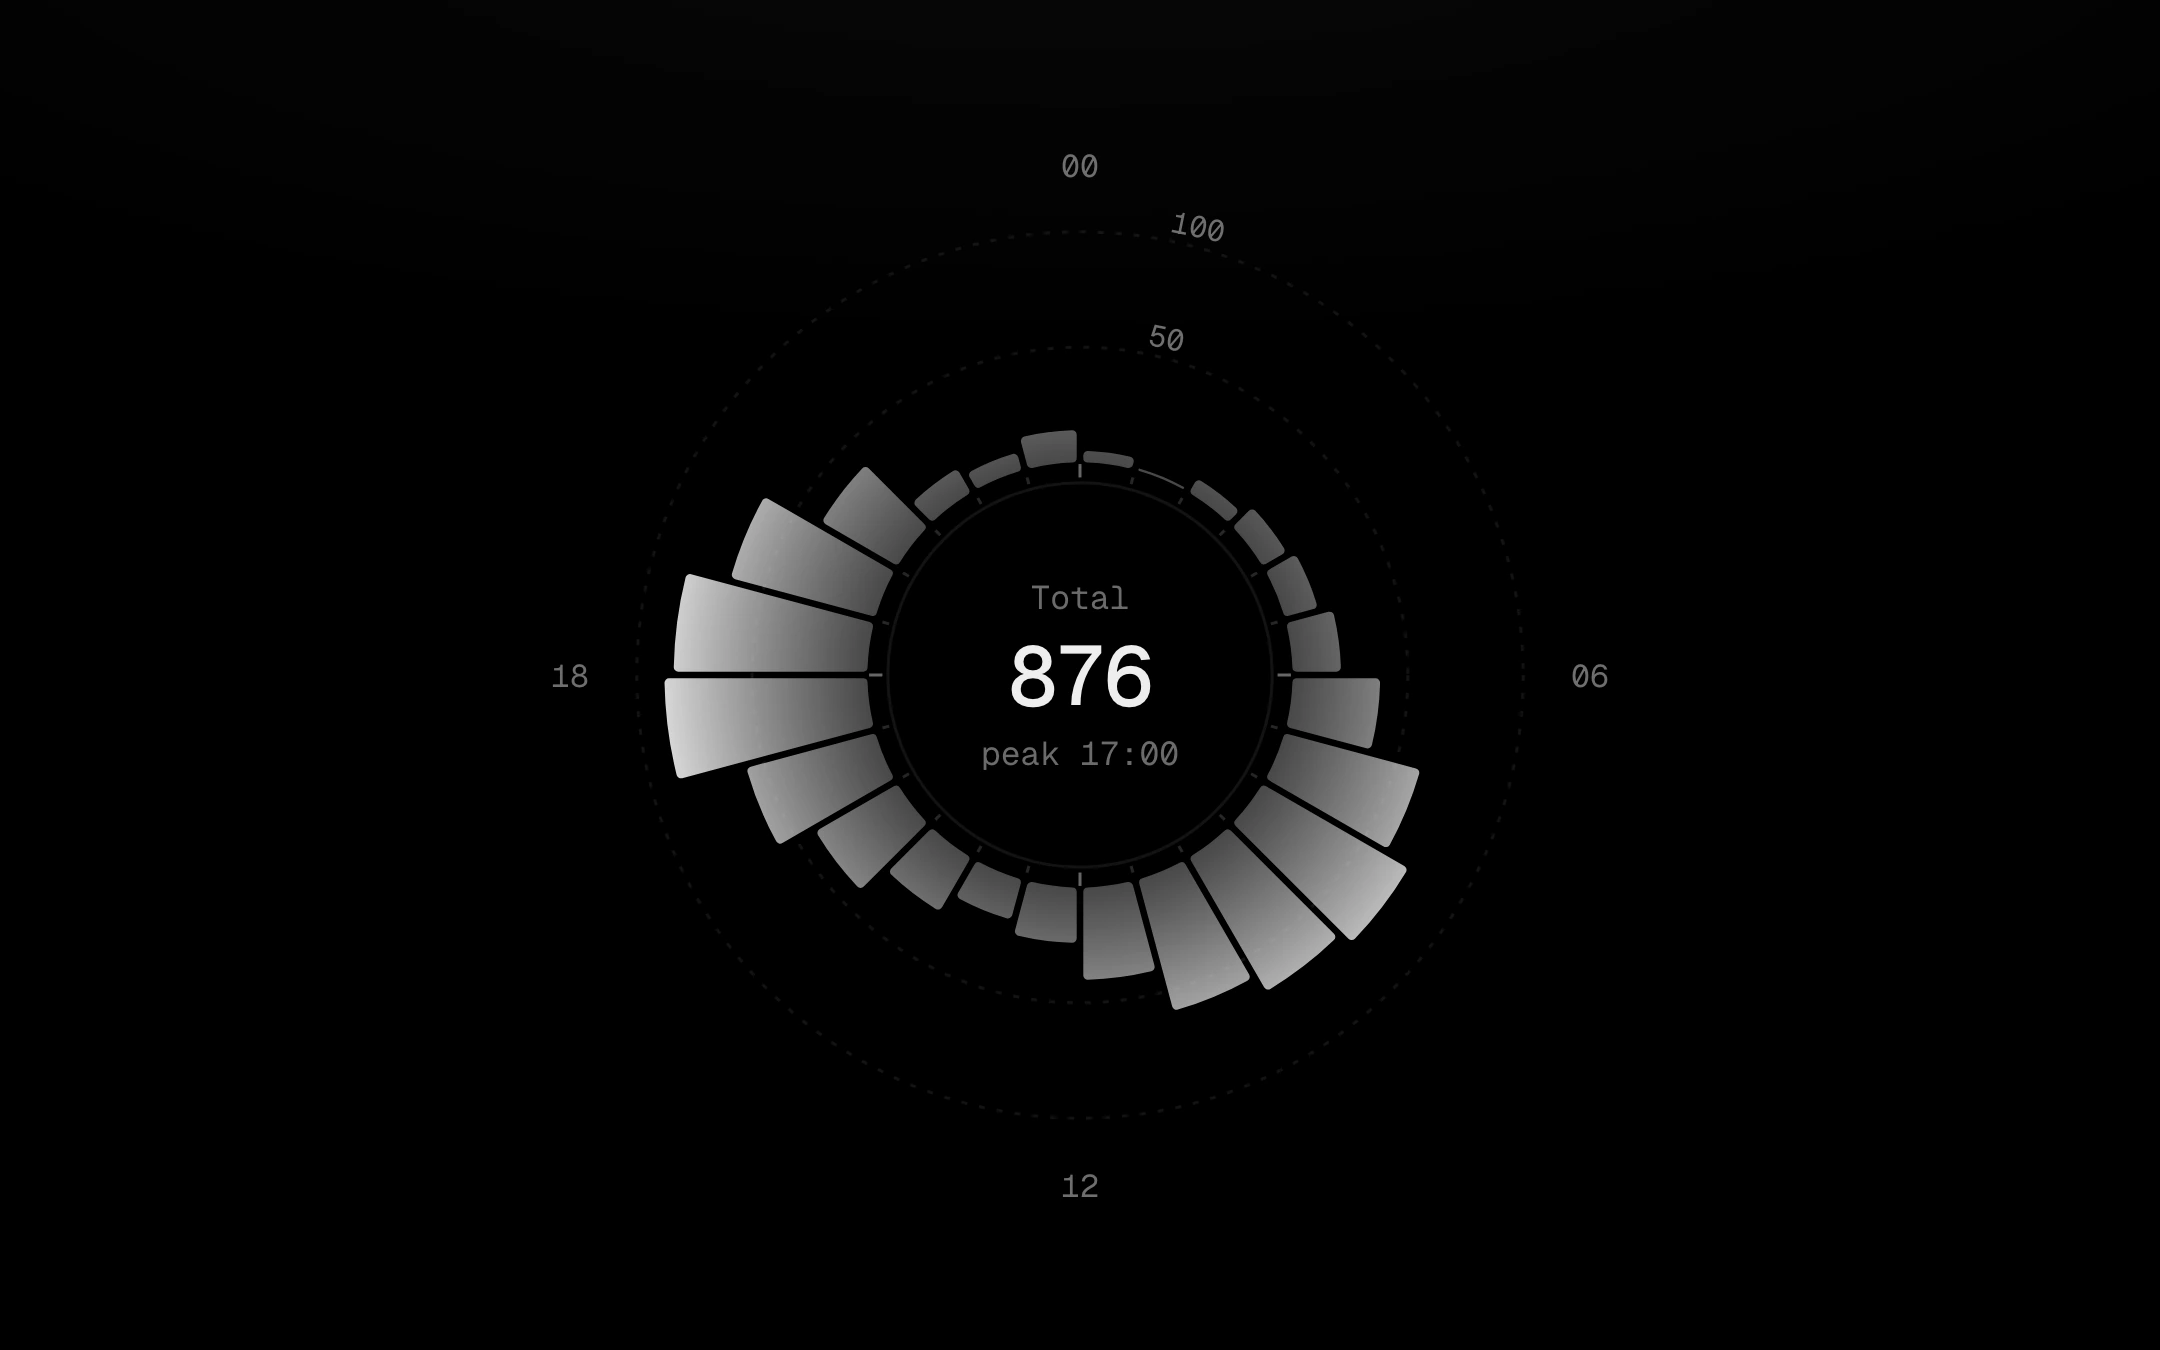
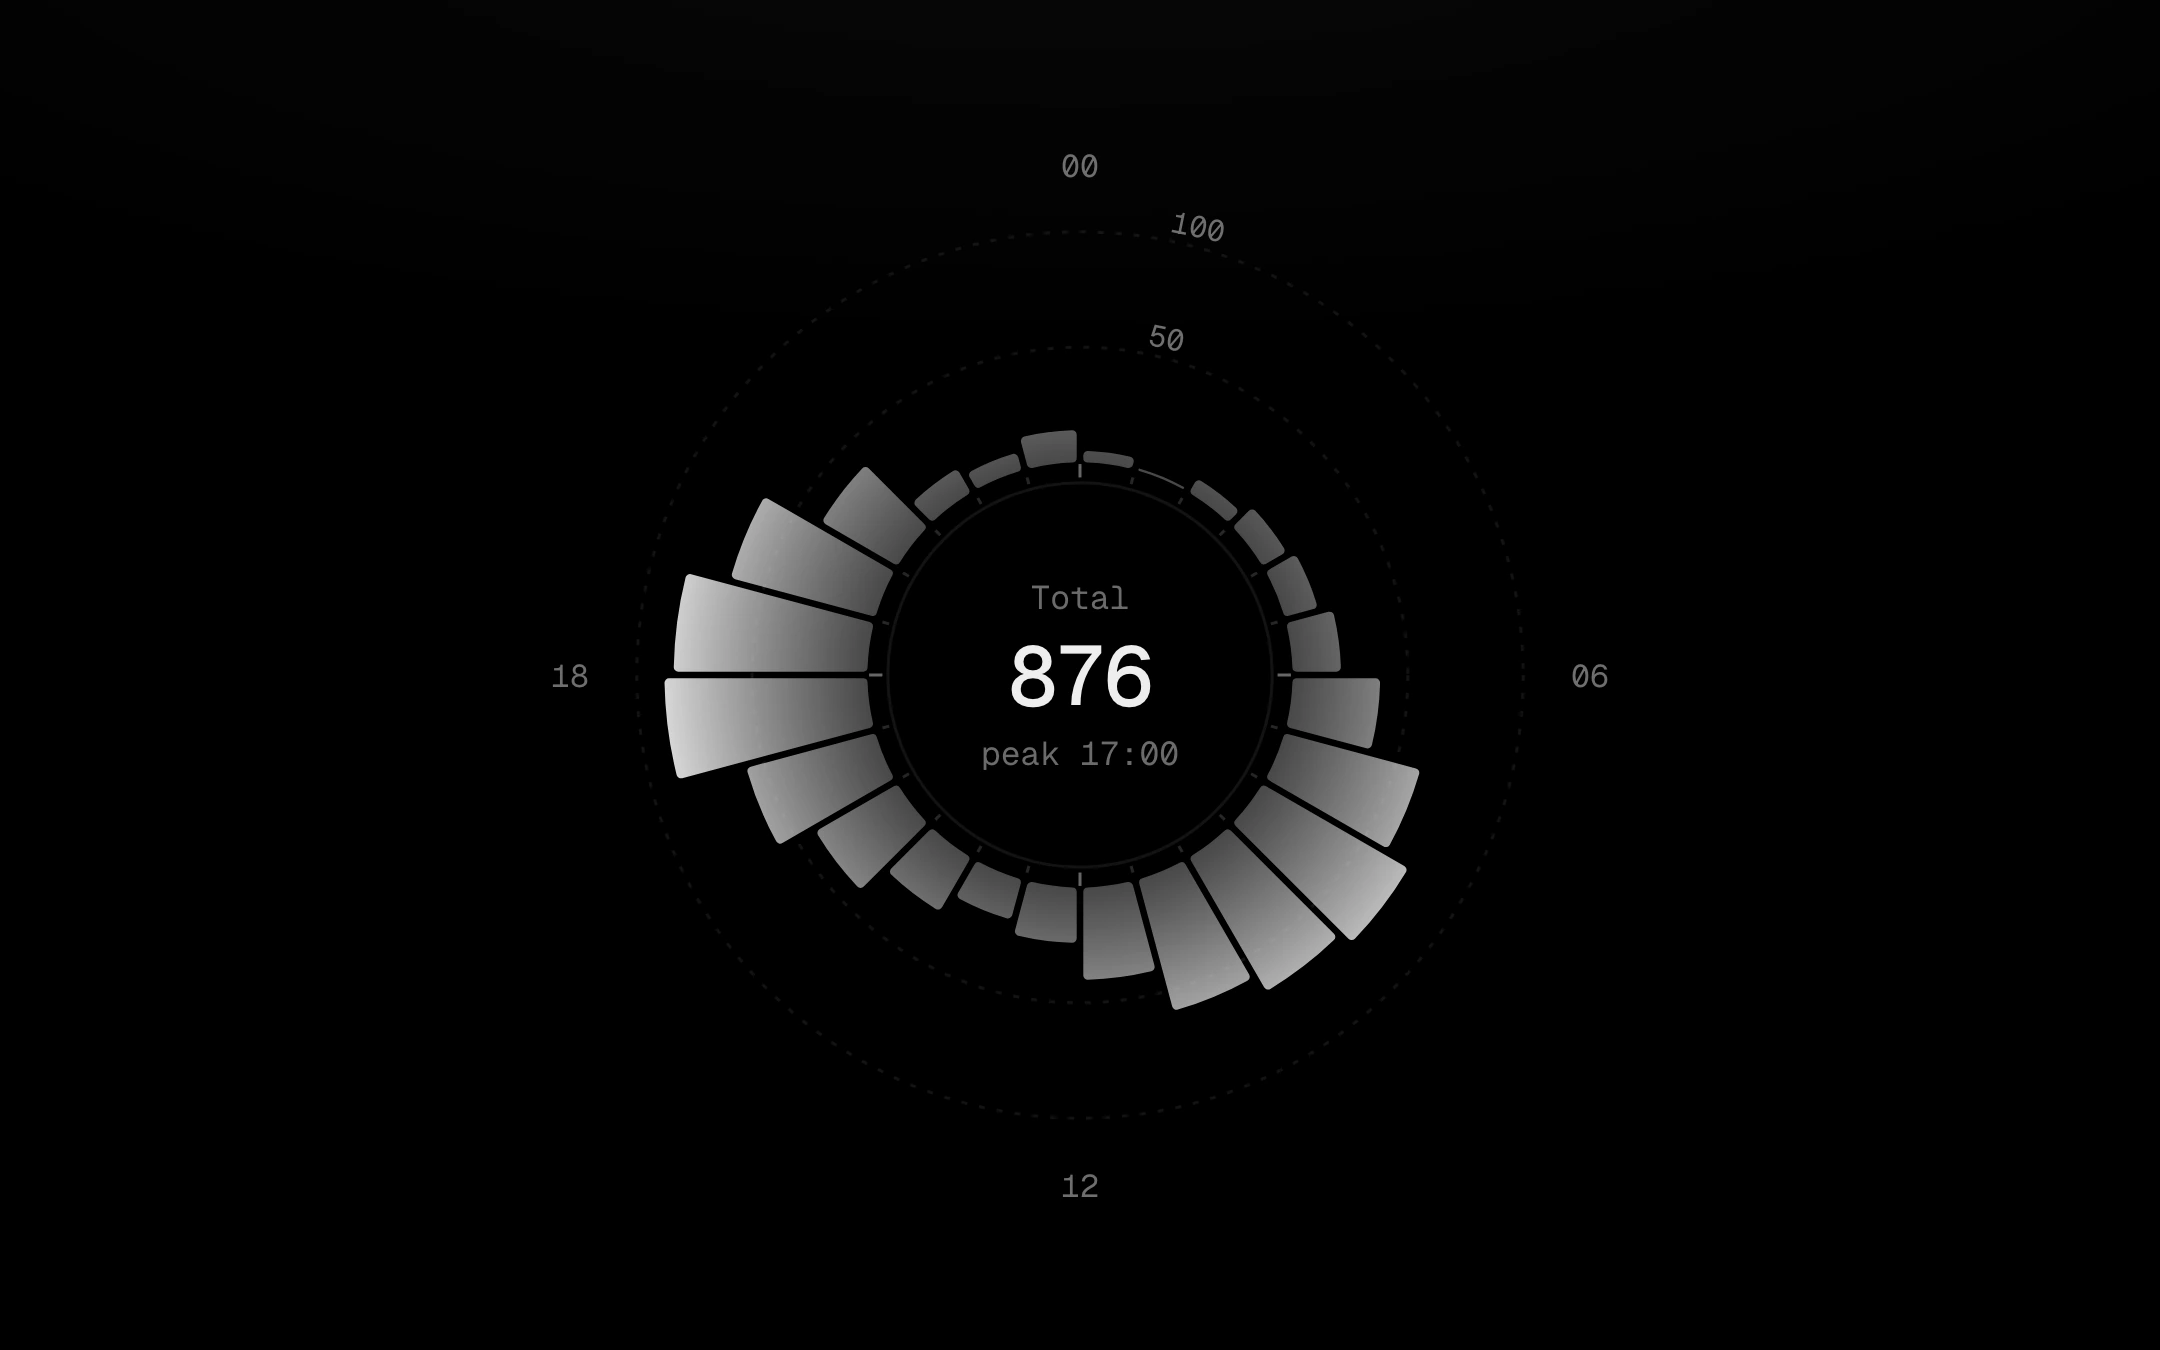
A day around a dial, drawn as a radial instrument: a tight tick ring just outside the hole, hour labels well outside the values, faint value rings, and bins that glow outward (dim at the root, full strength at the tip) as arc bars or columns of dots at even density.
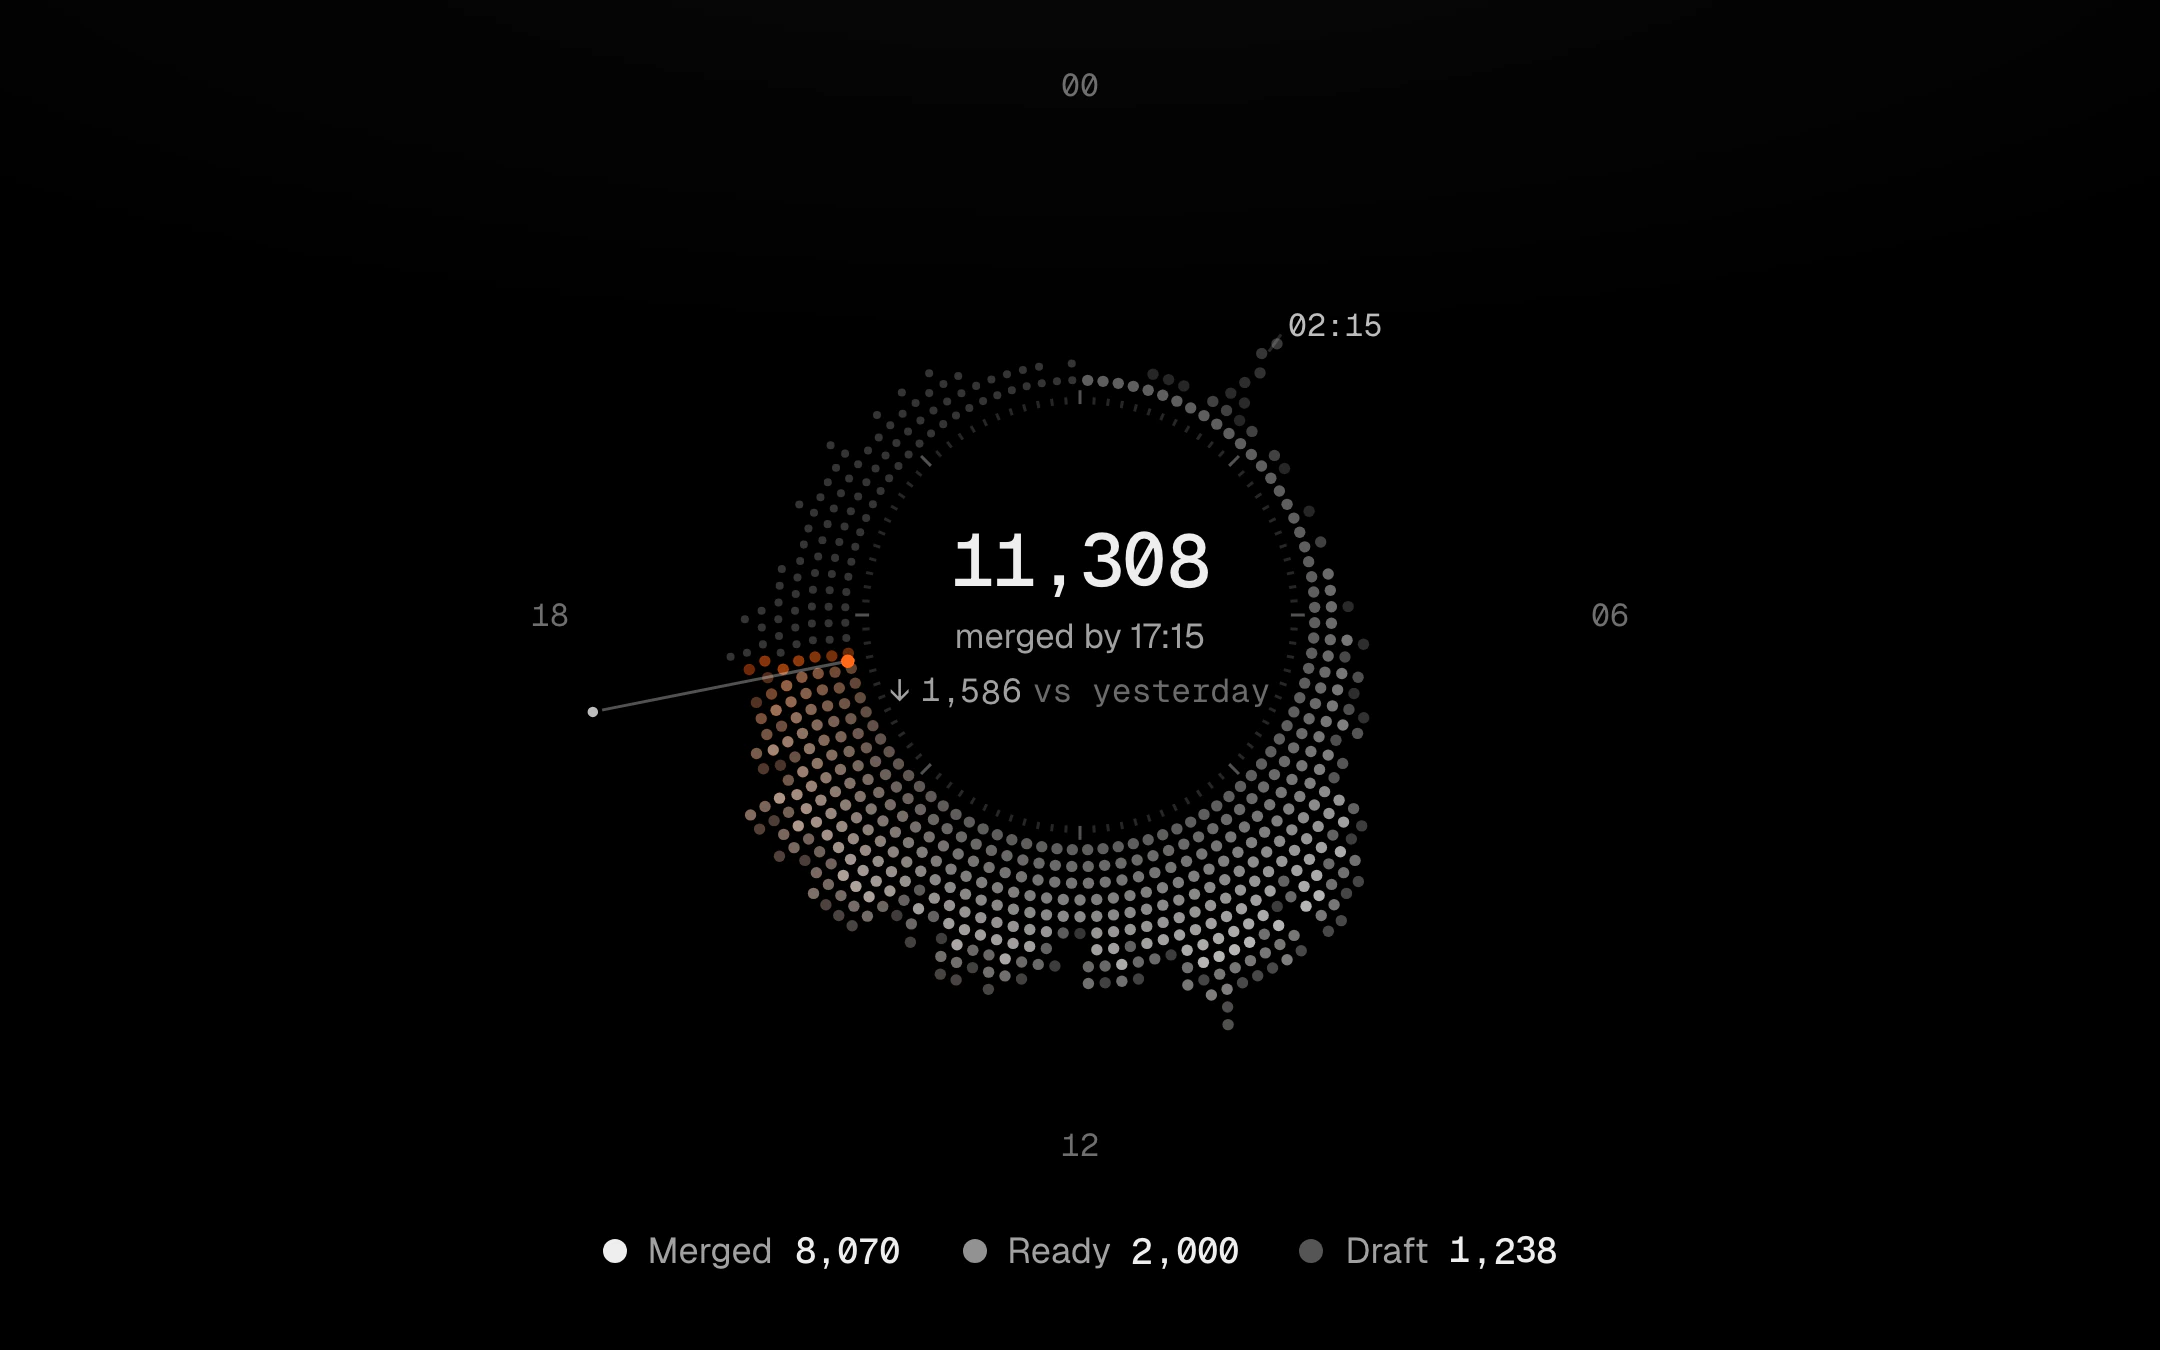
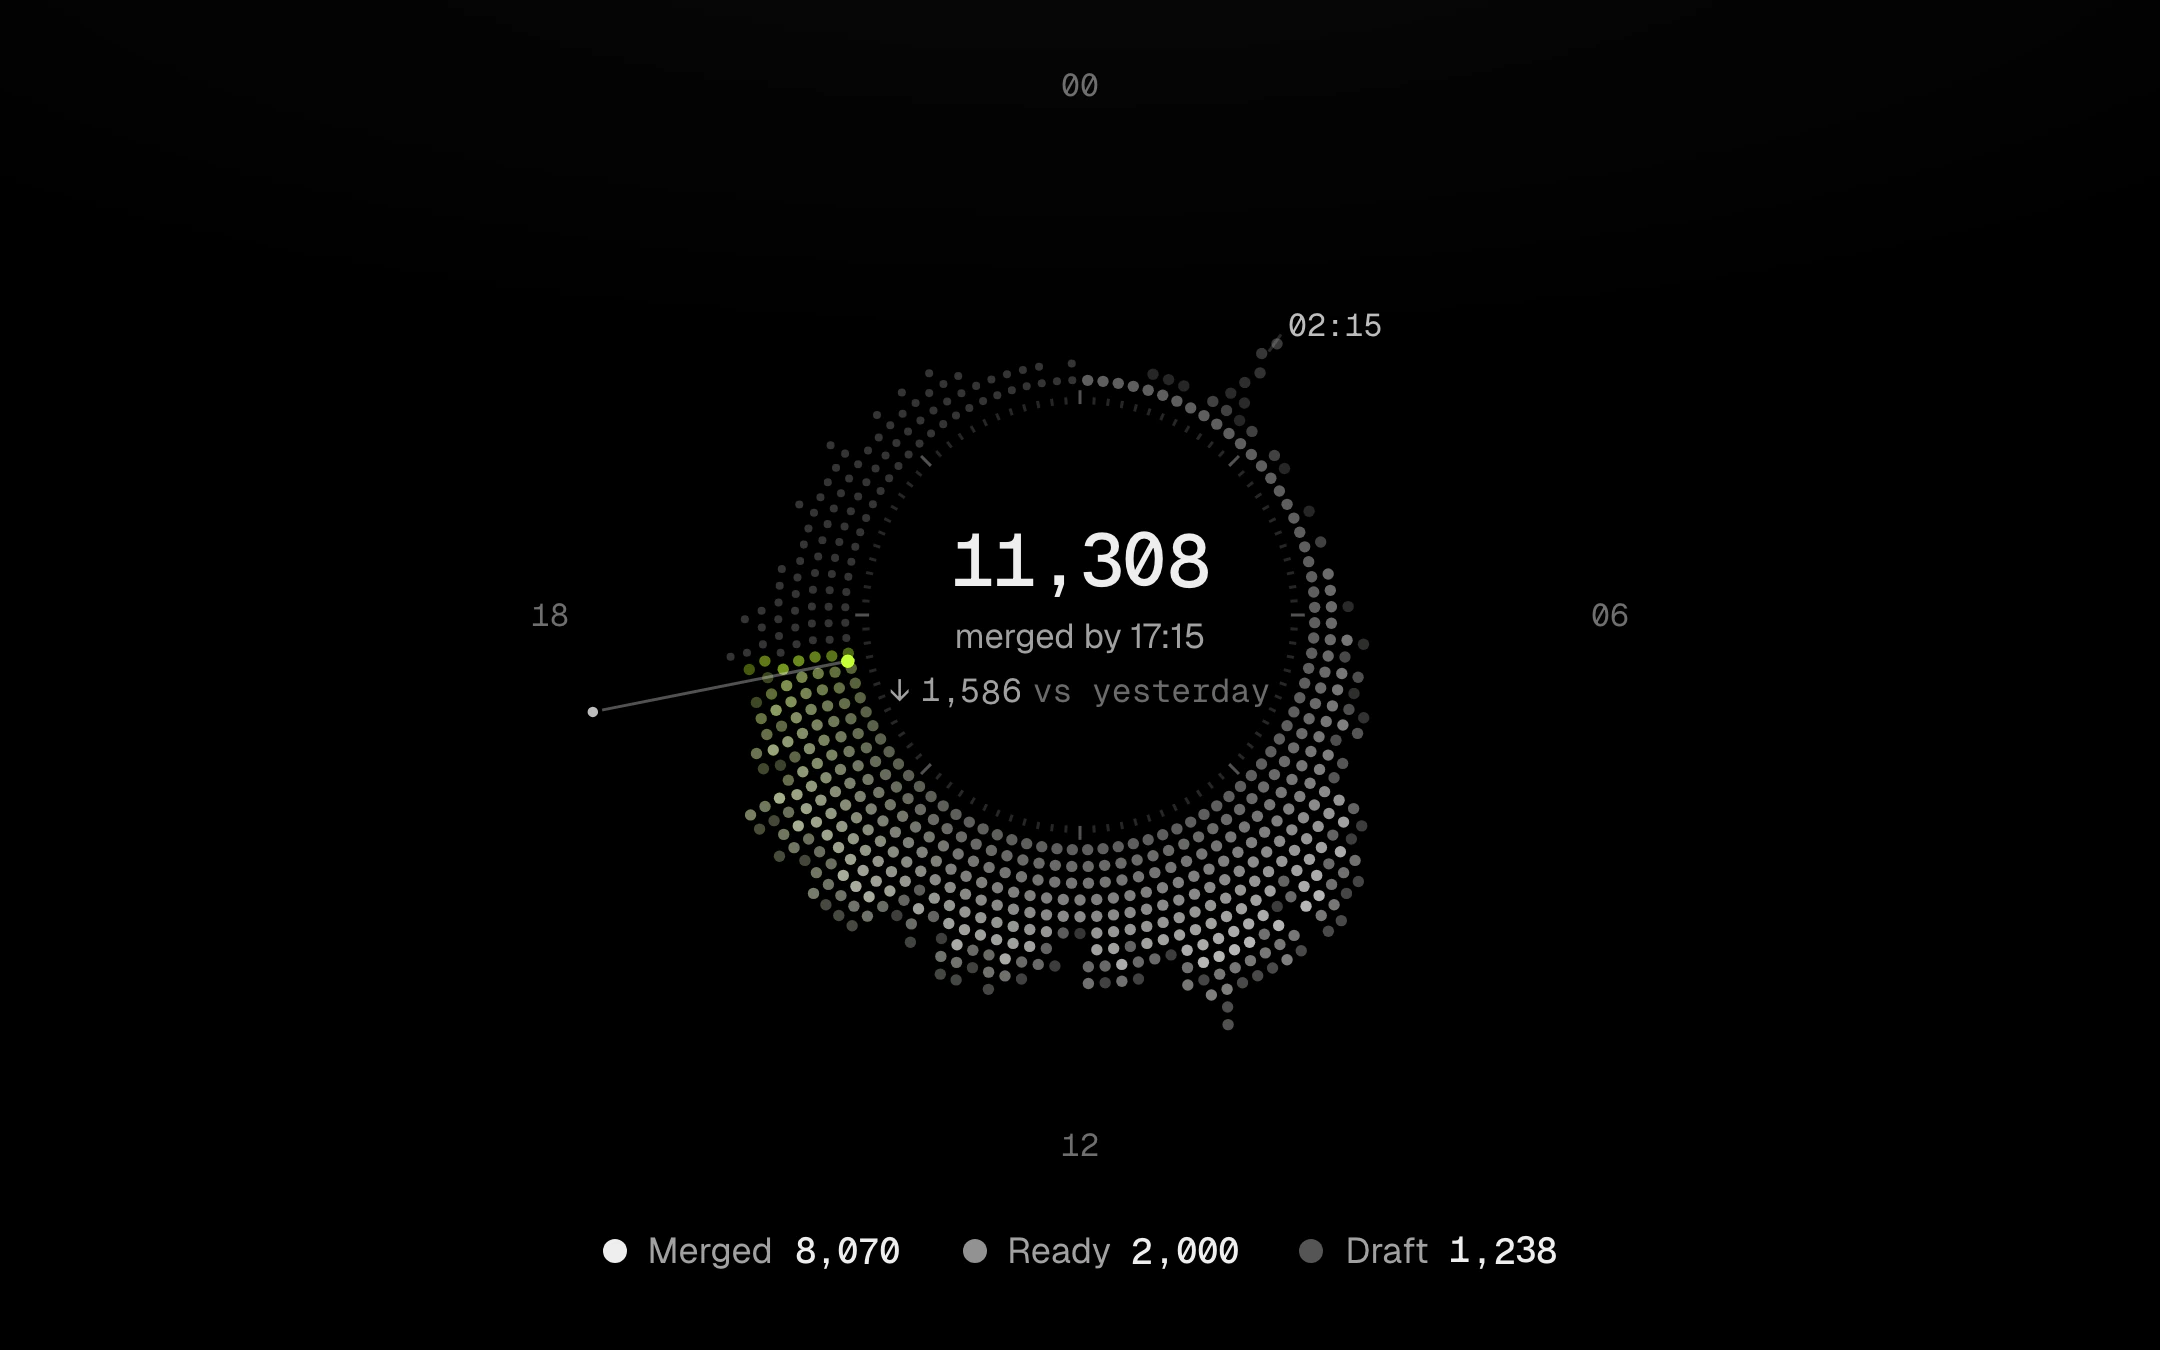
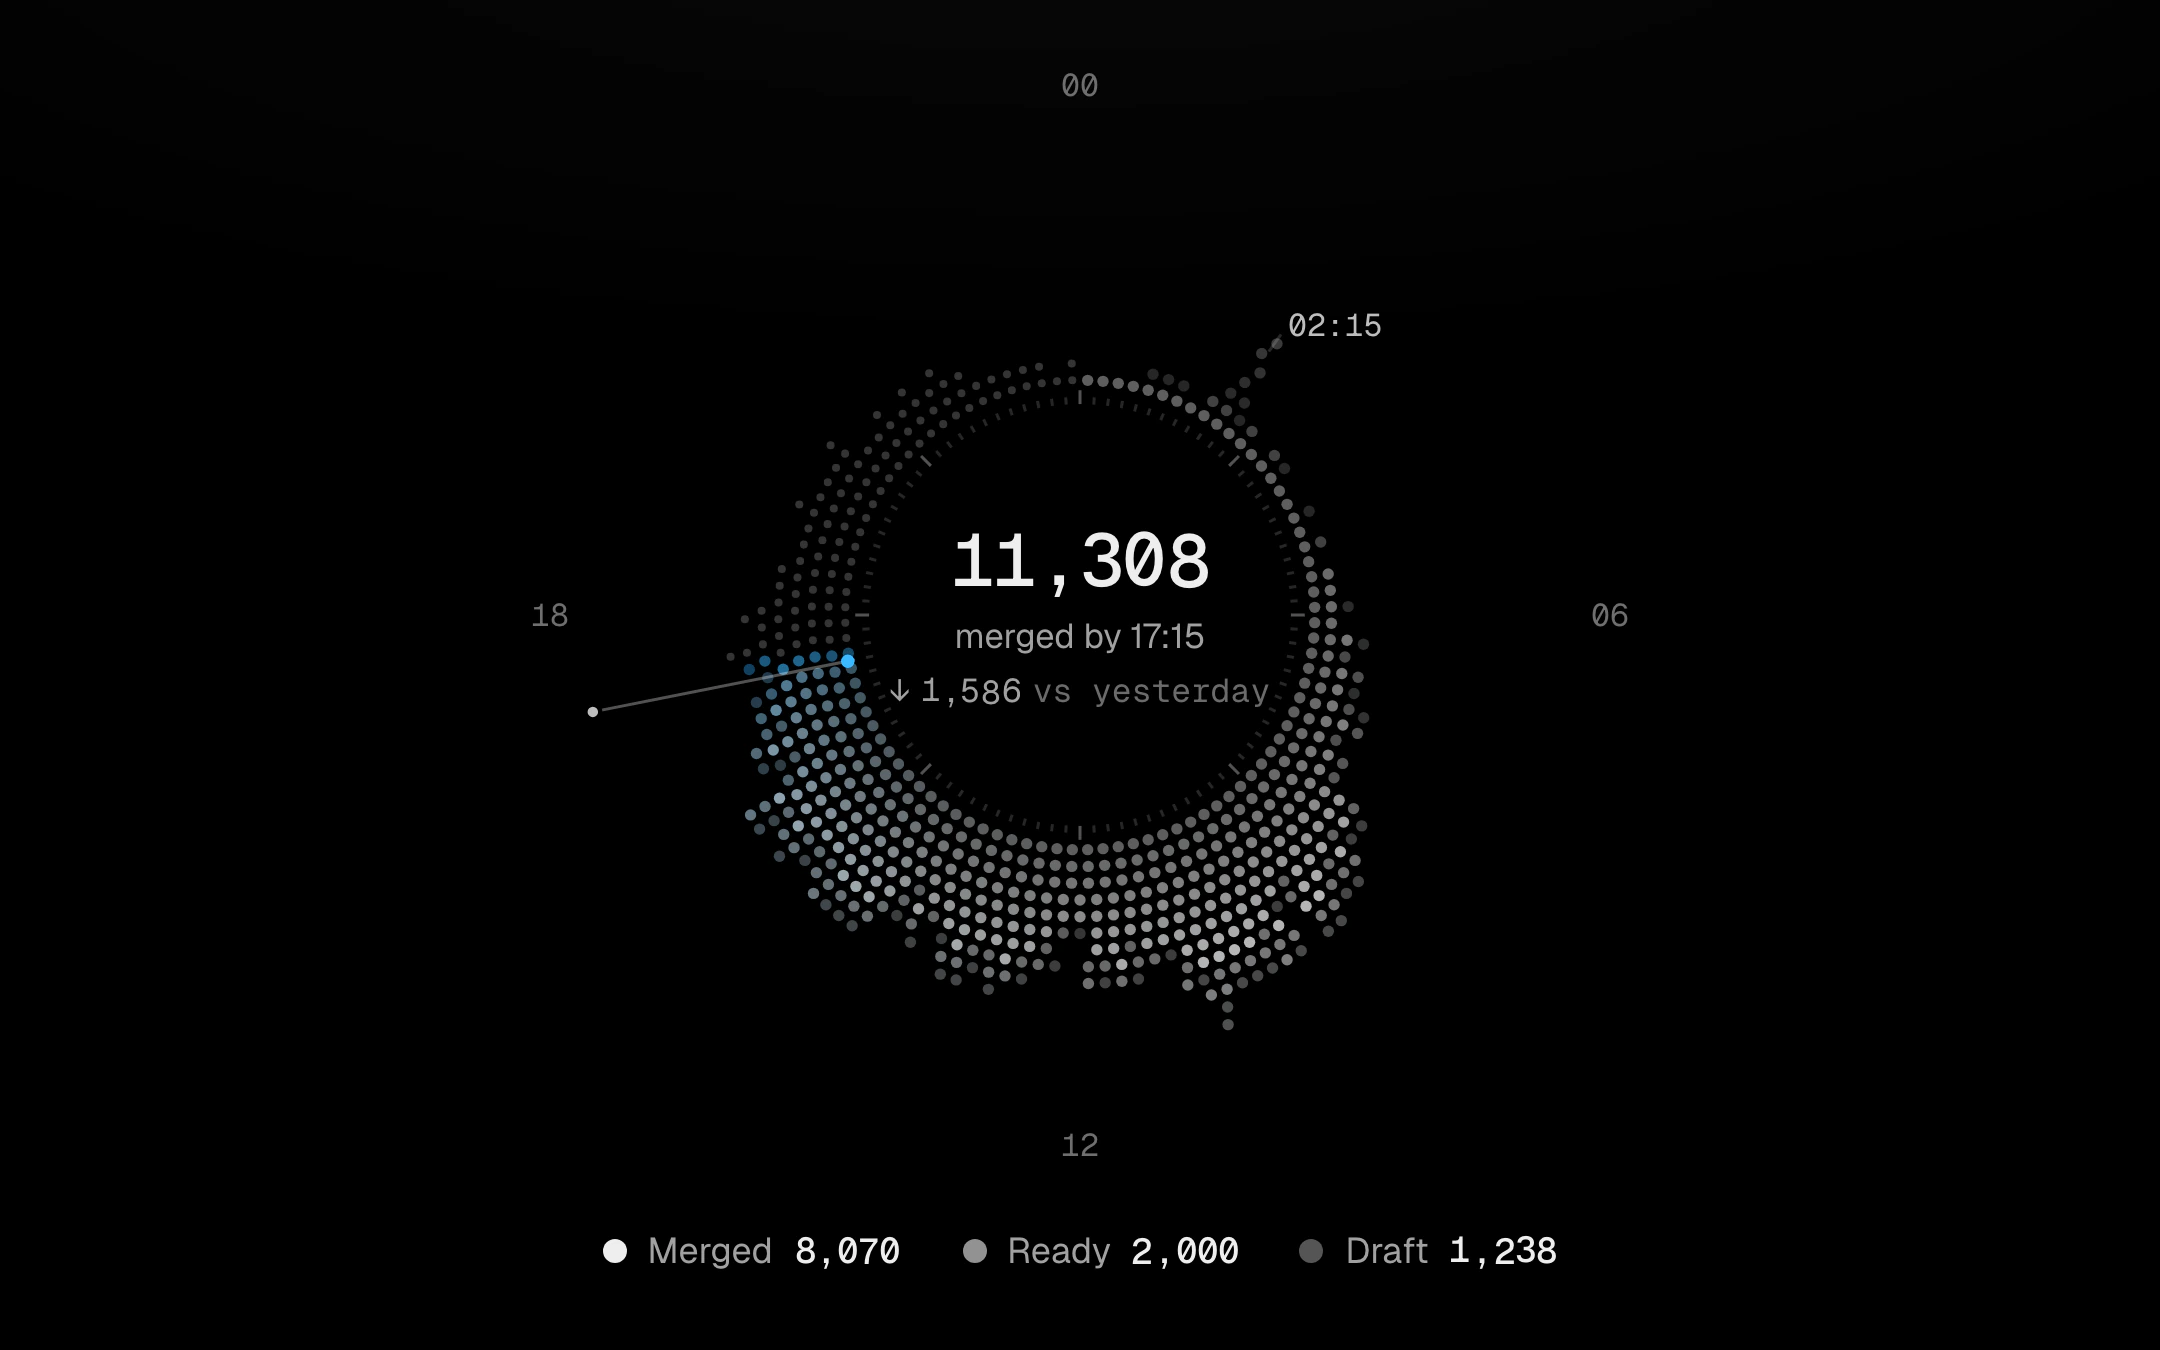
A day wrapped round a dial.
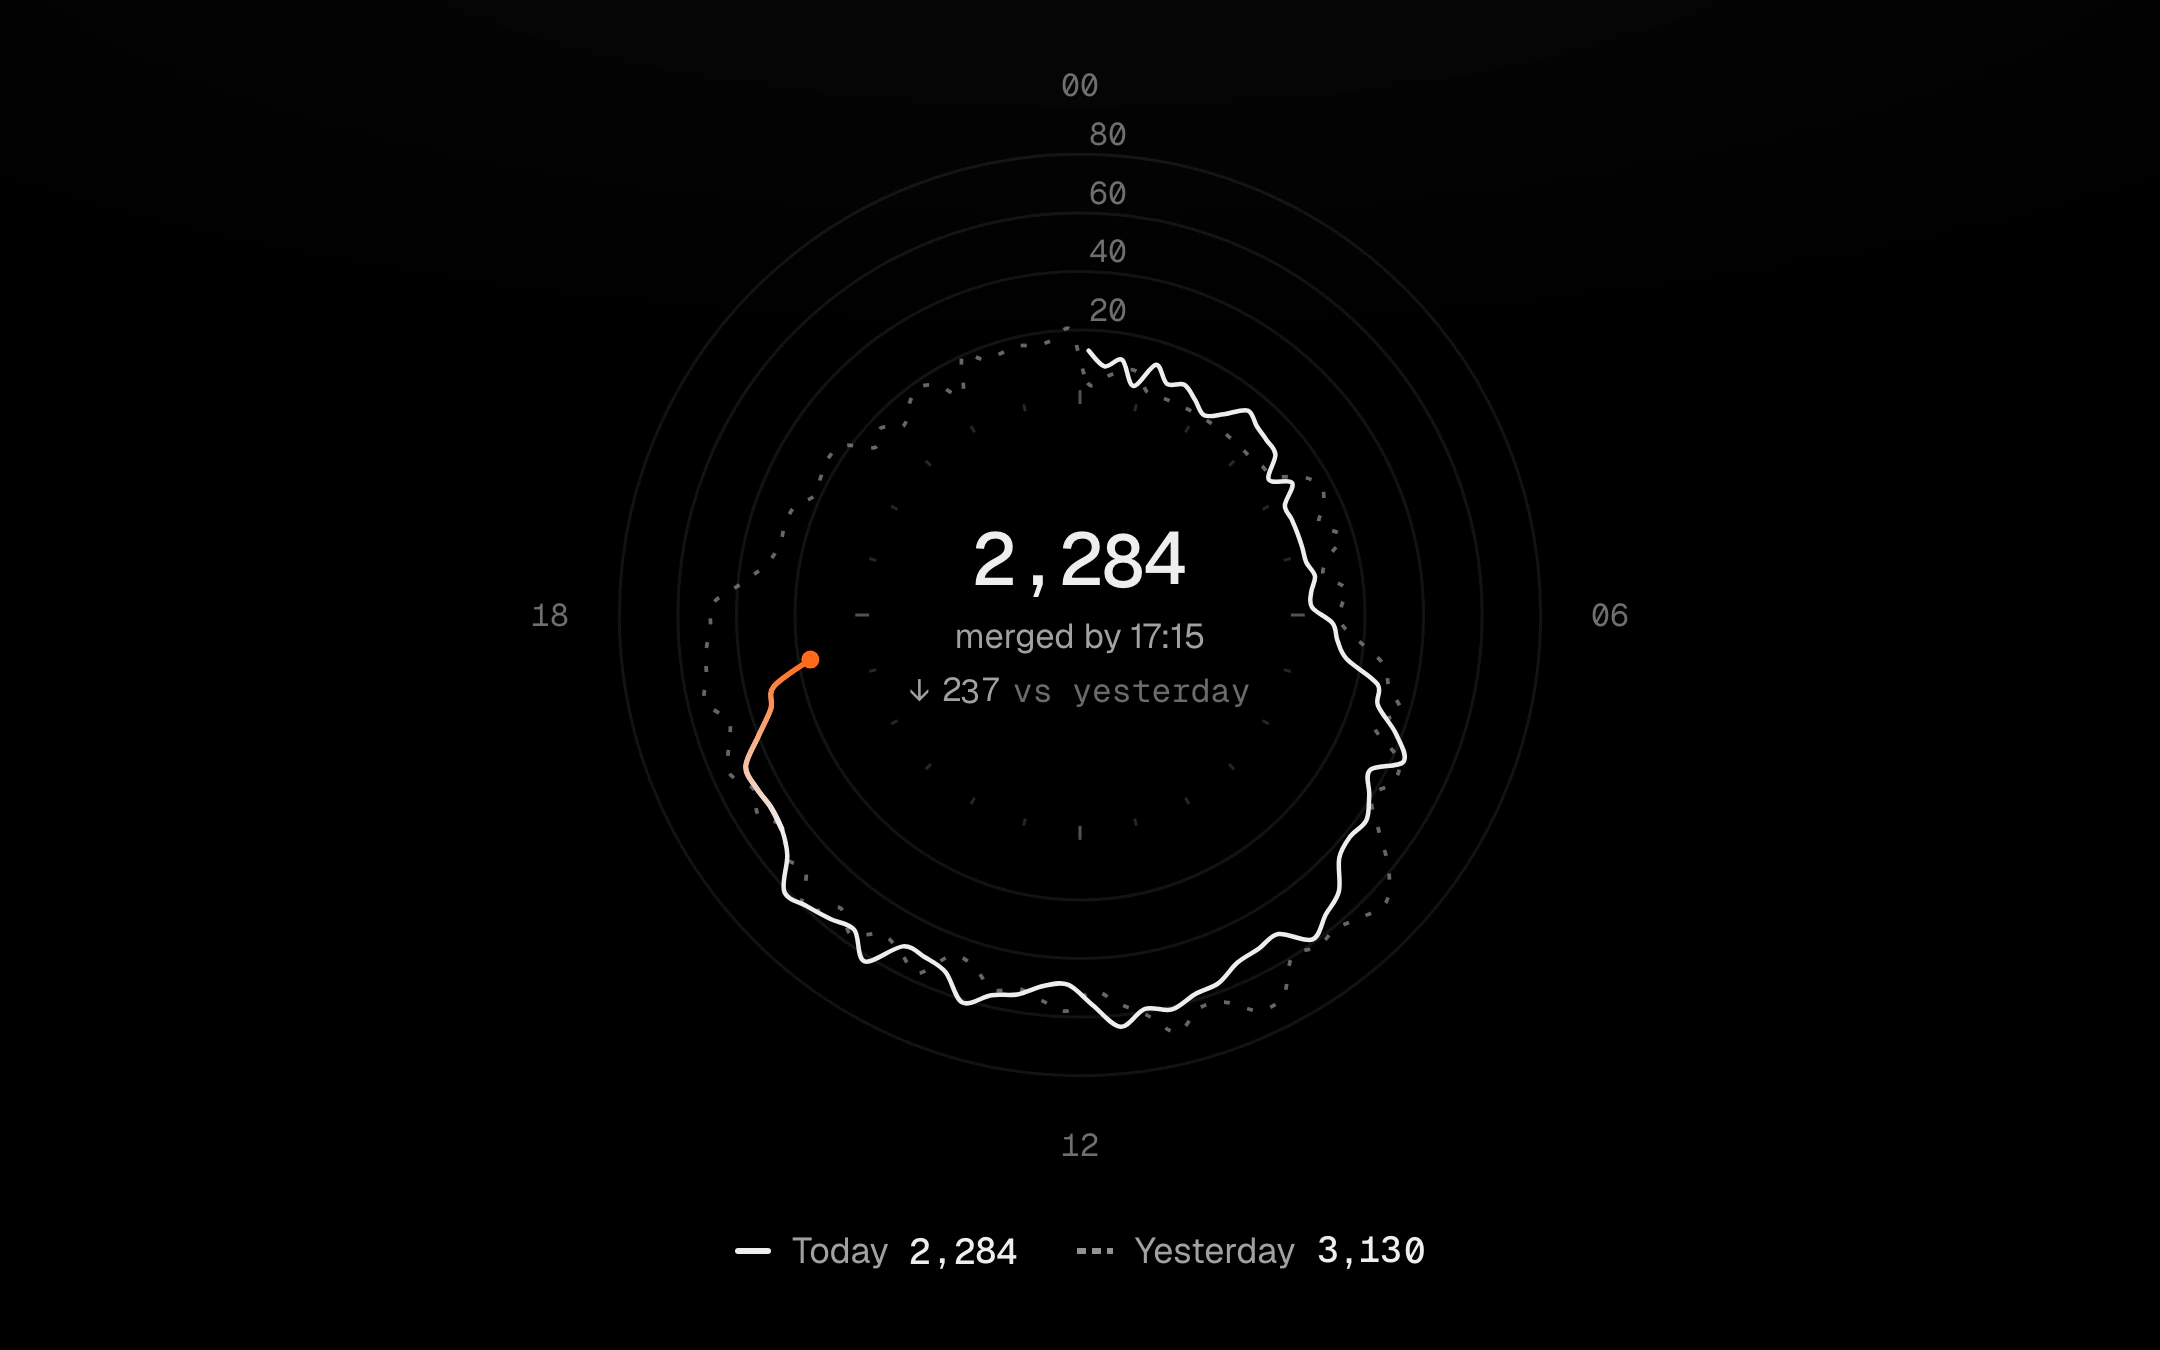
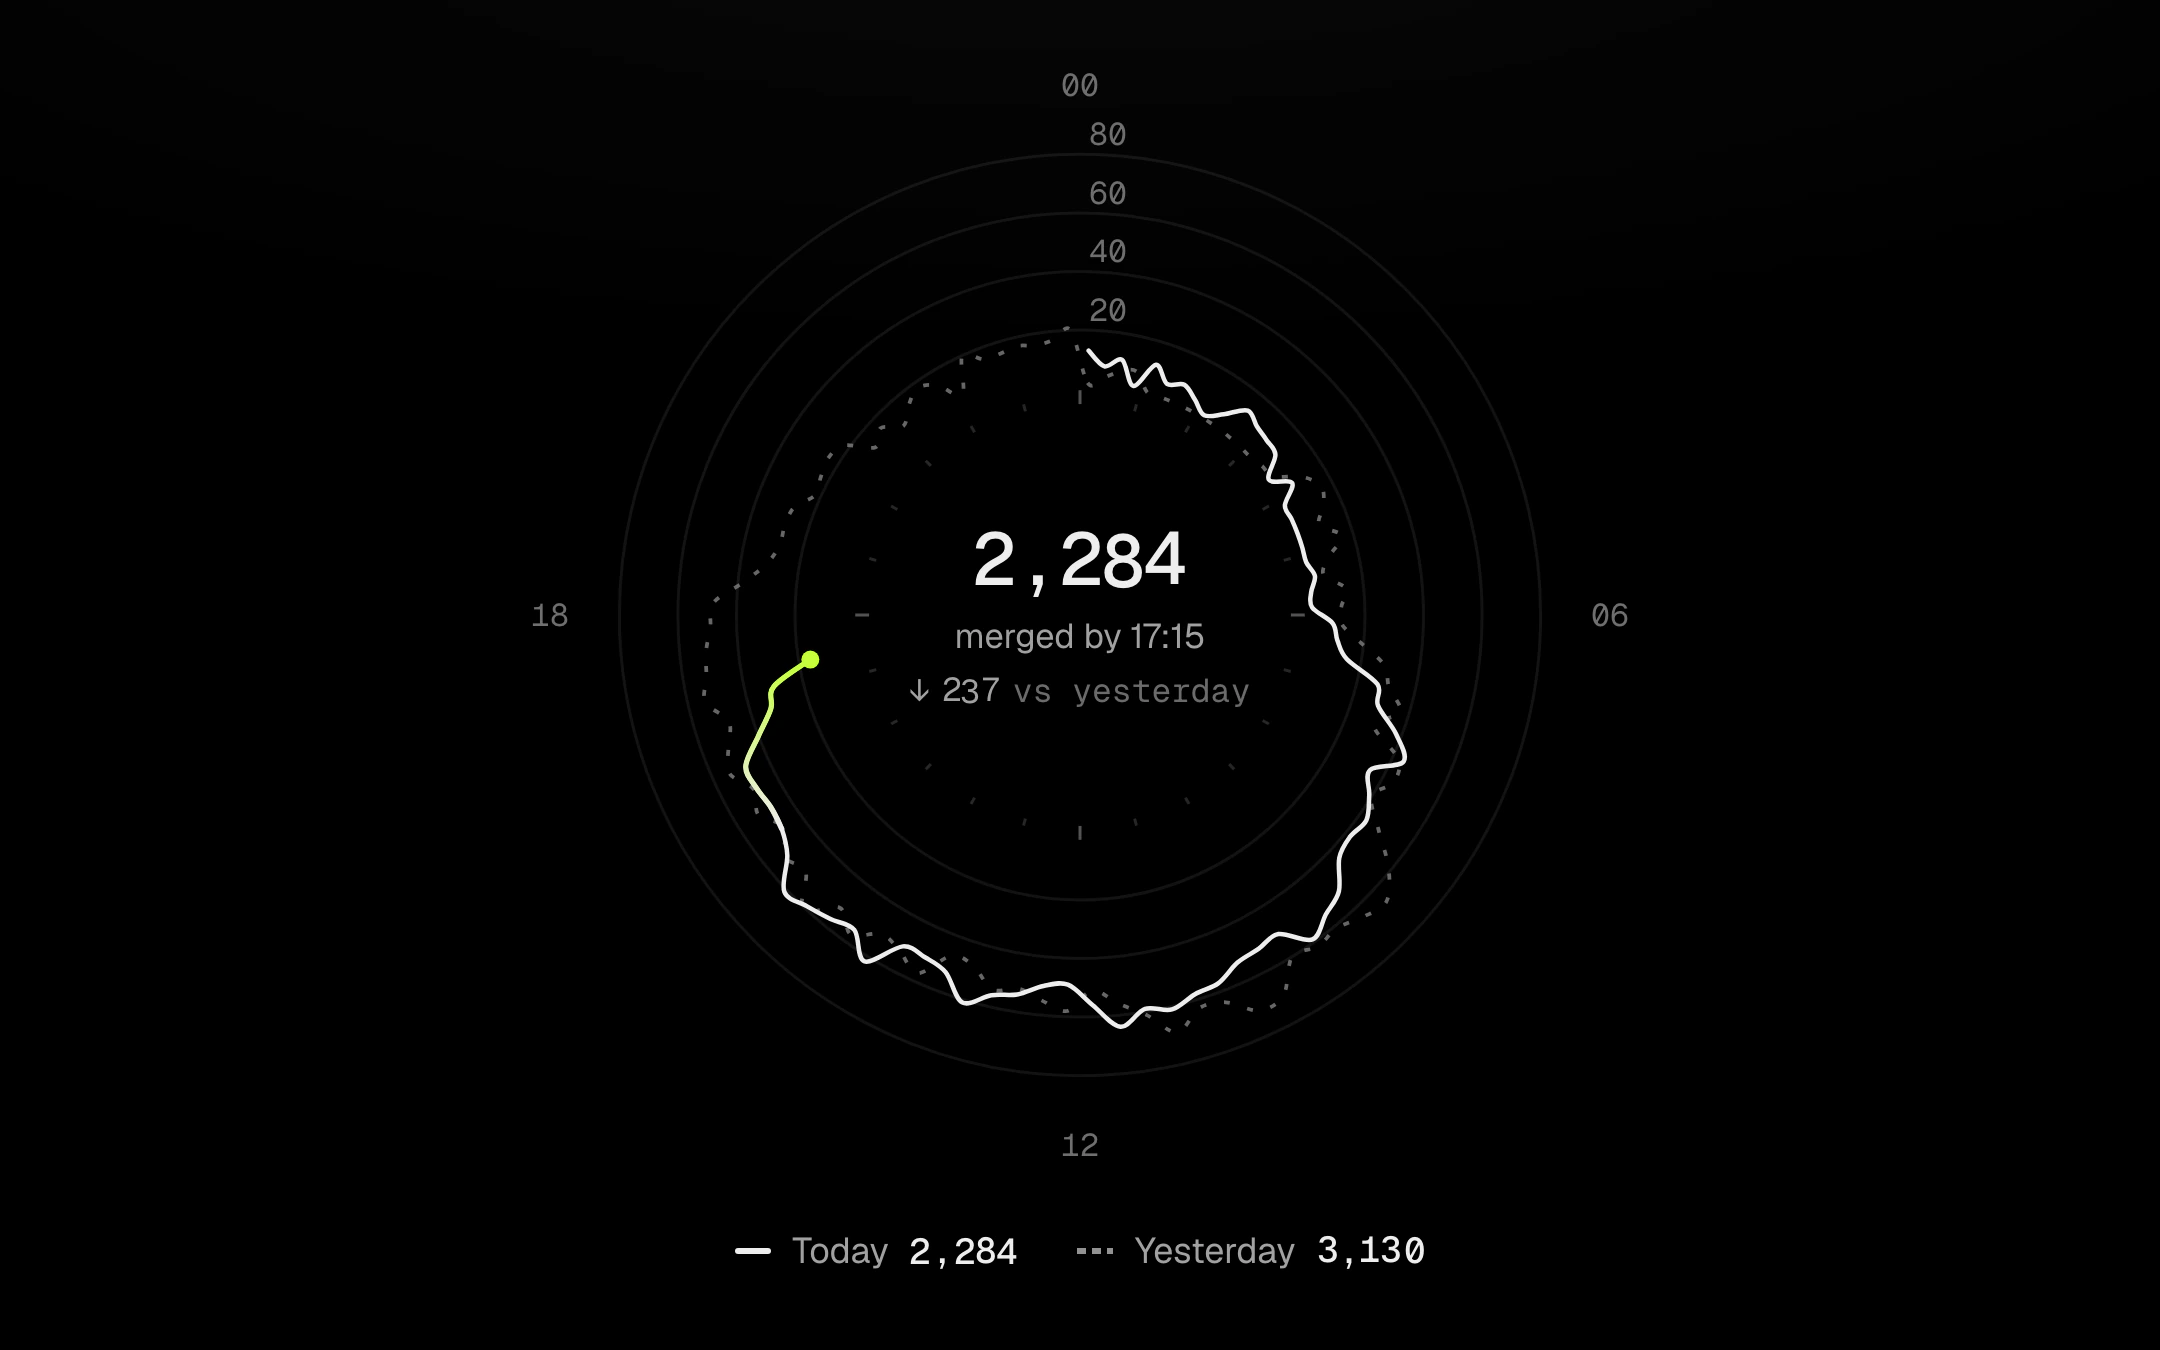
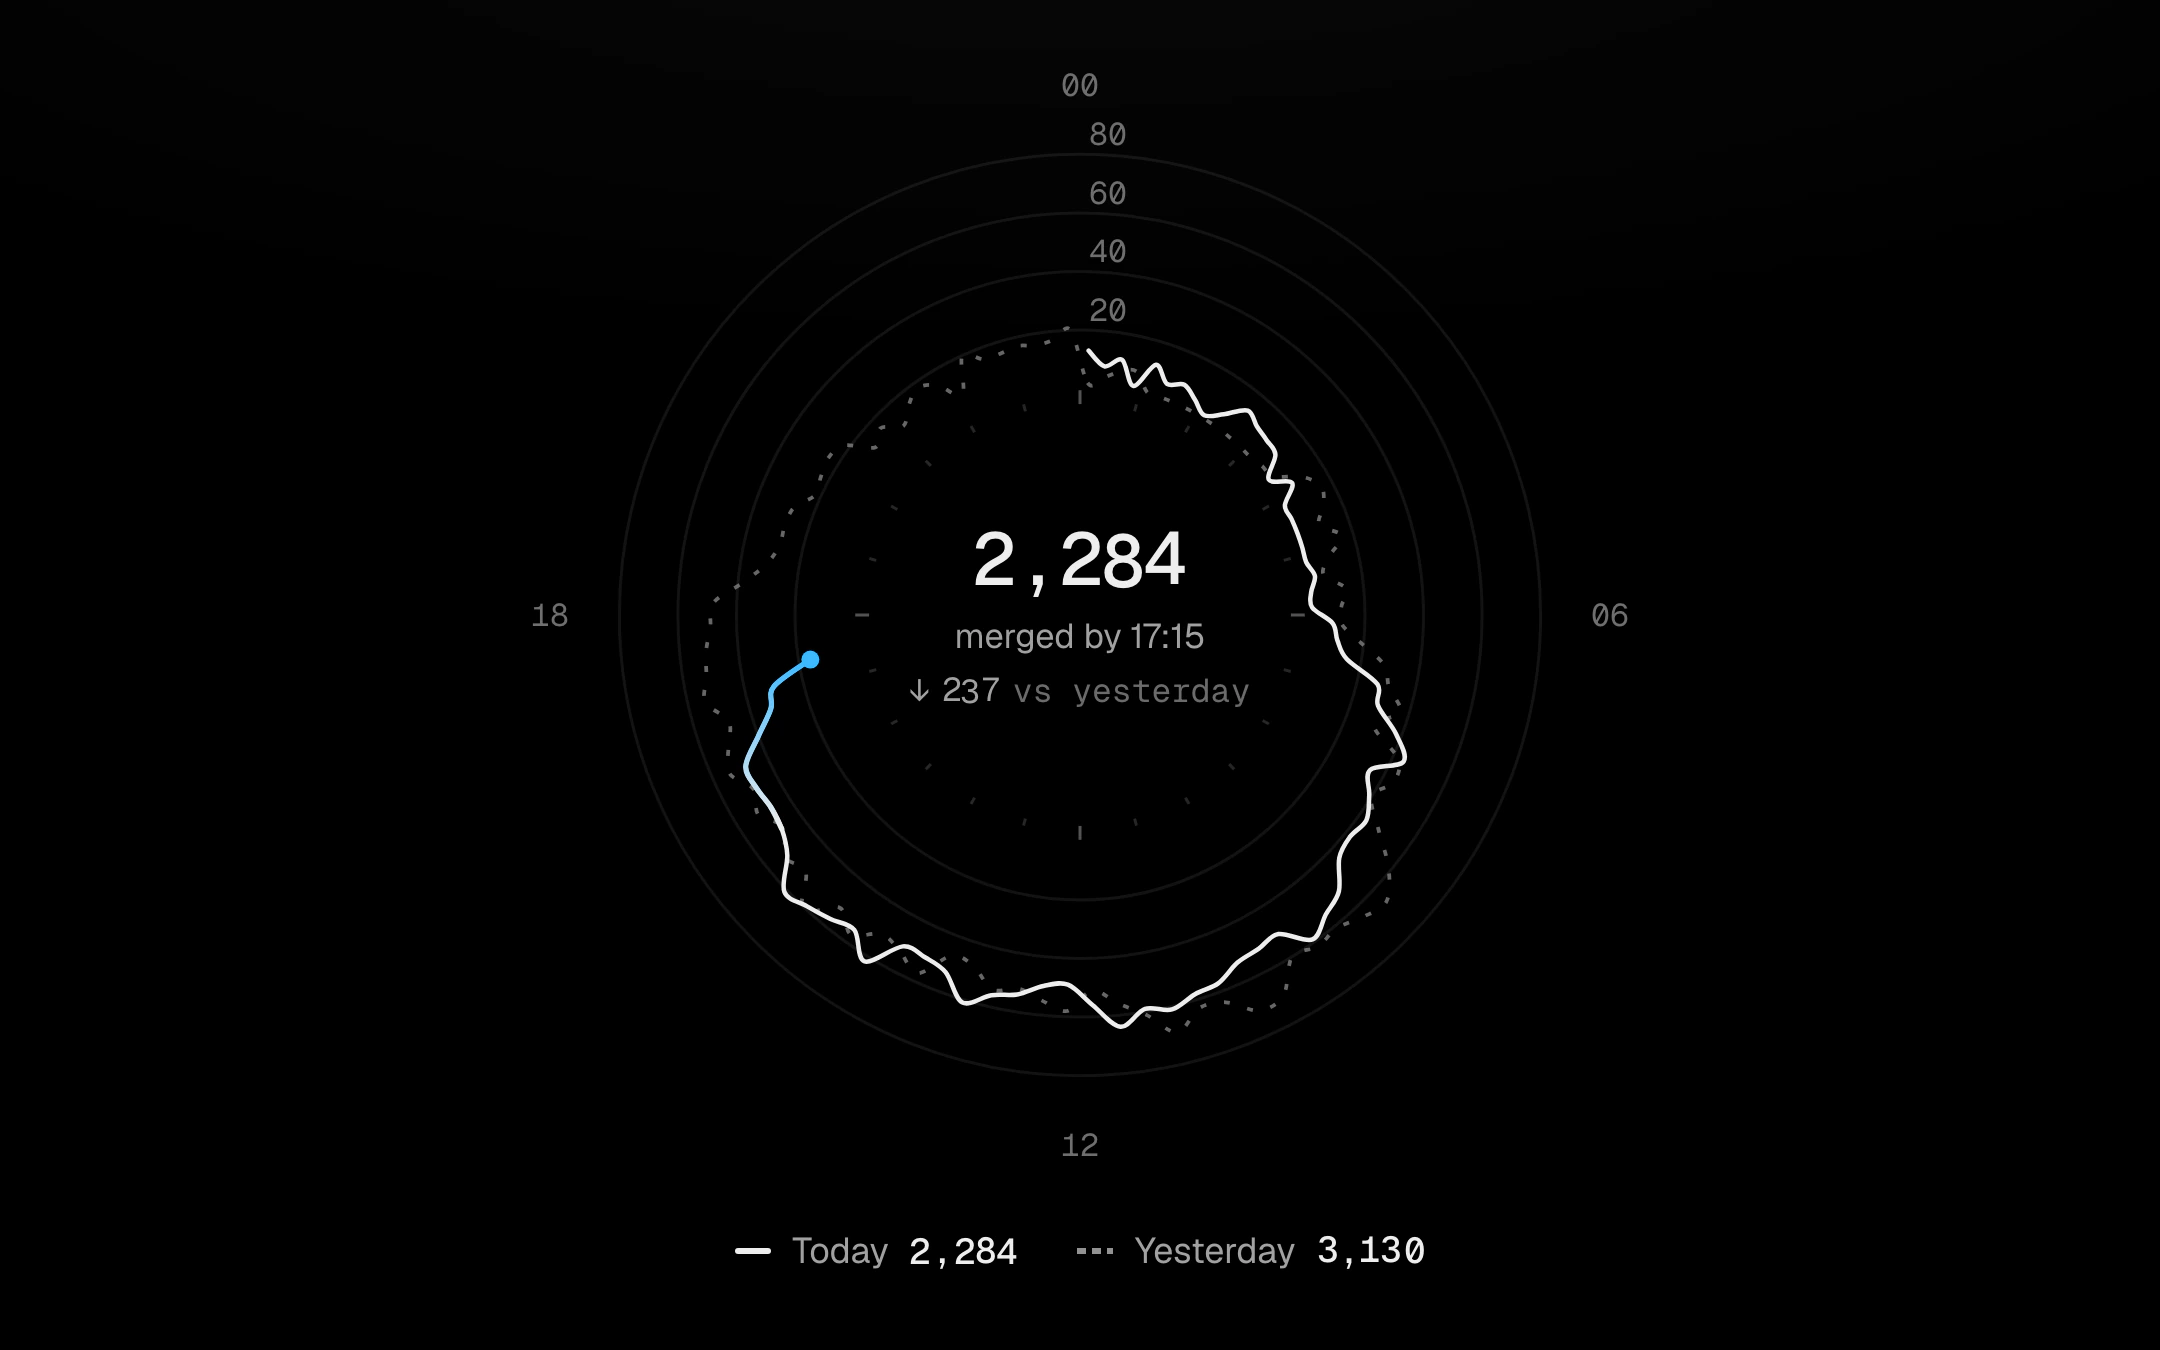
Today as an open line round a 24-hour dial, ending in a pulsing dot at now, against yesterday’s dashed full loop on the same scale, inside an instrument tick ring and faint value rings.
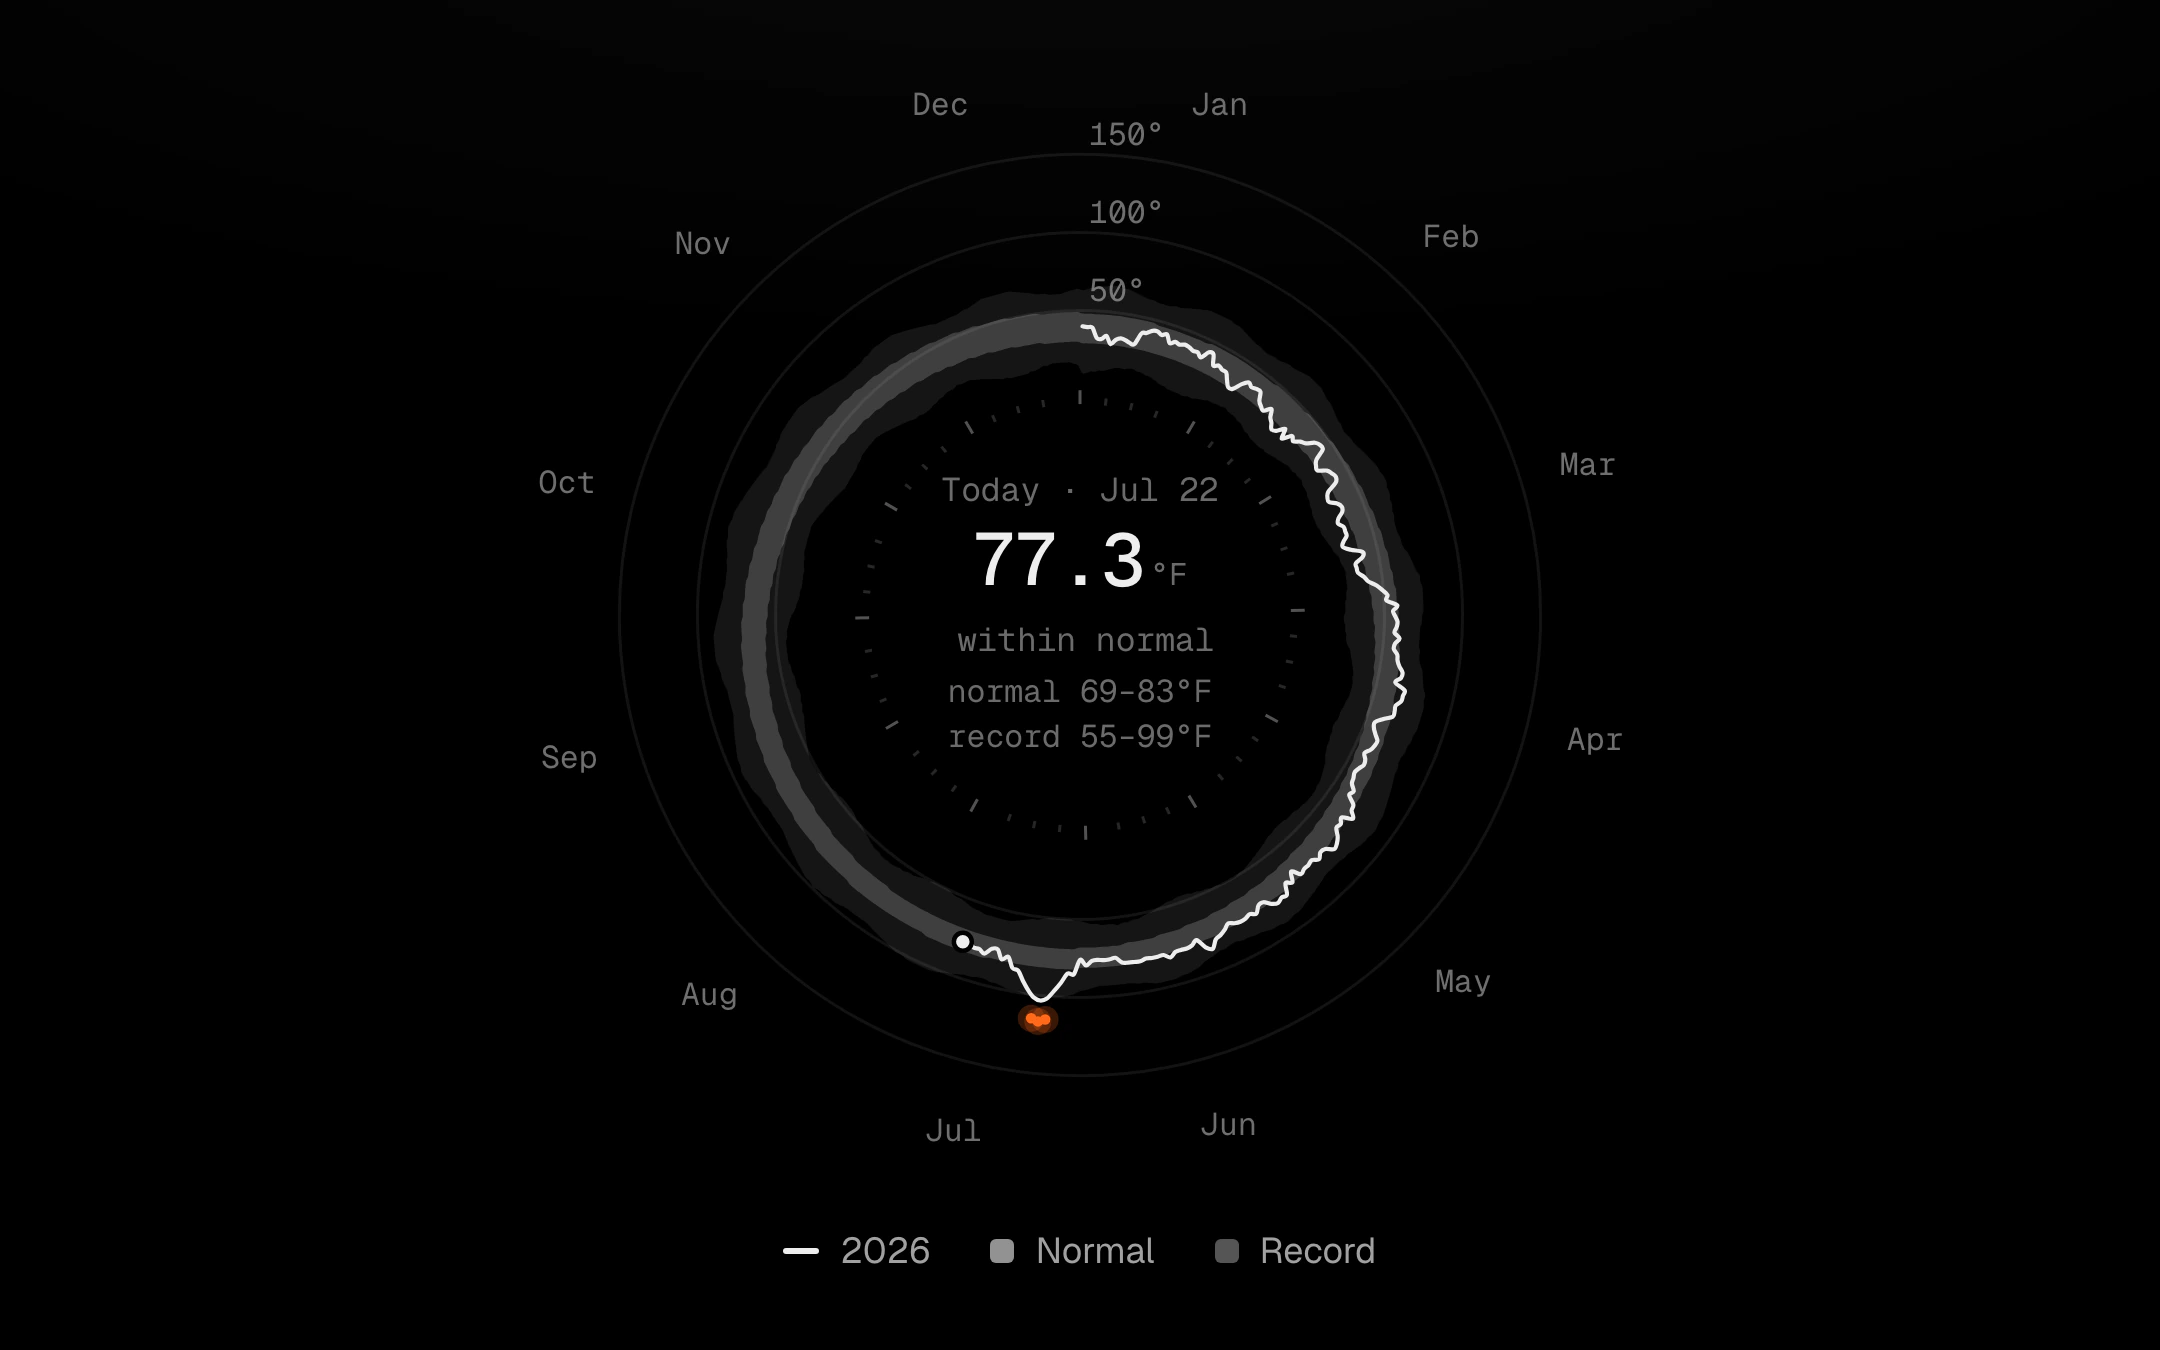
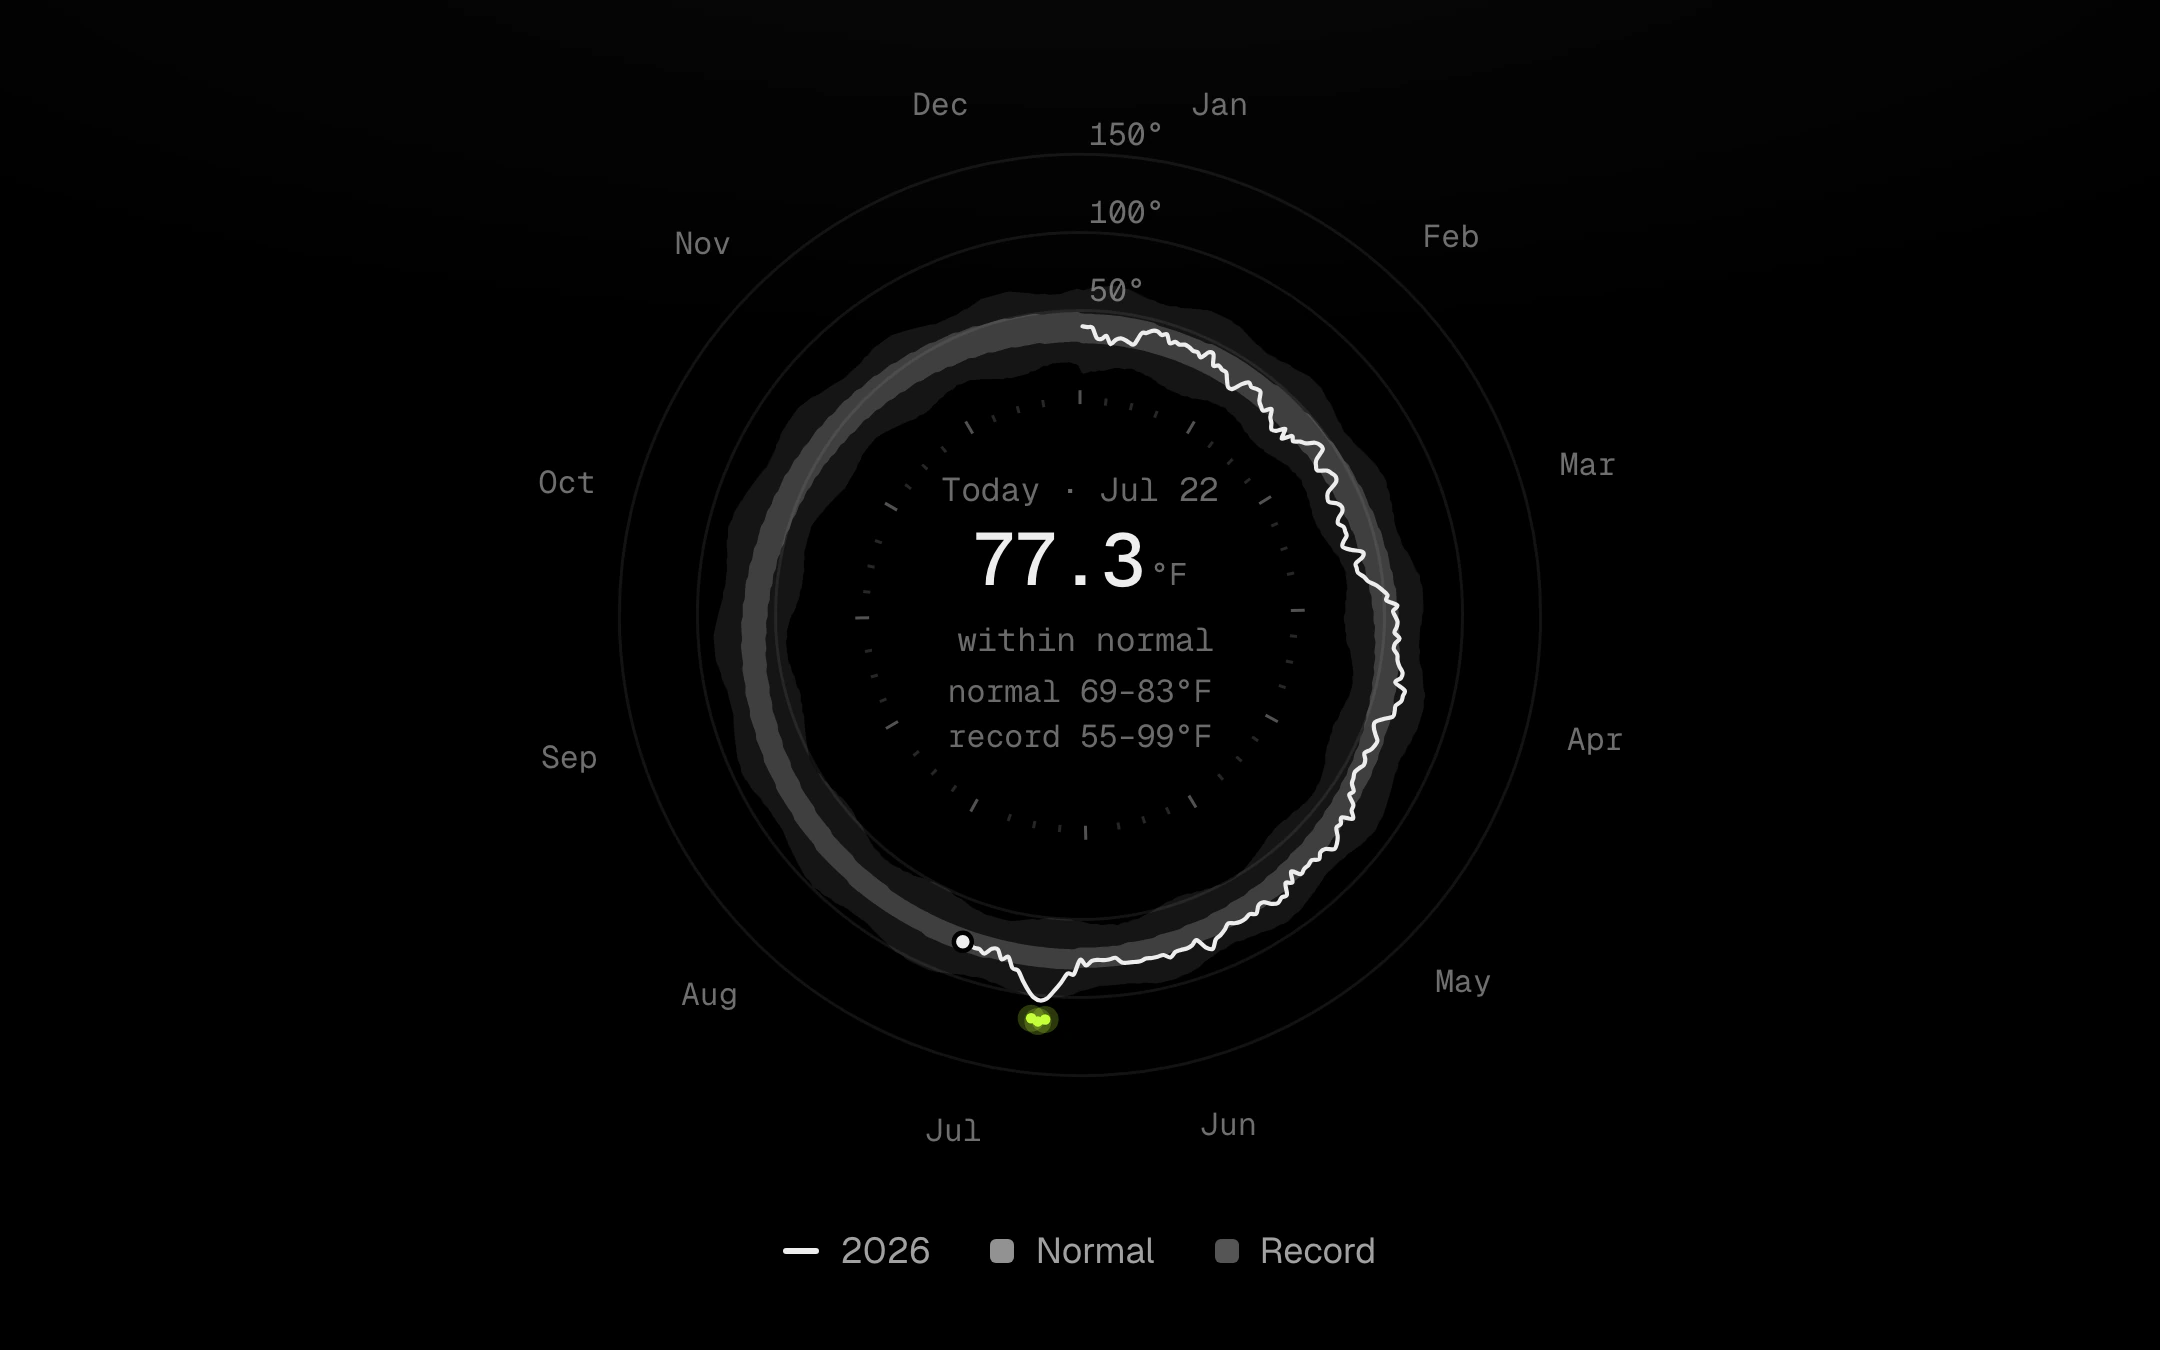
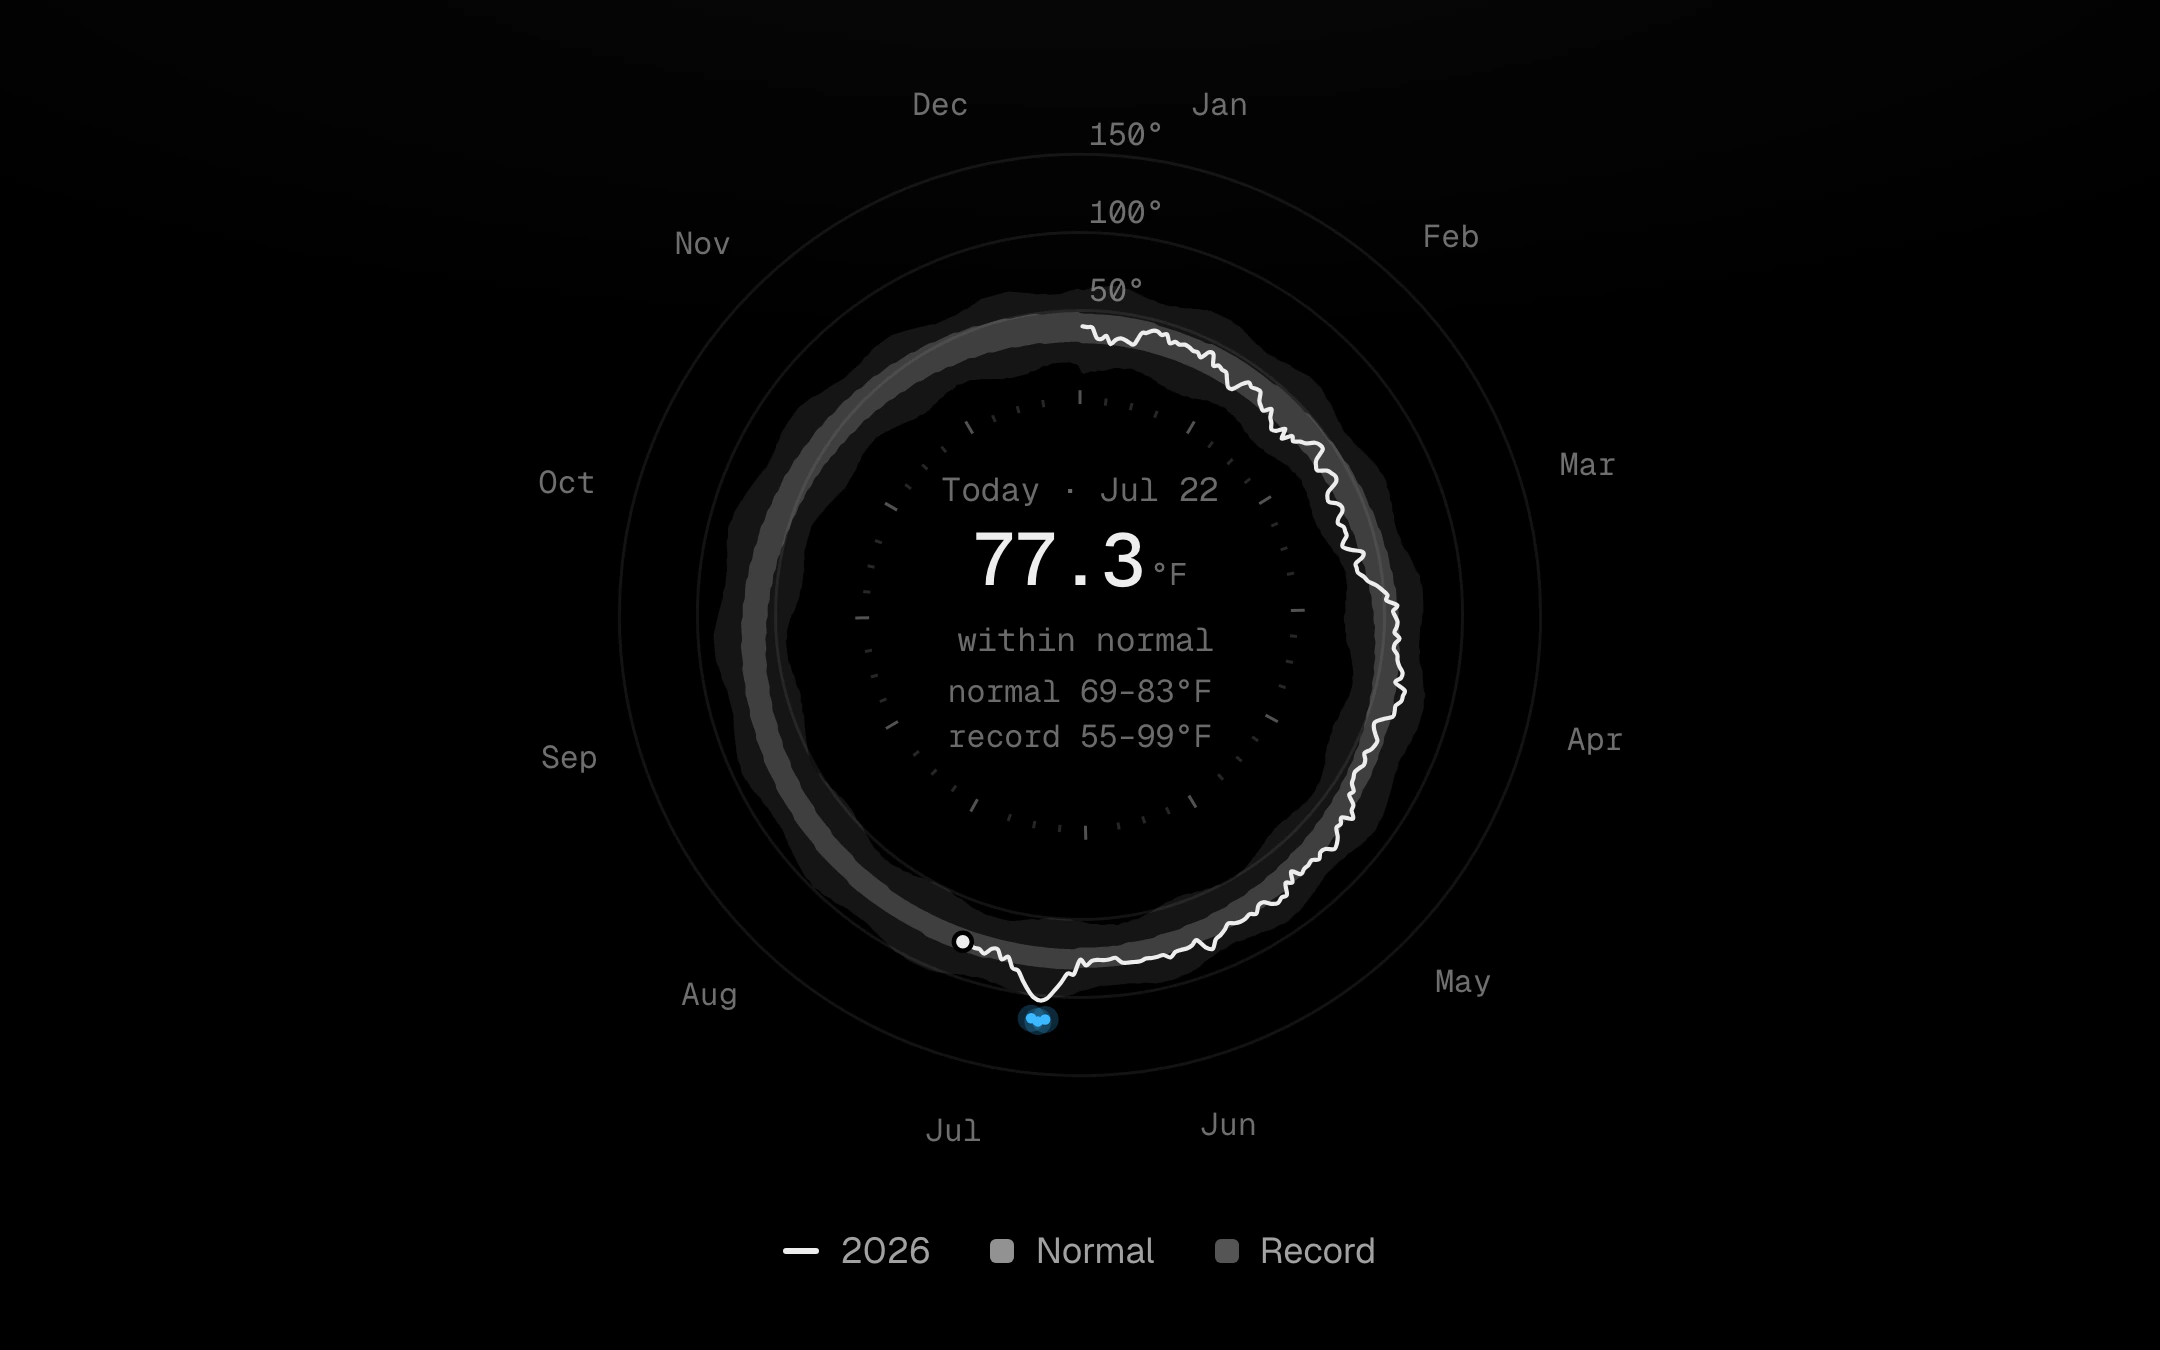
A year wrapped into a loop.
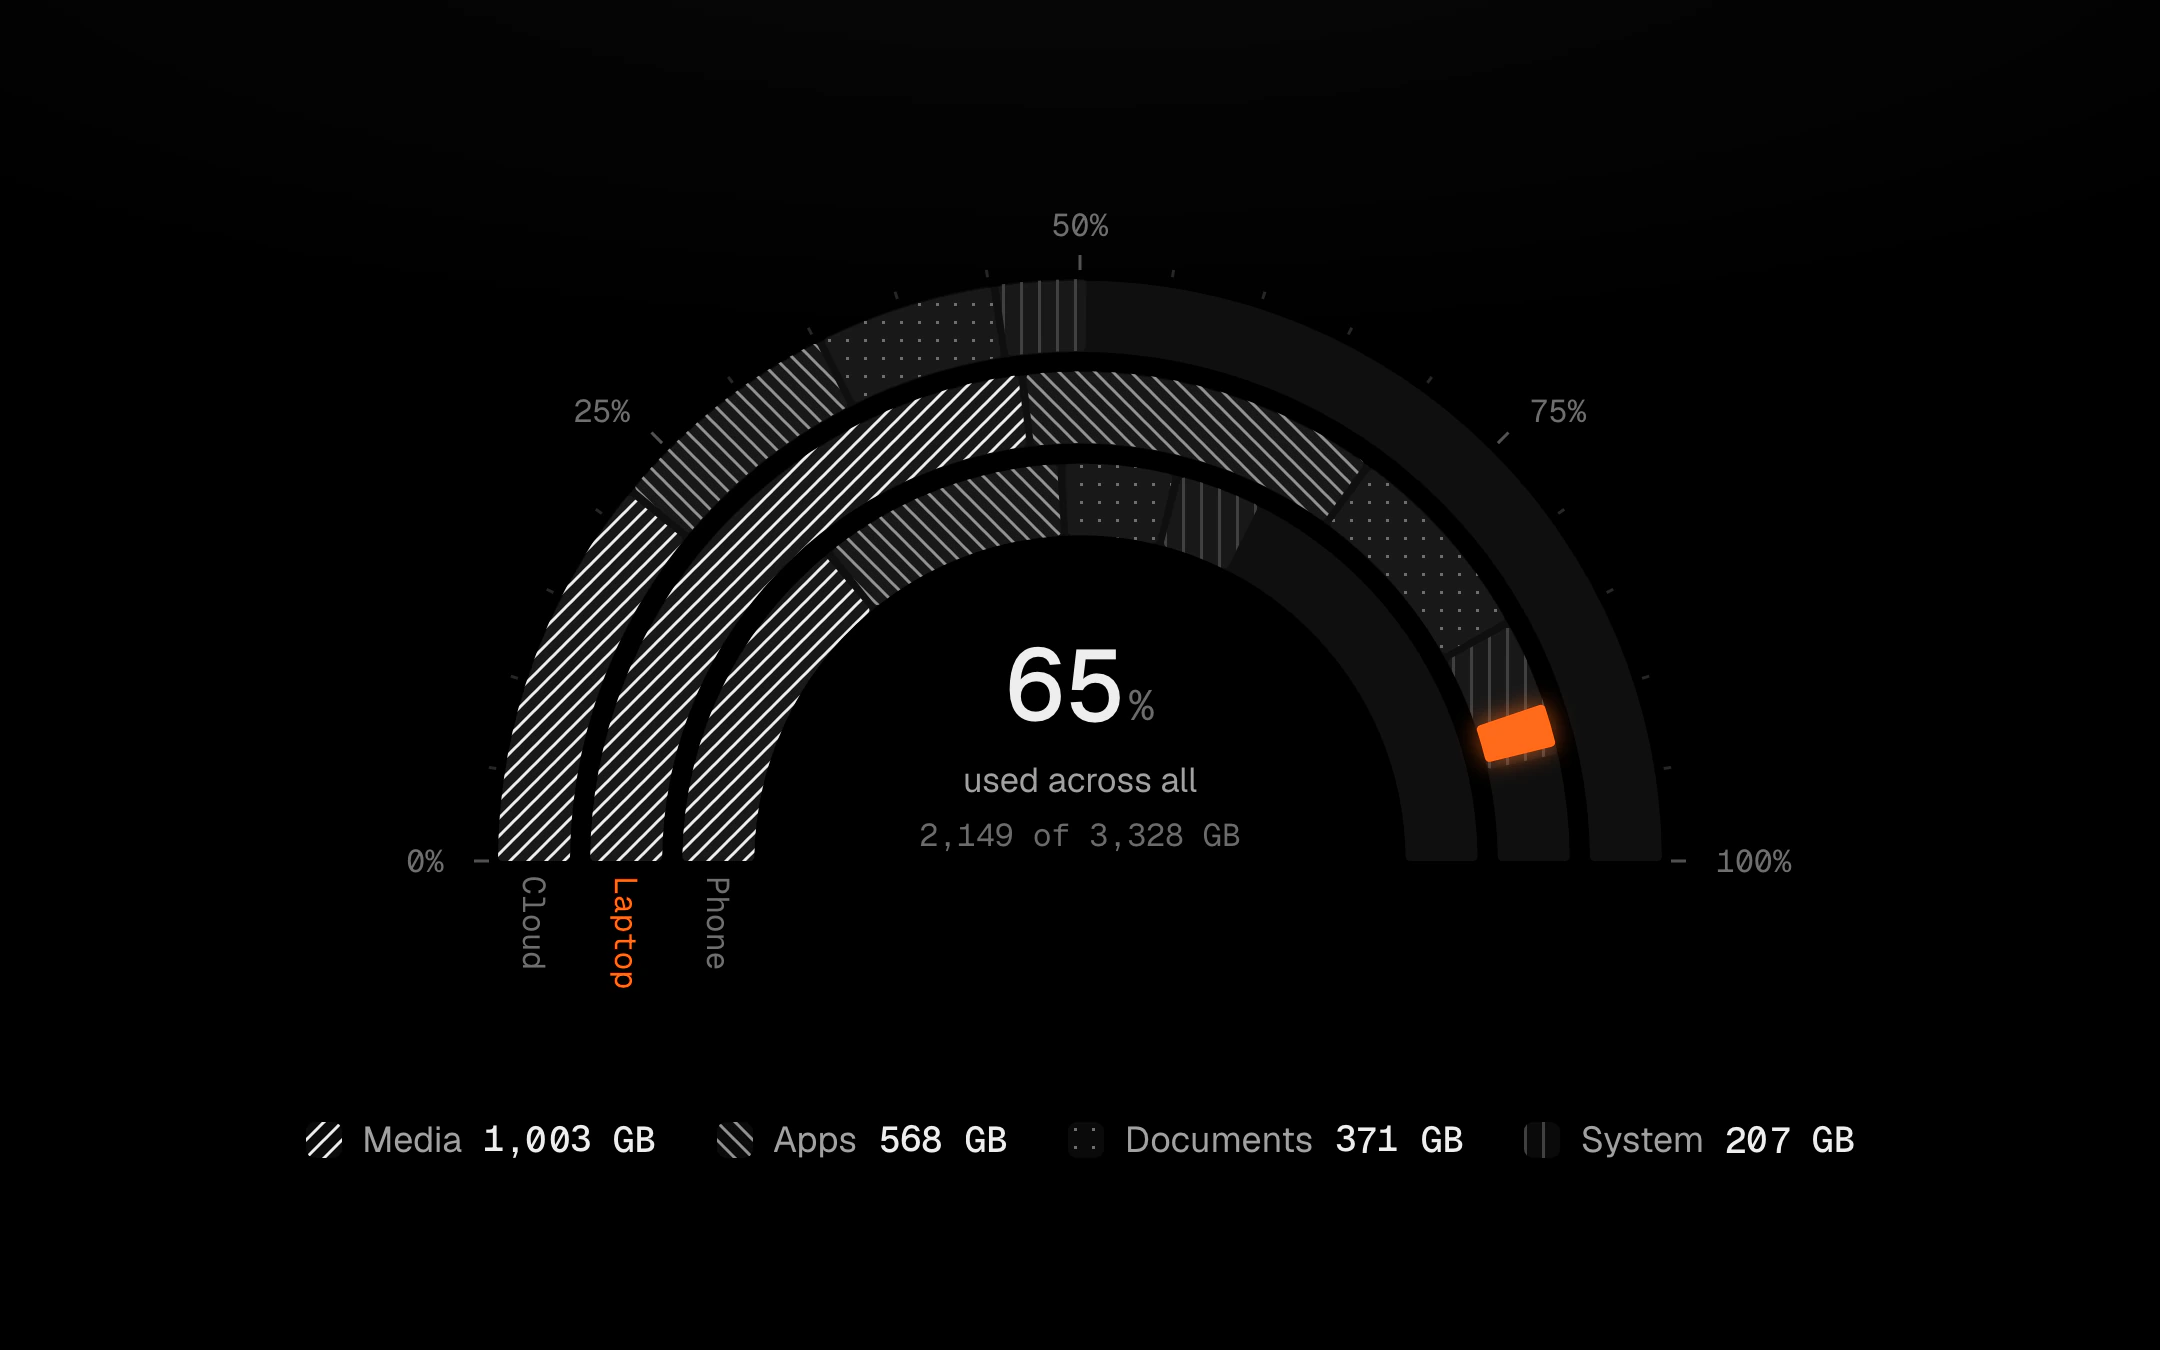
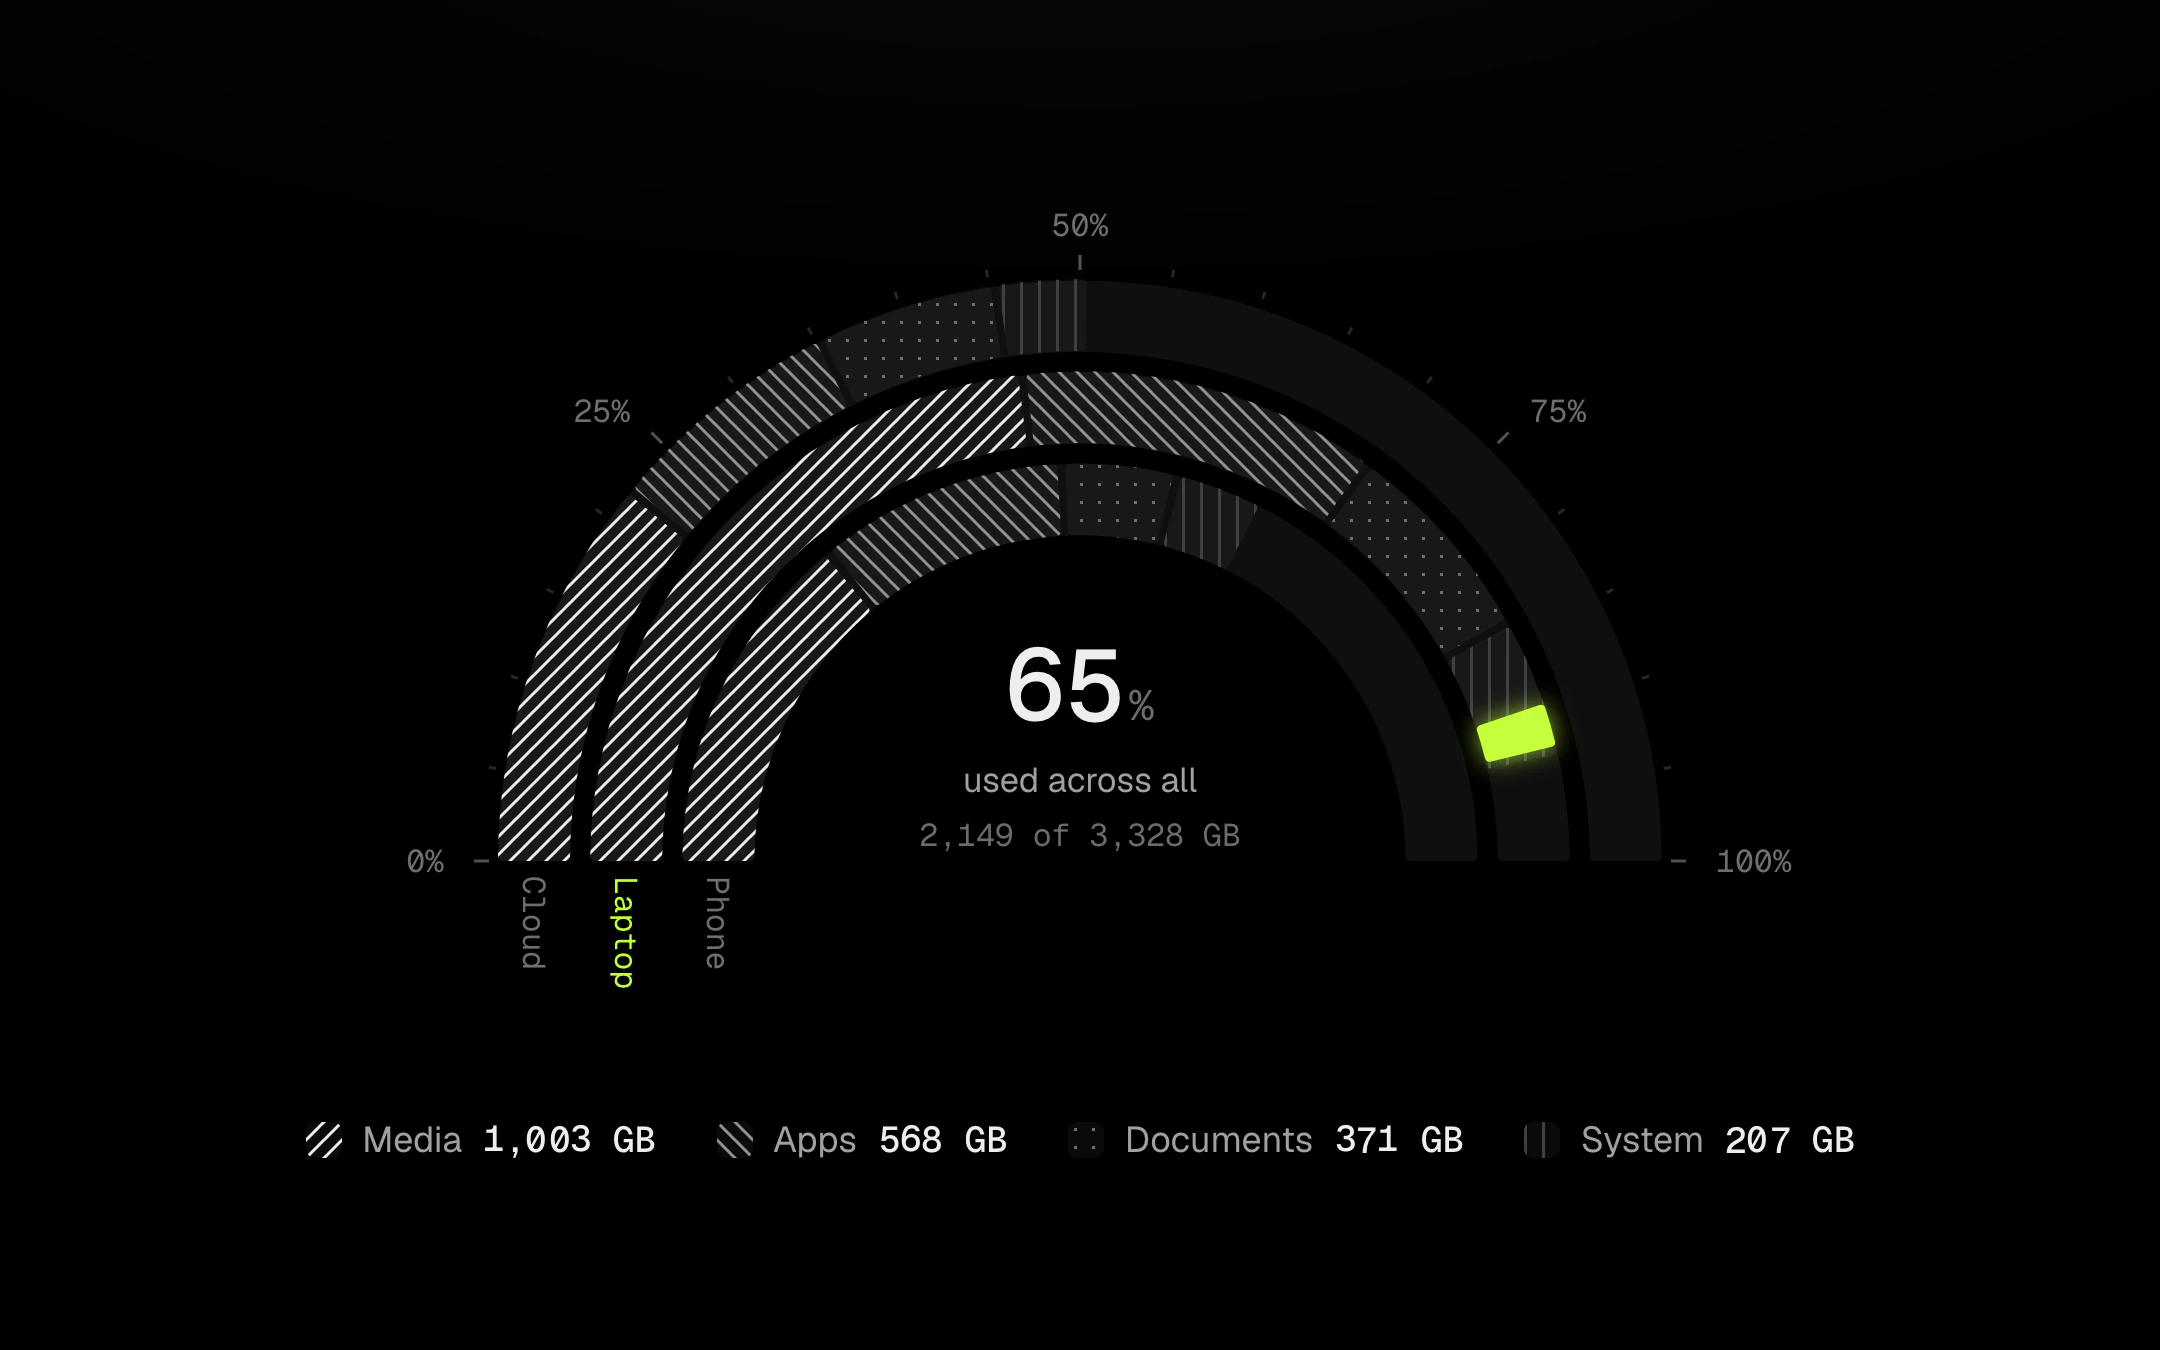
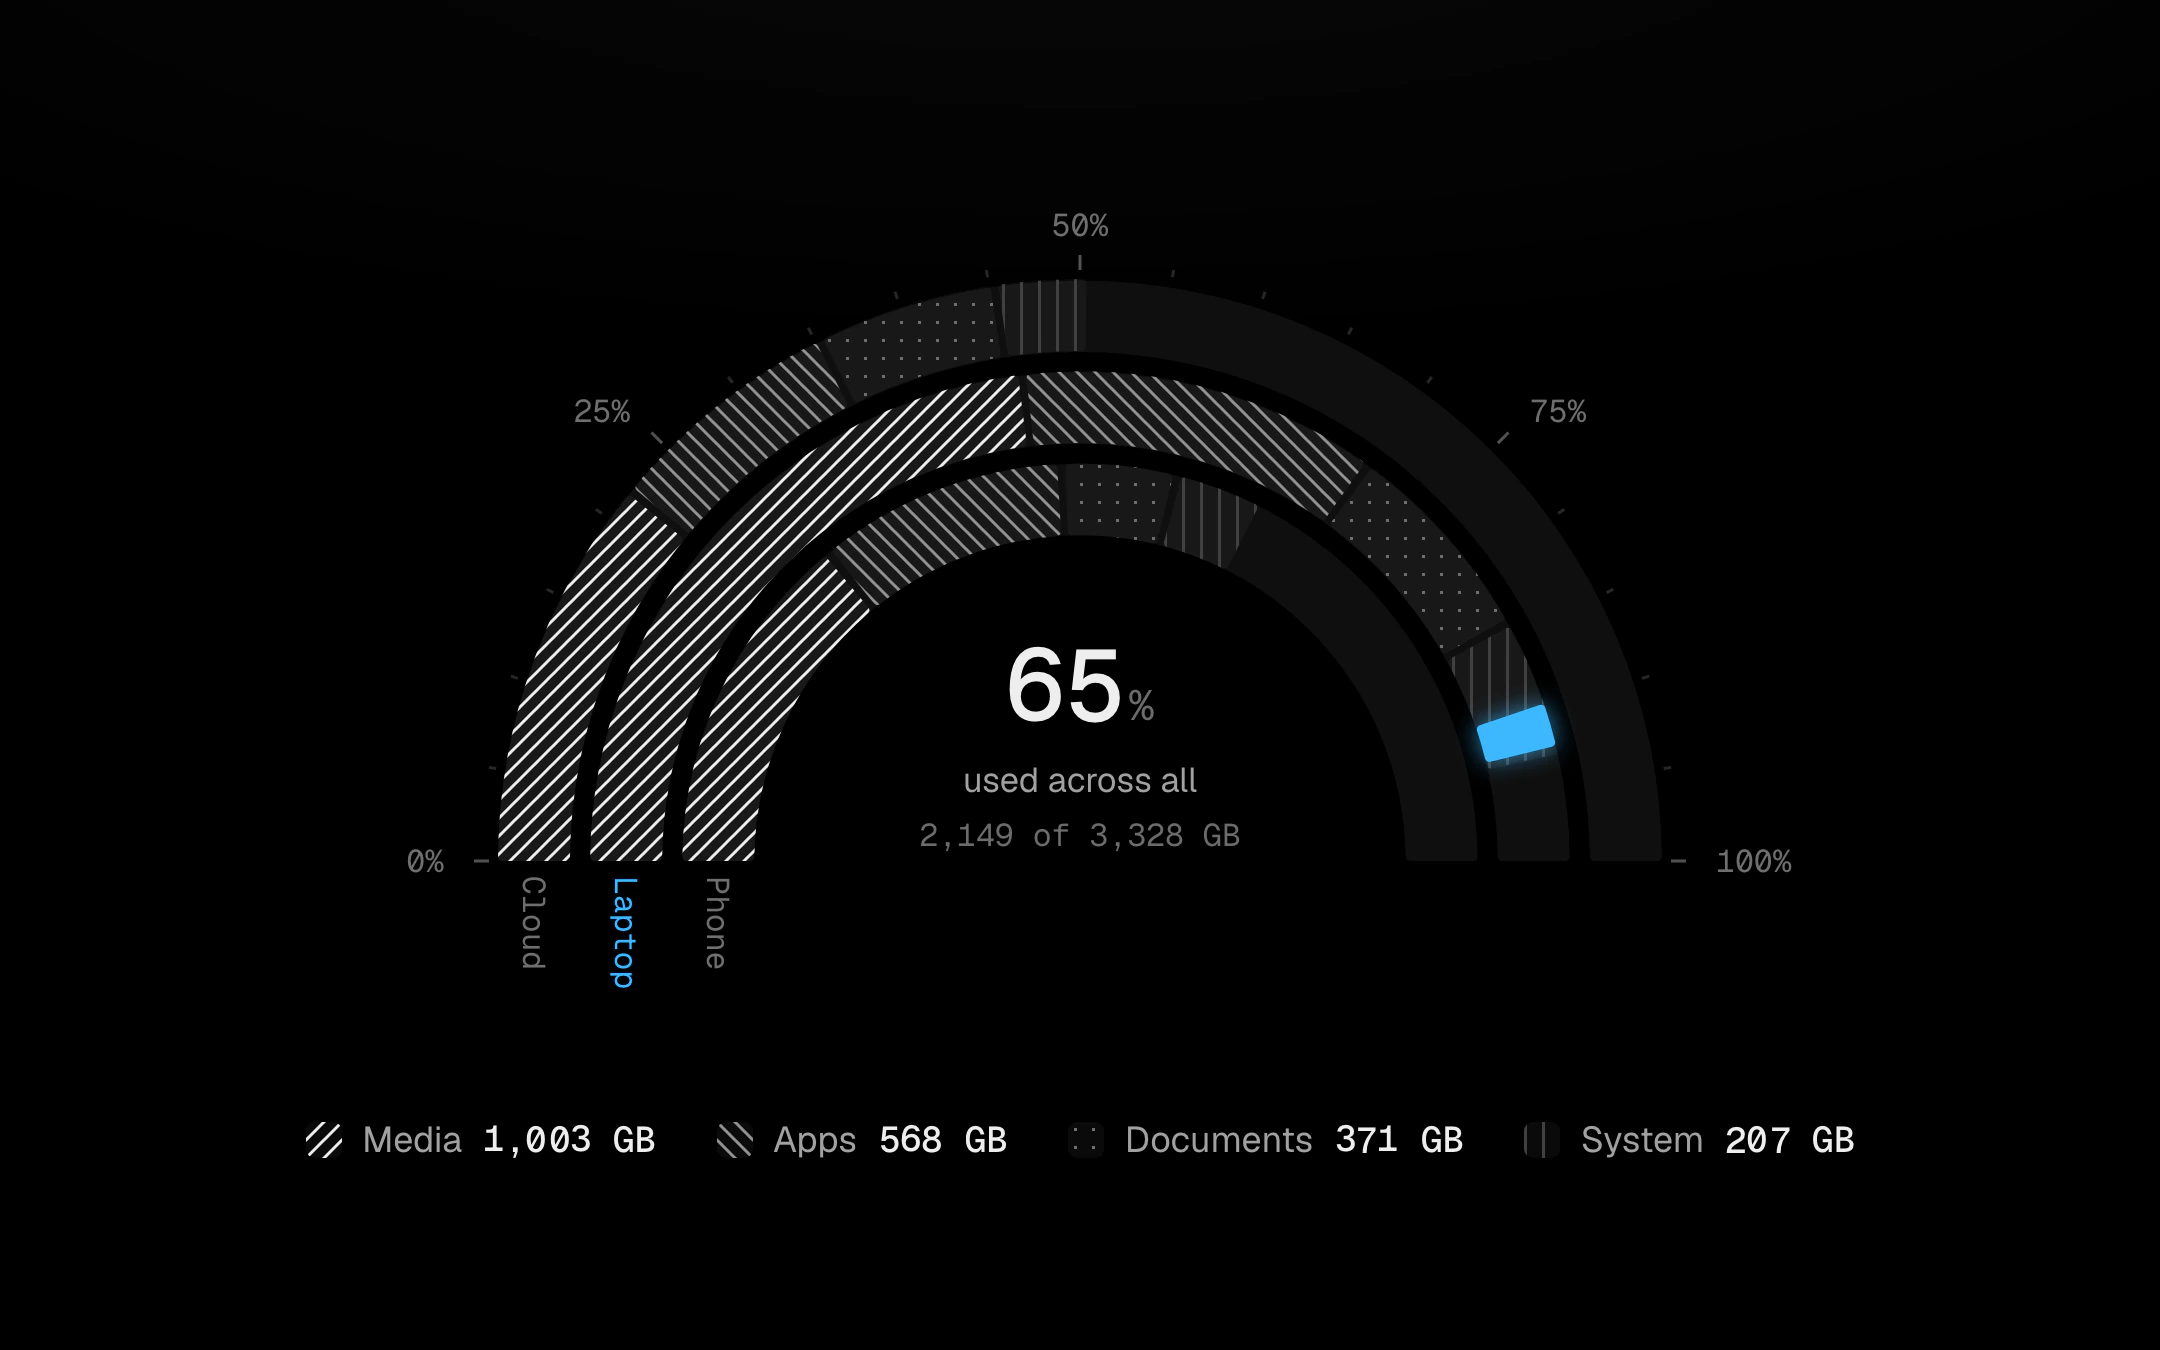
Concentric ring bars on a semicircle, a 270° horseshoe or a full circle: one ring per group, its parts stacked end to end along the arc over a faint track that stands for what is left, with percent ticks along the outside.
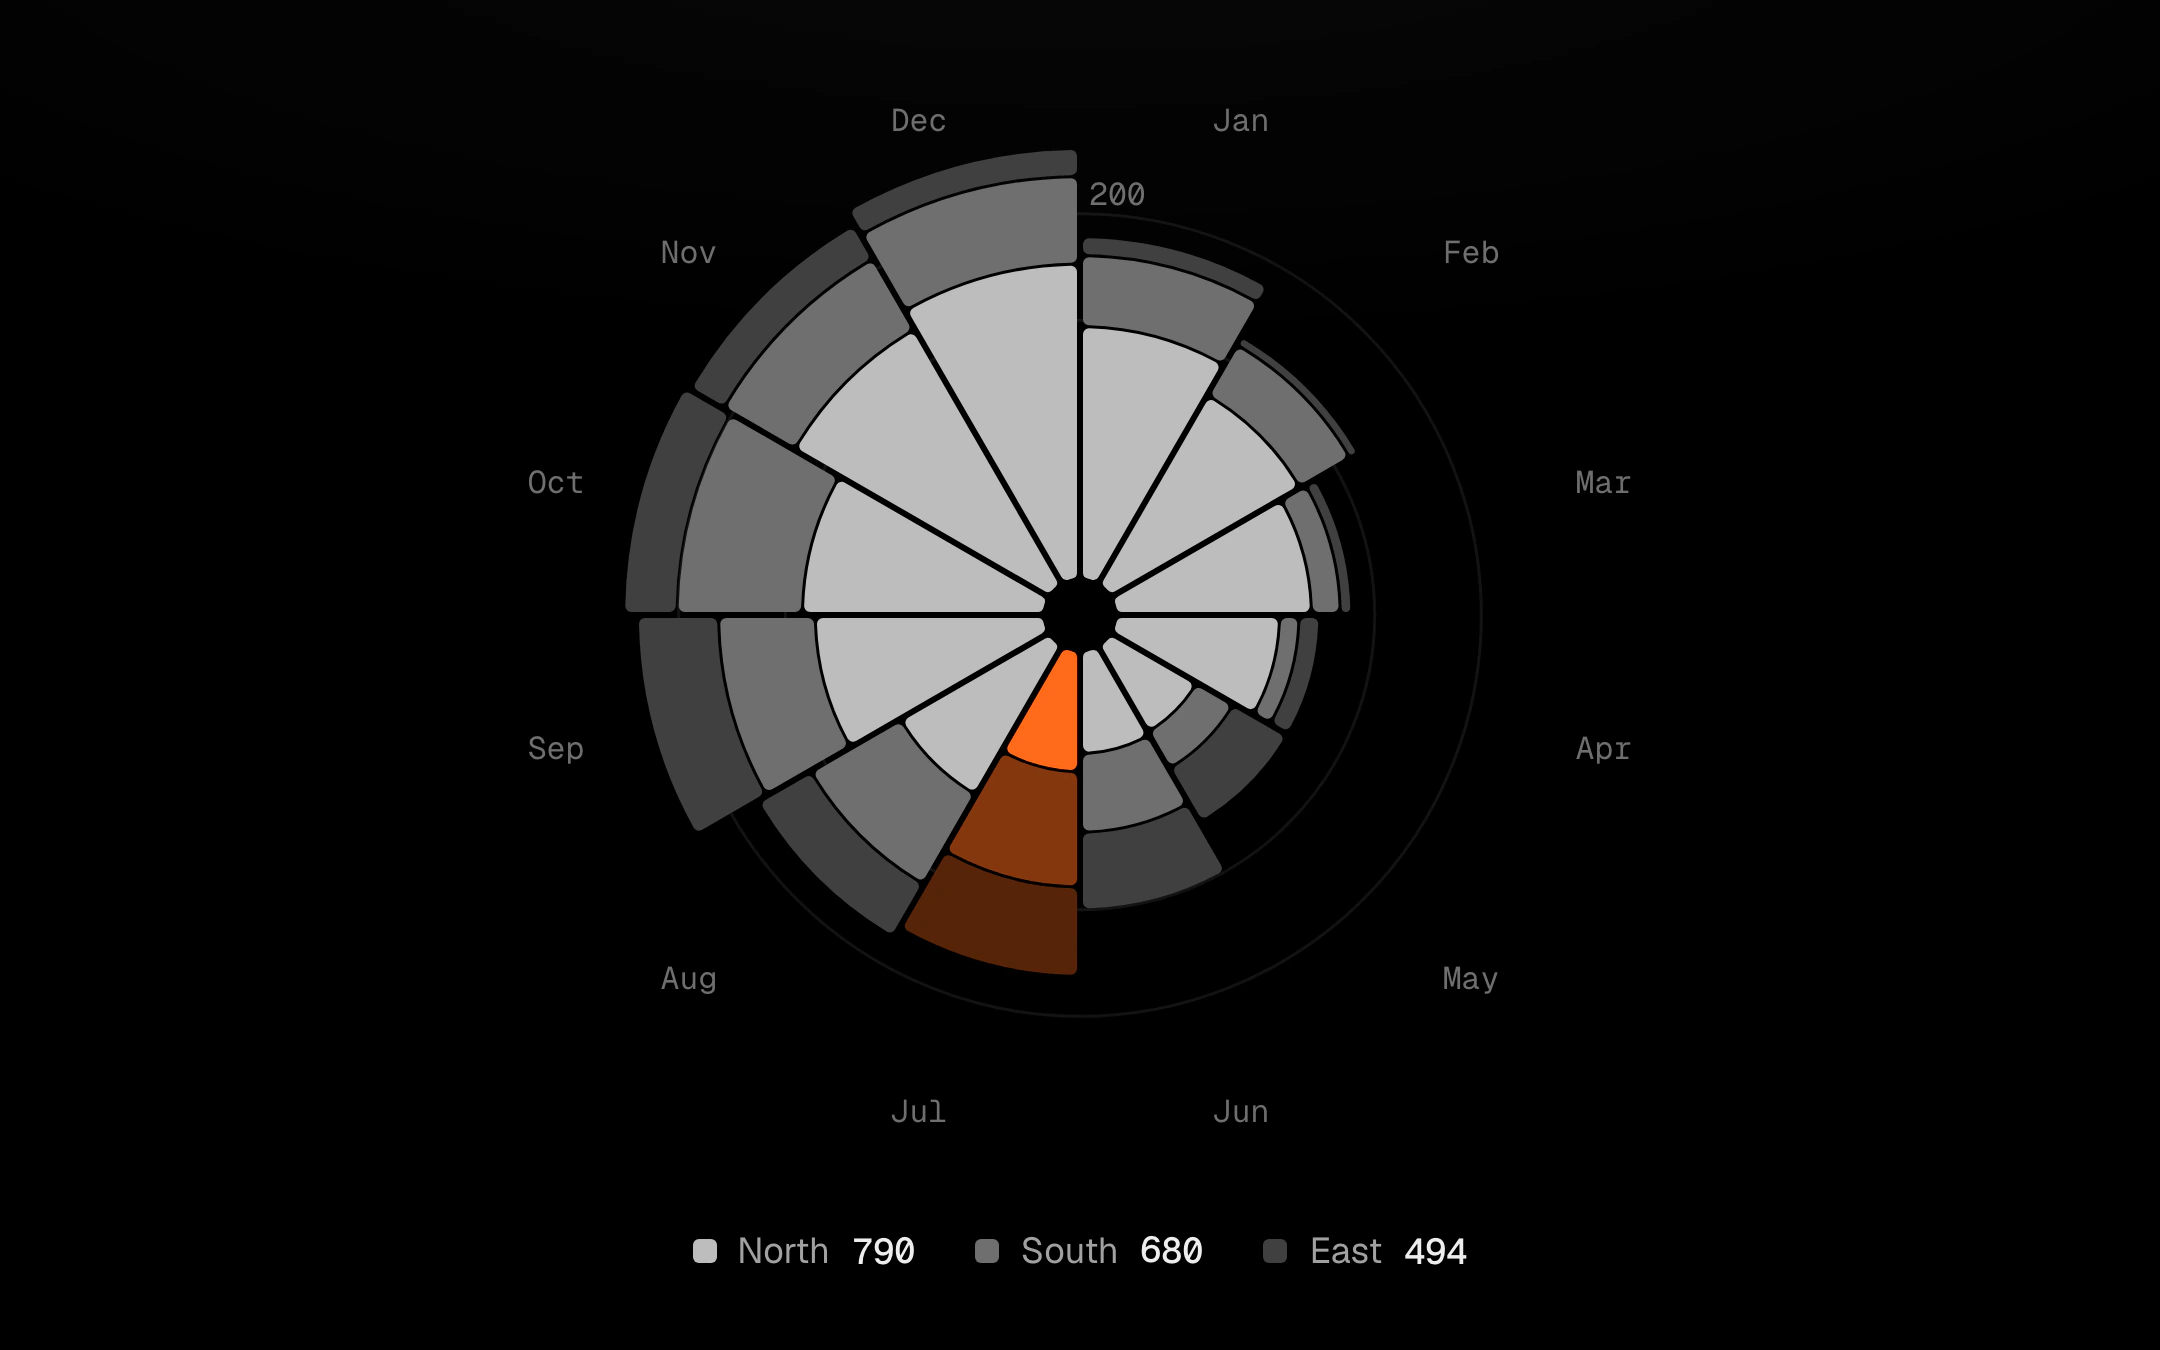
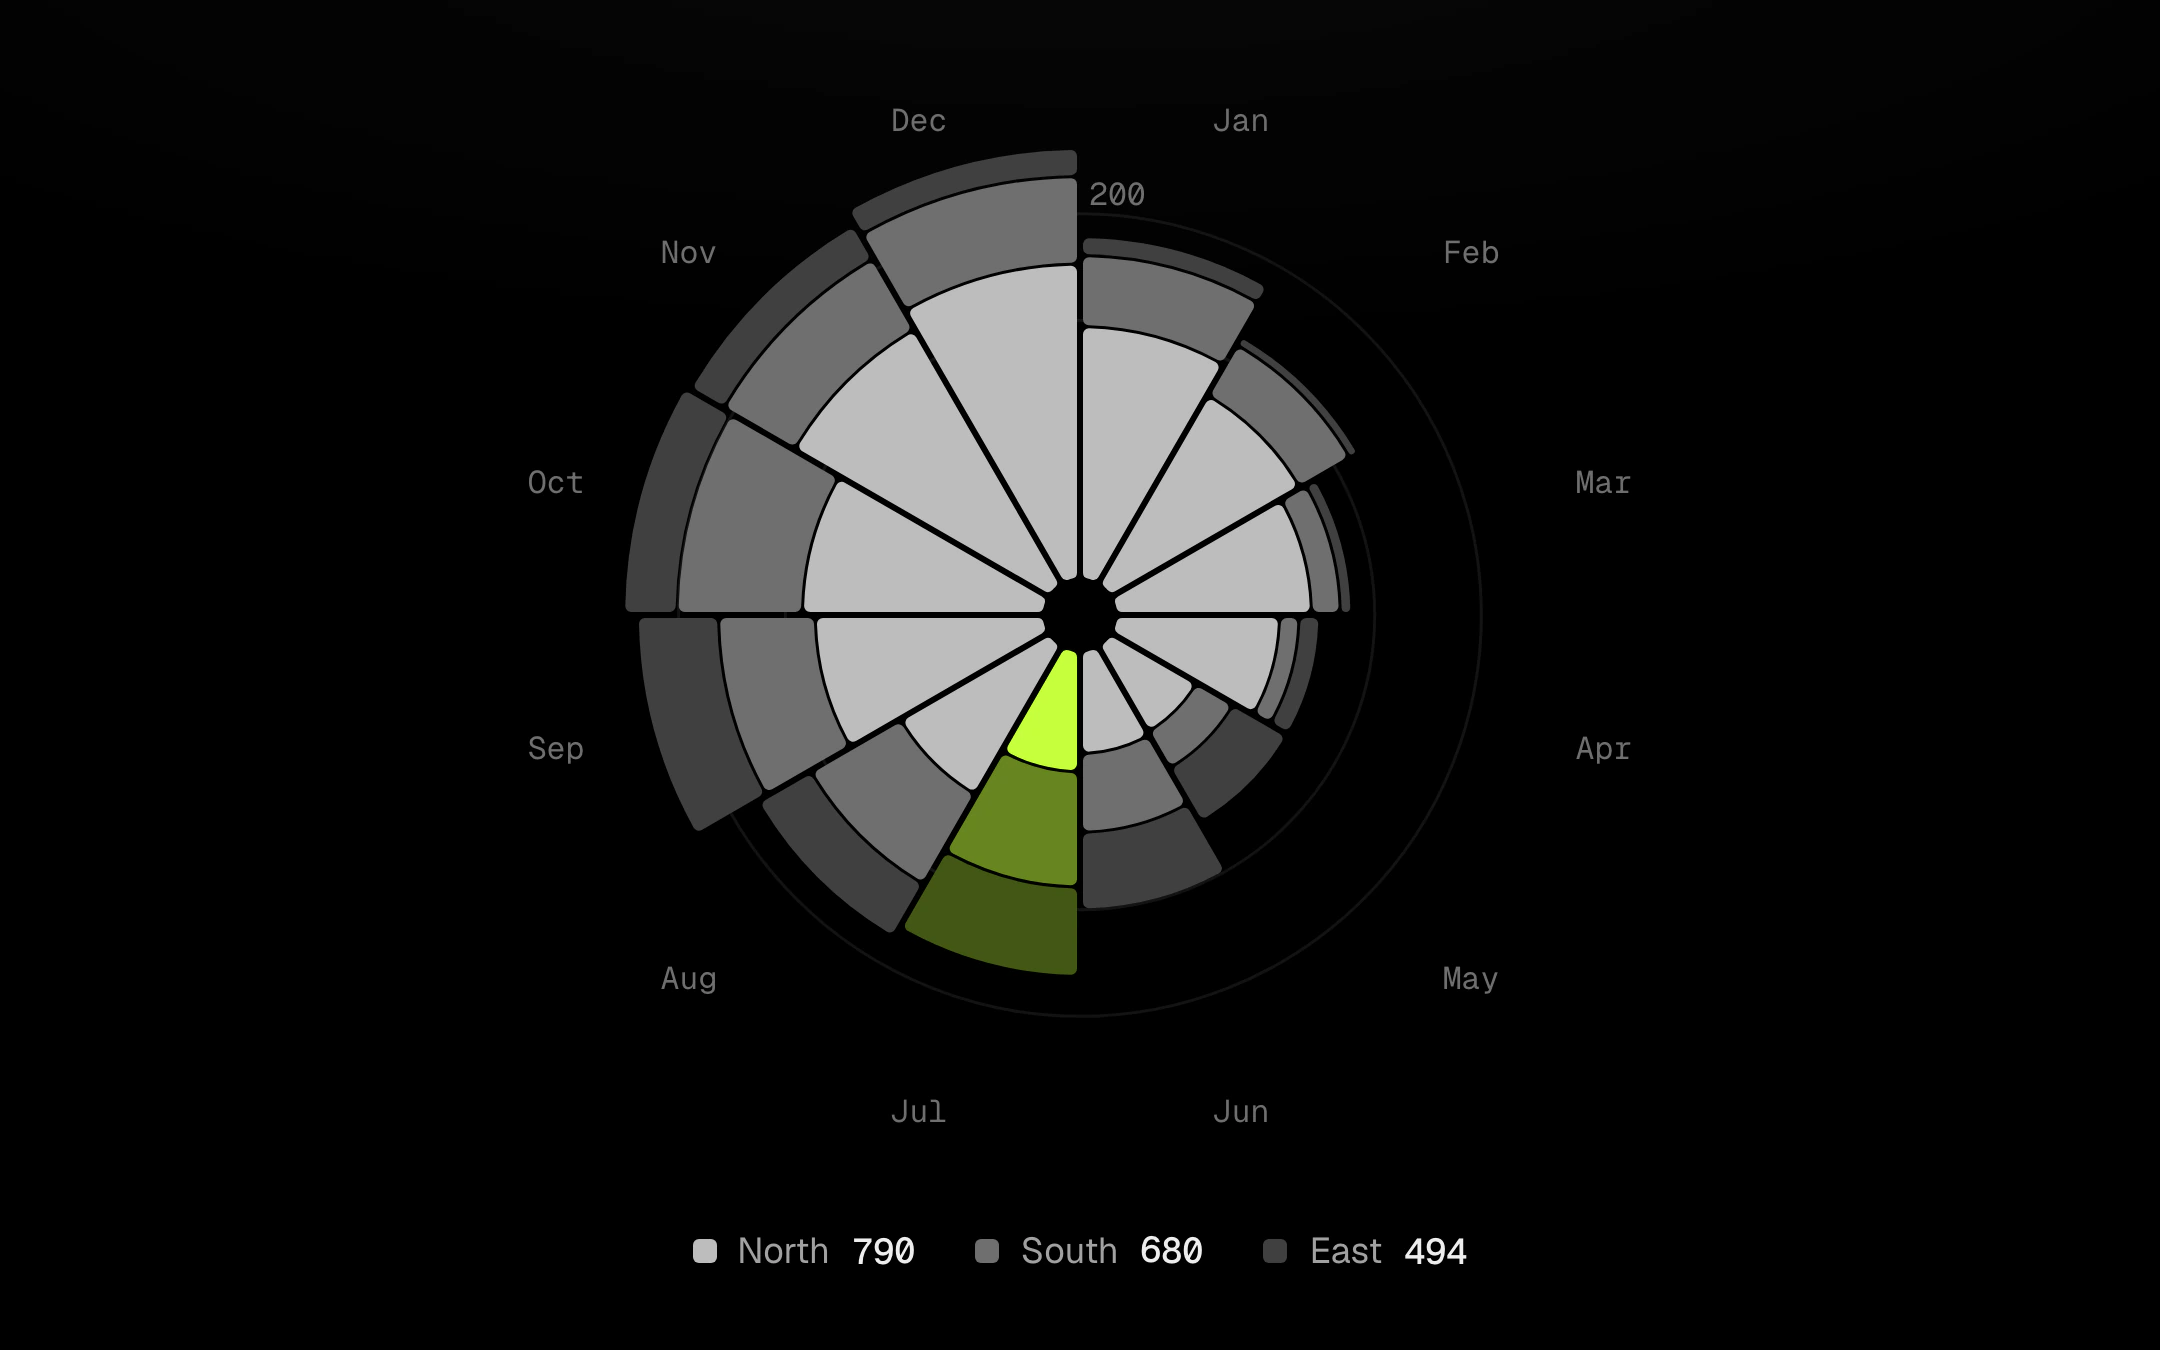
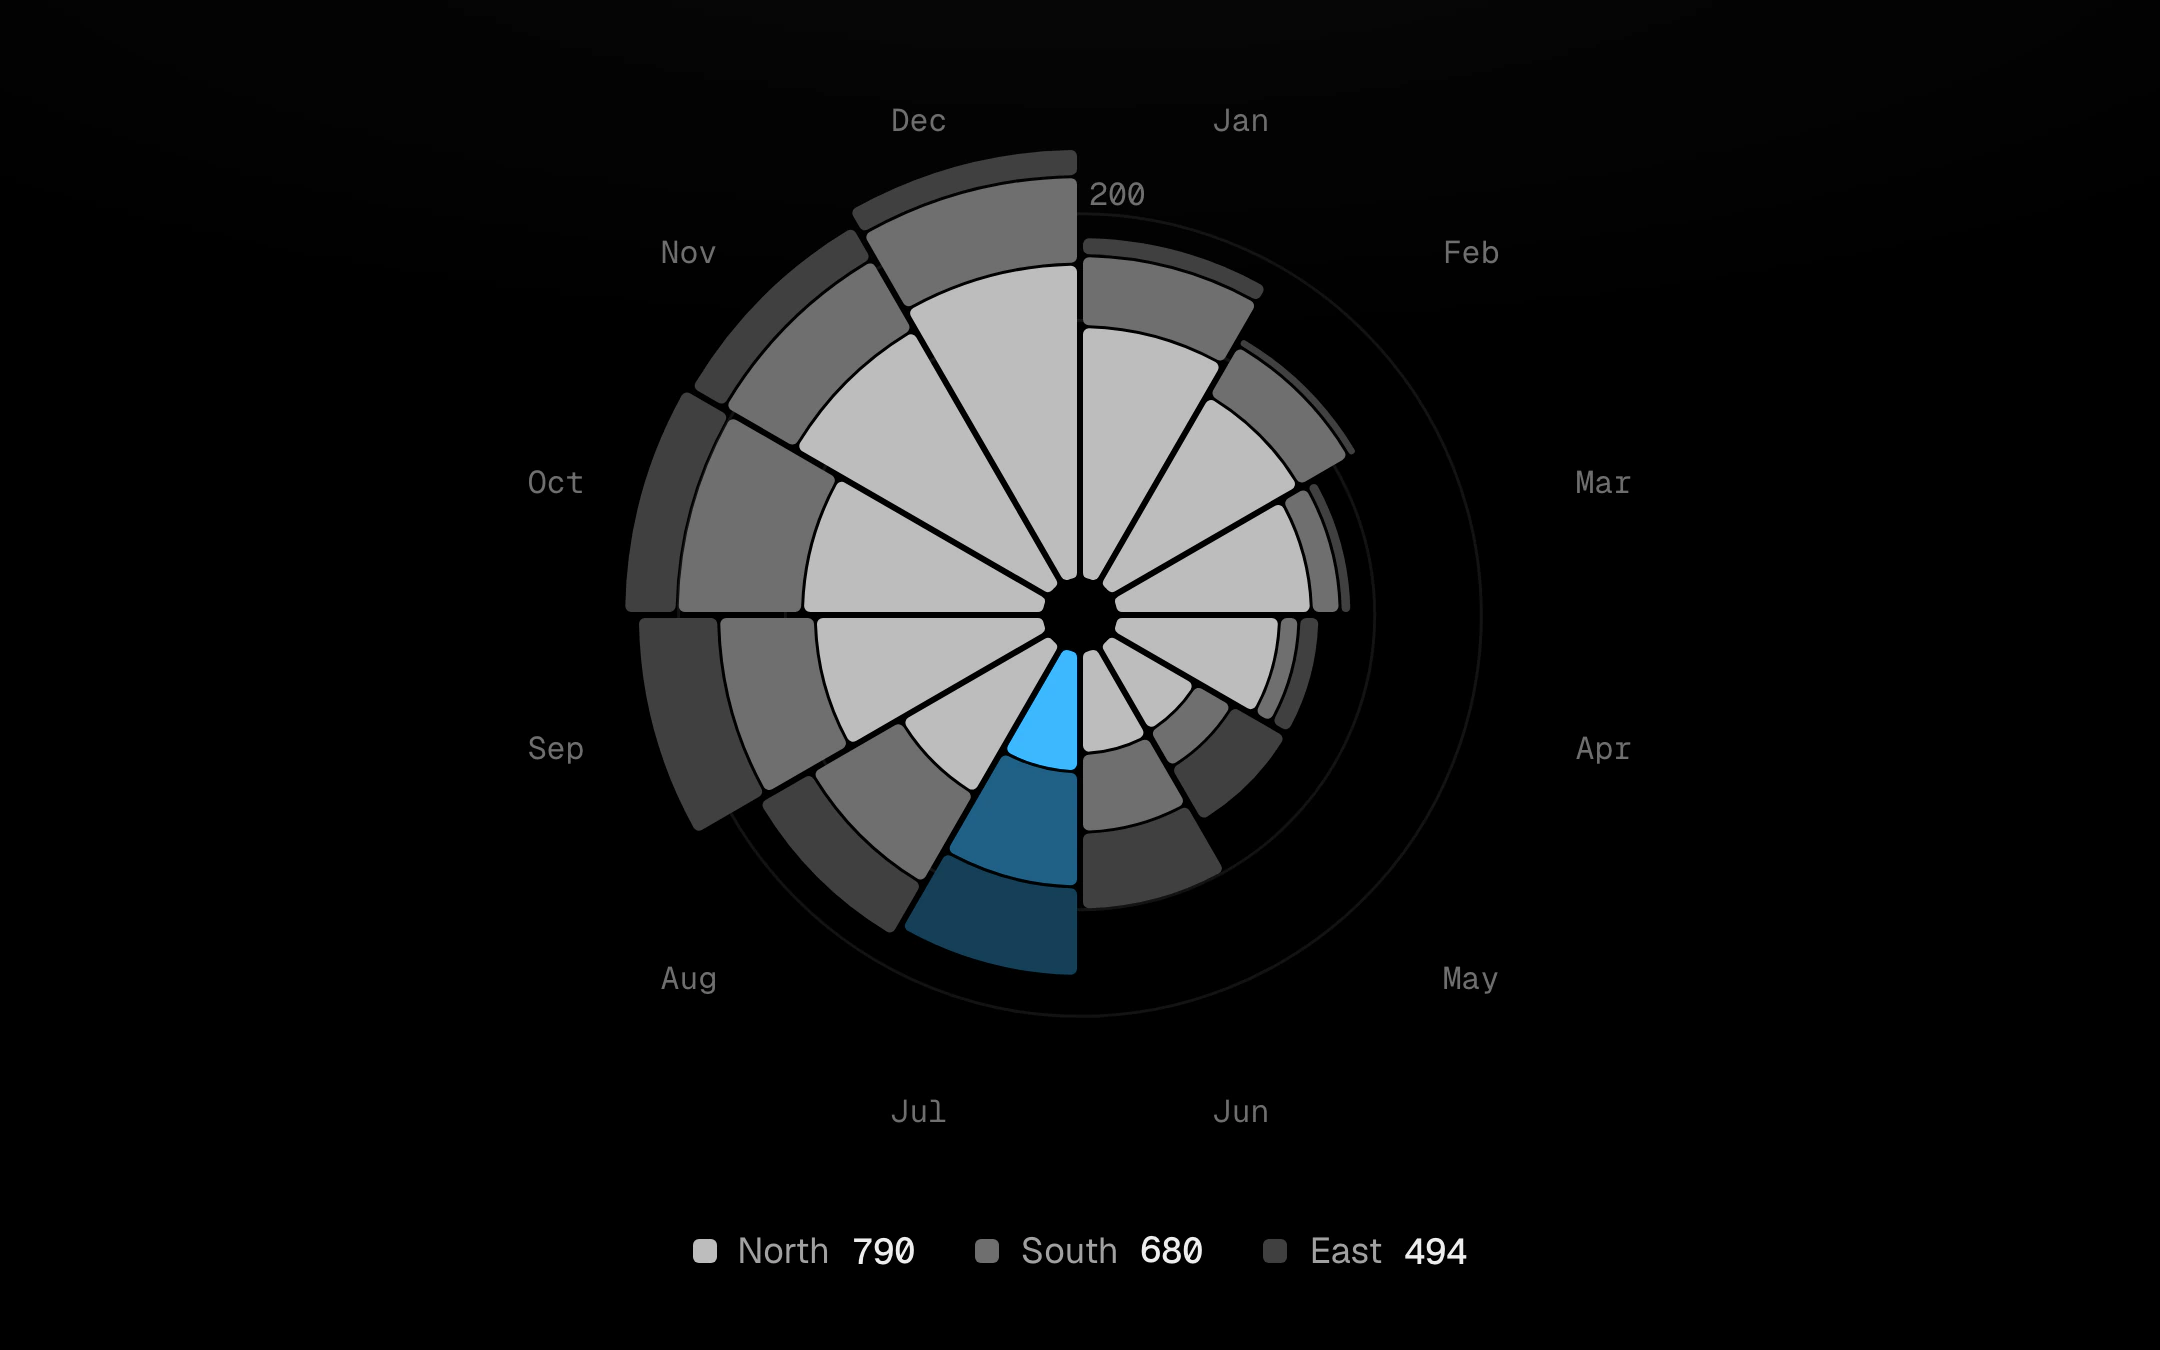
A polar area chart in the Nightingale manner: one wedge per category, stacked by series, its radius on a square-root scale so the area tells the truth, cut apart by a constant-width gap.
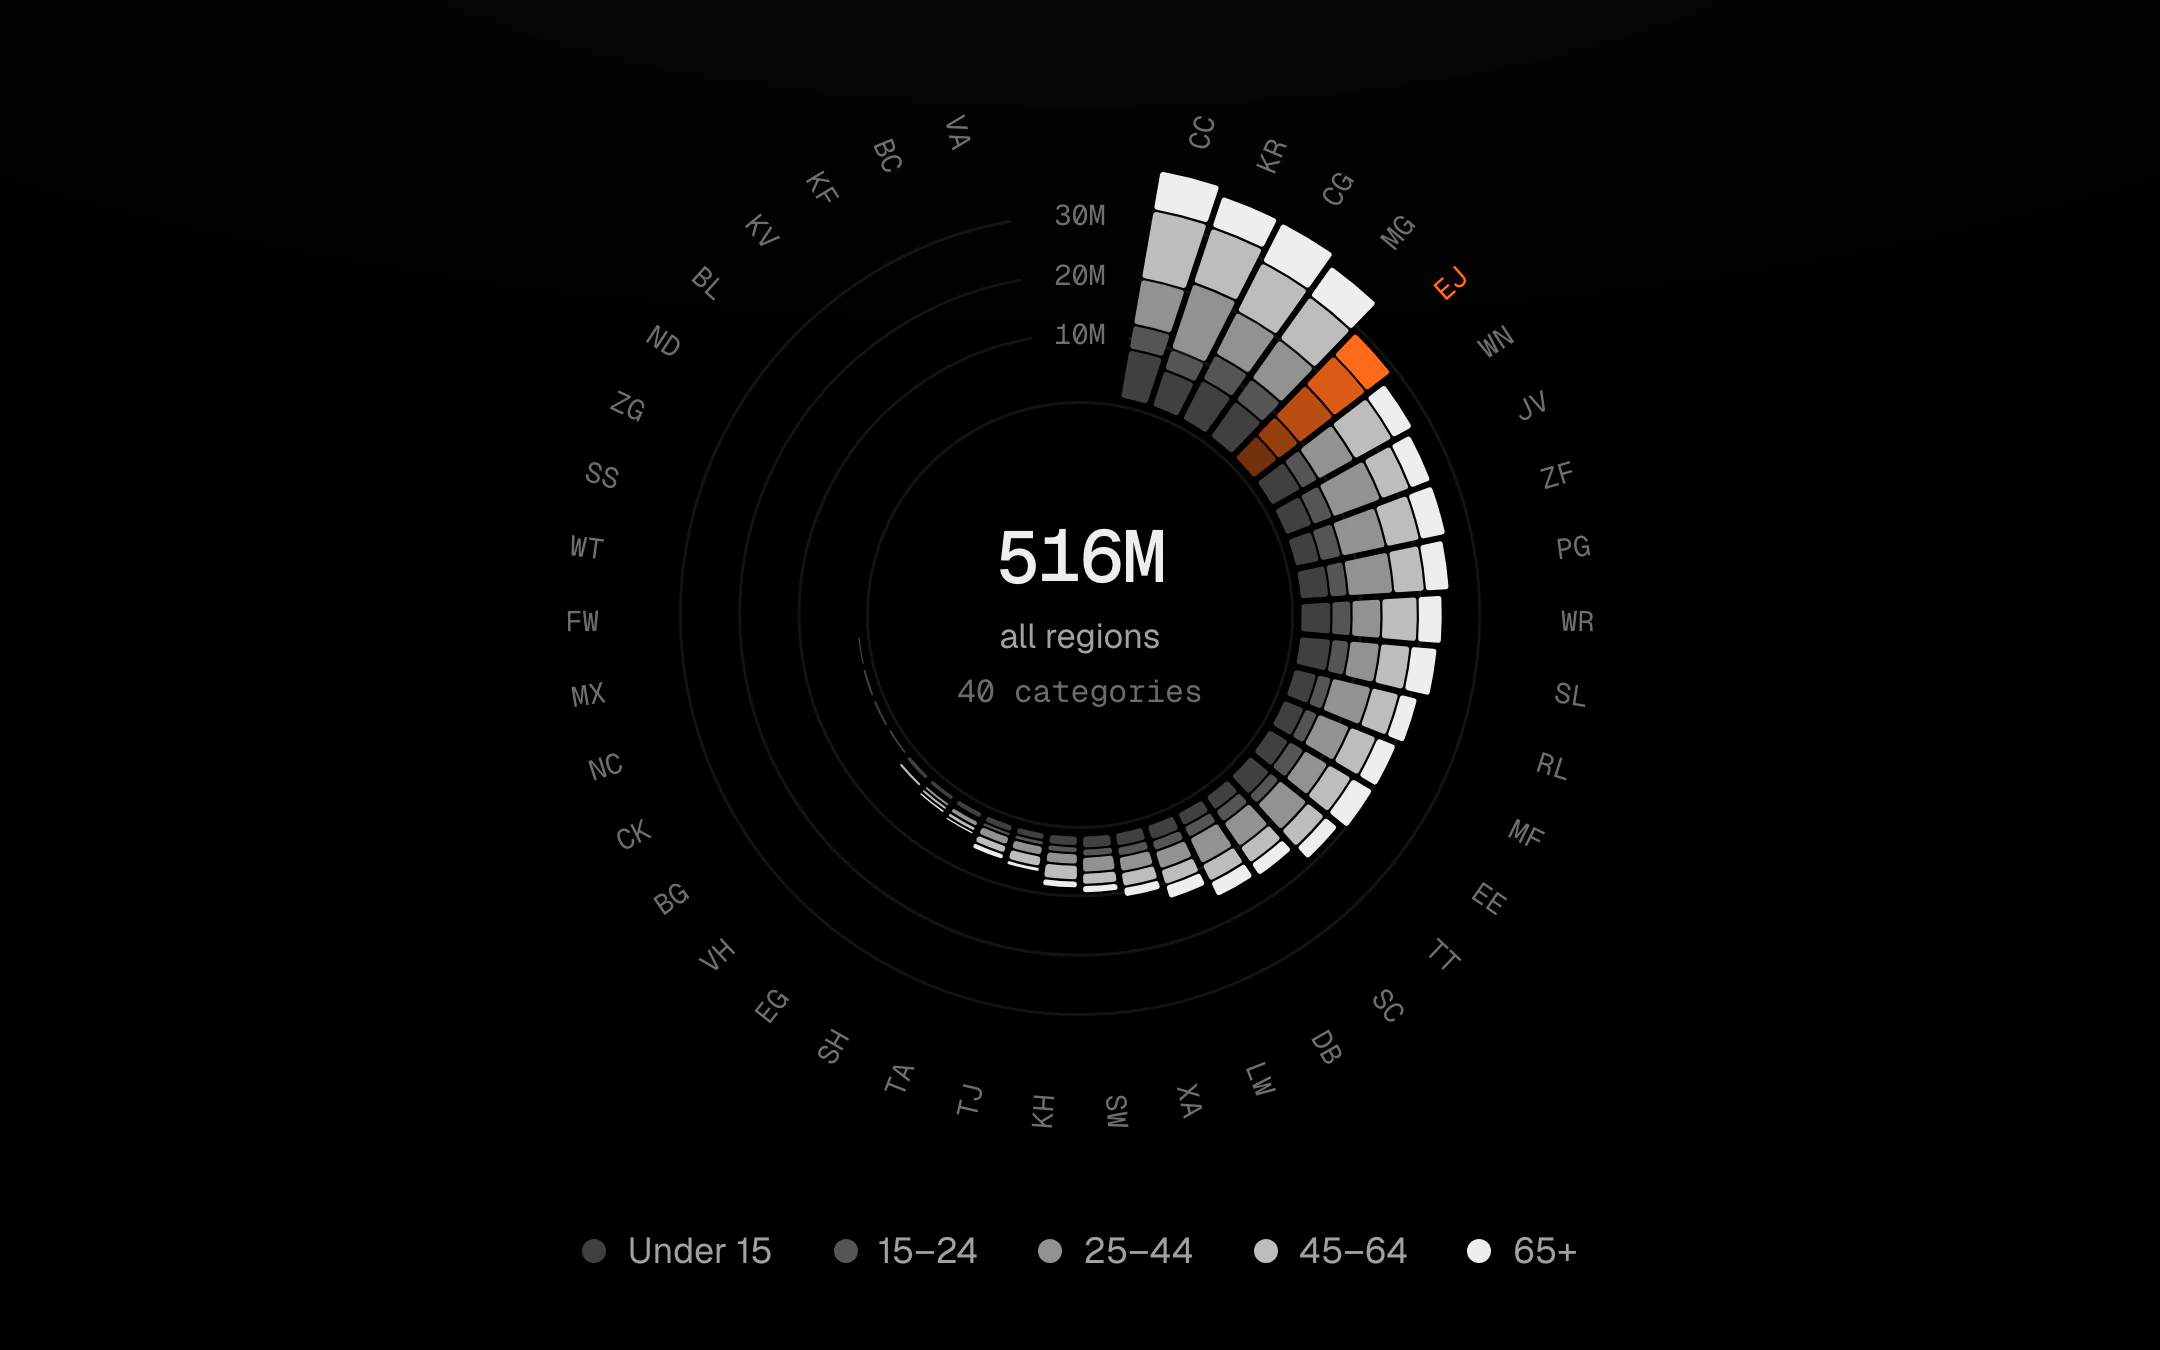
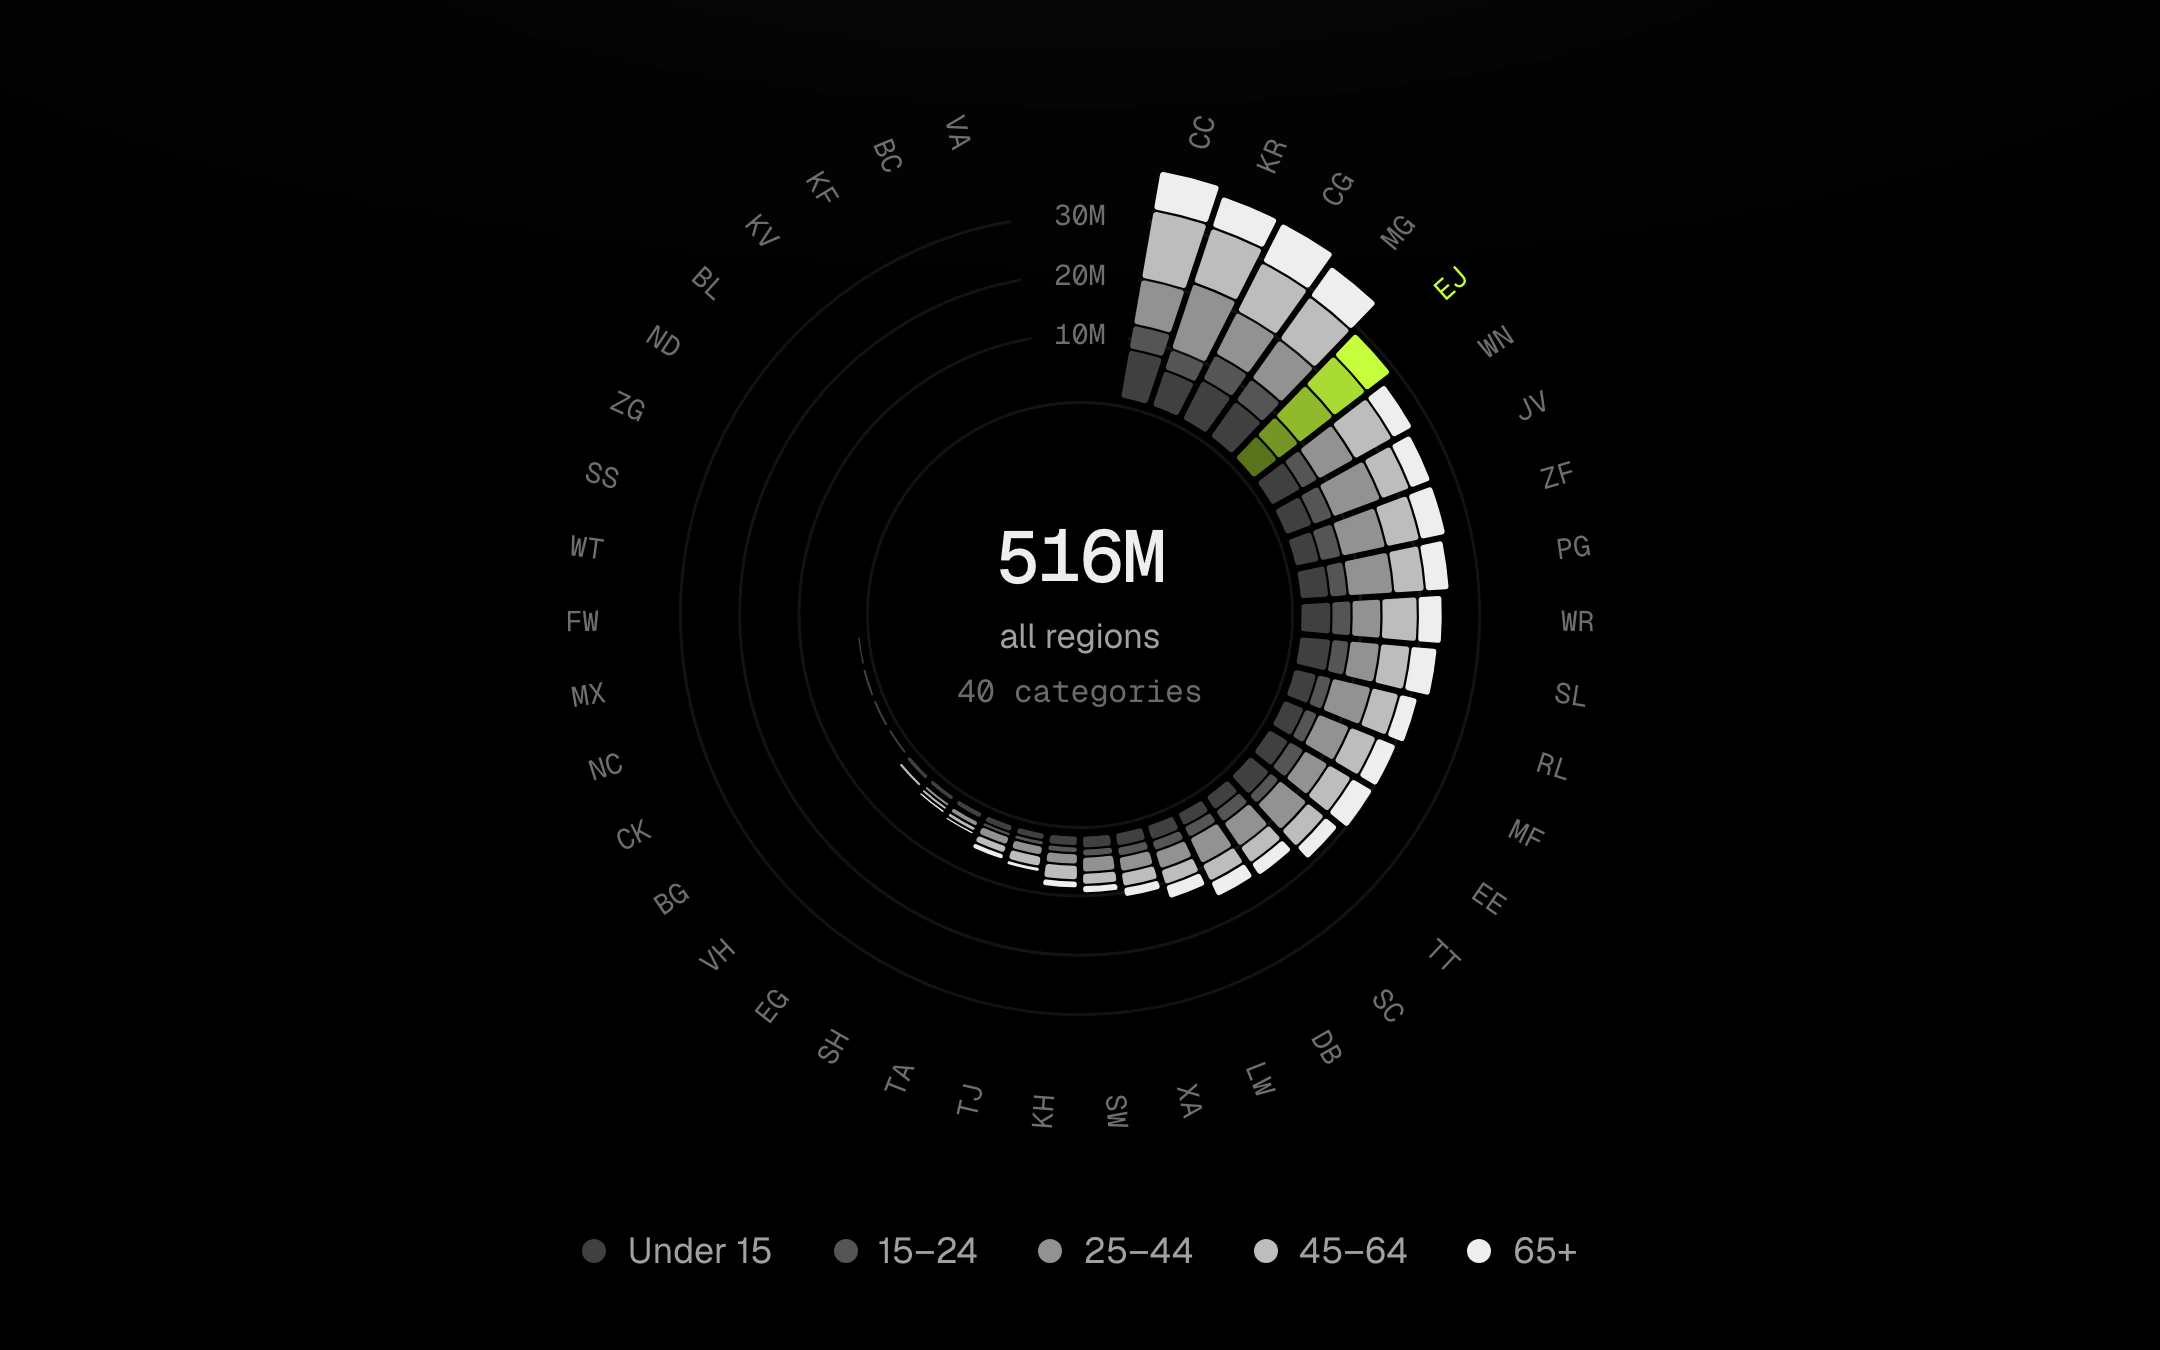
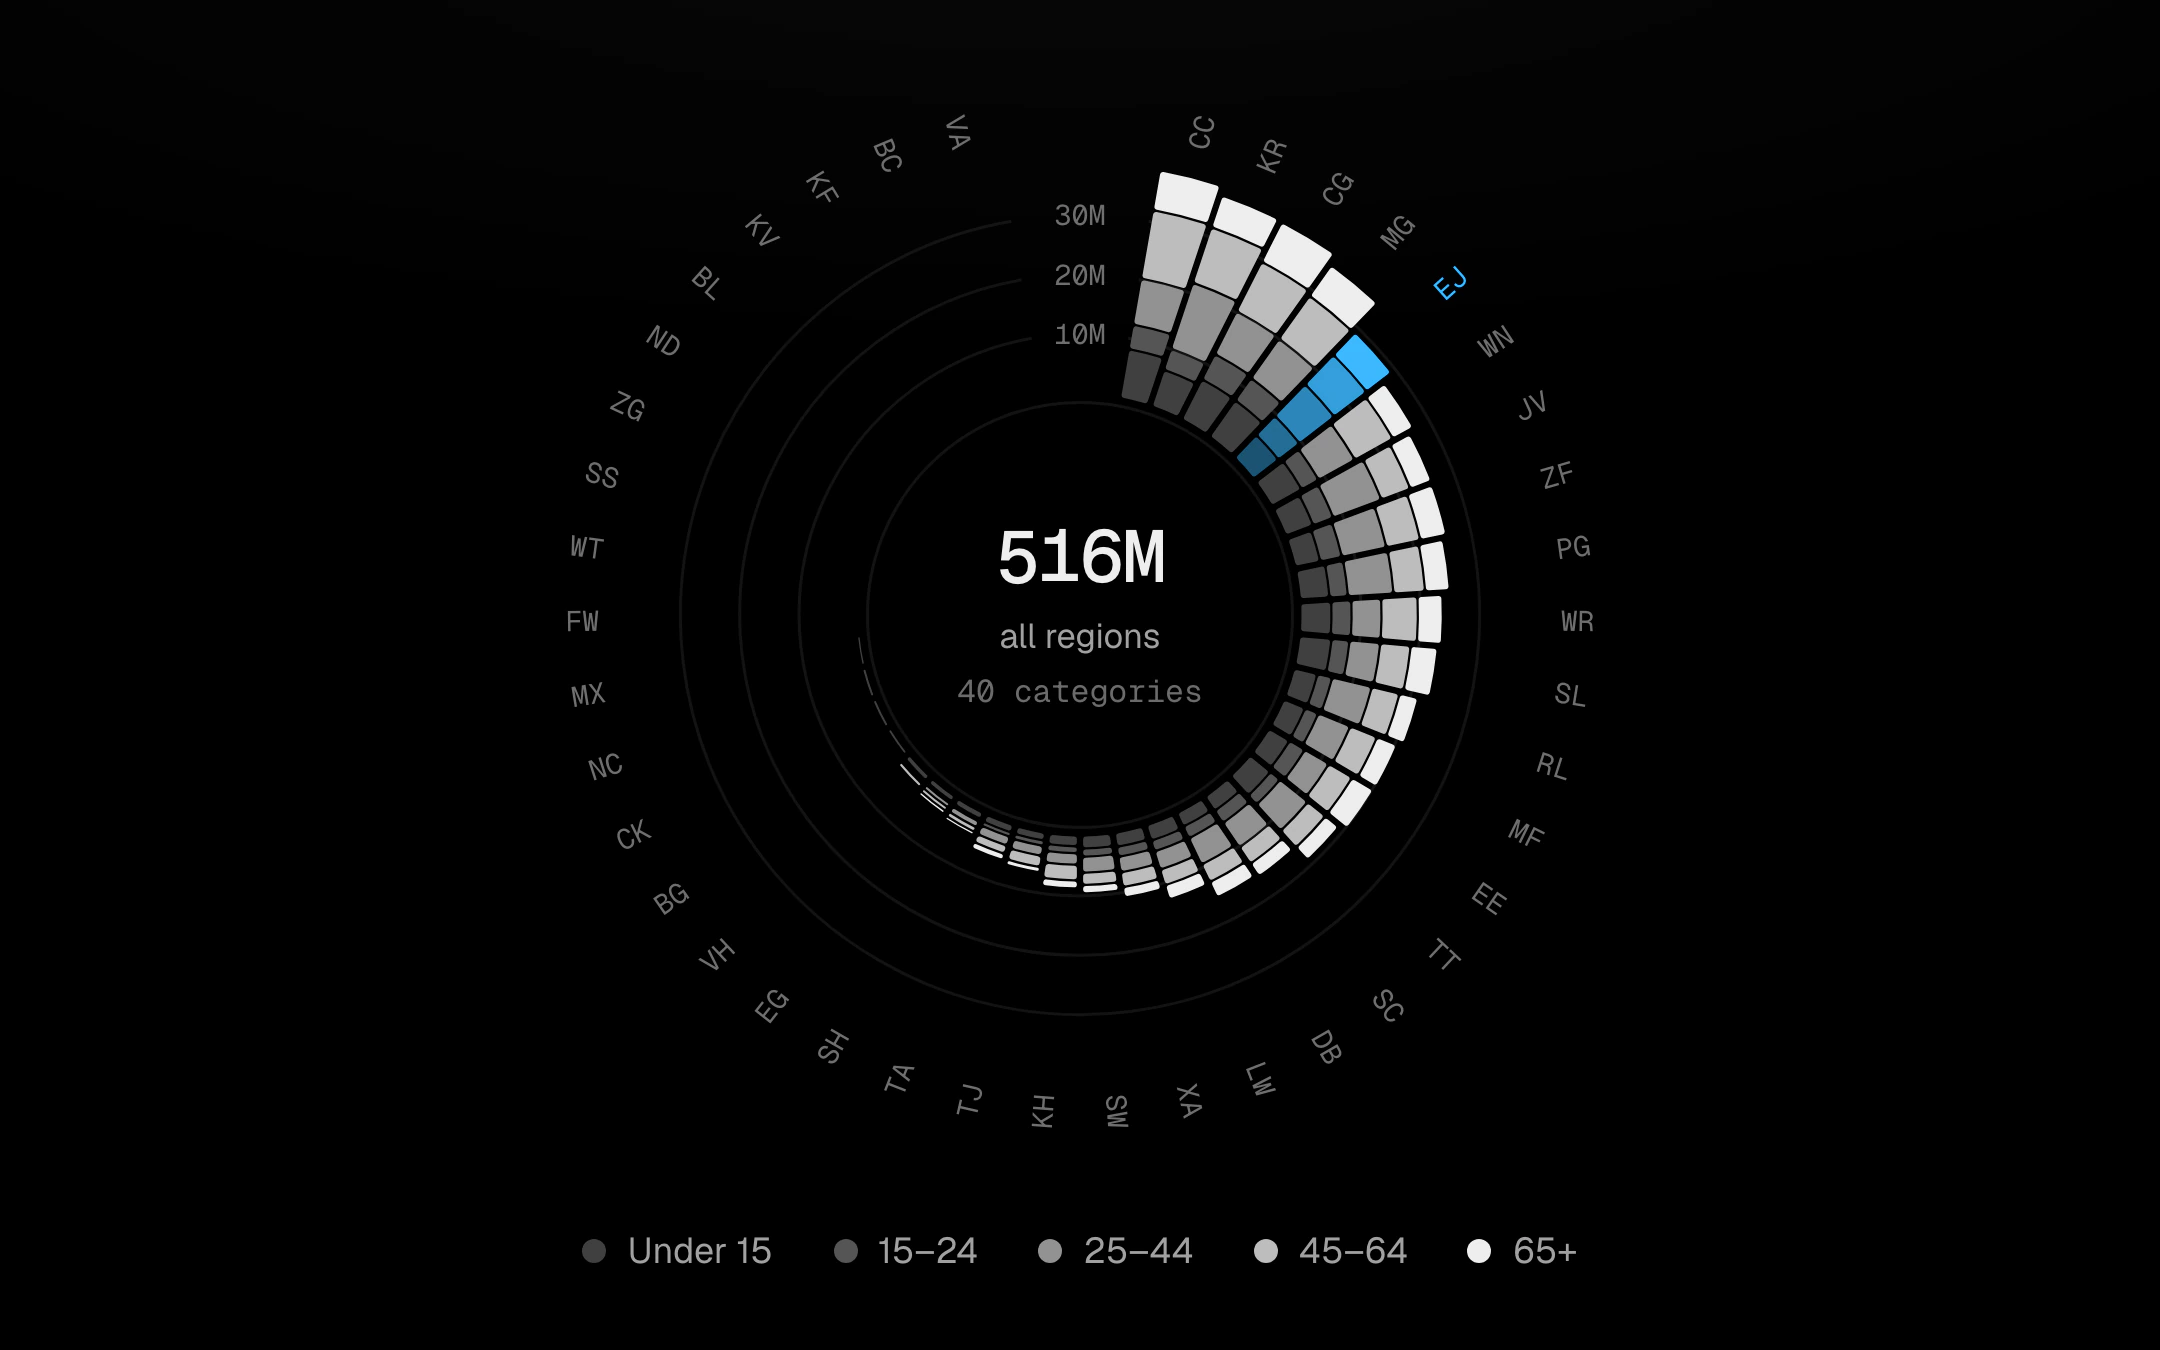
Stacked bars standing out from a ring, one per category, sorted by total so the dial reads as a spiral from the largest at 12 o’clock round to the smallest.
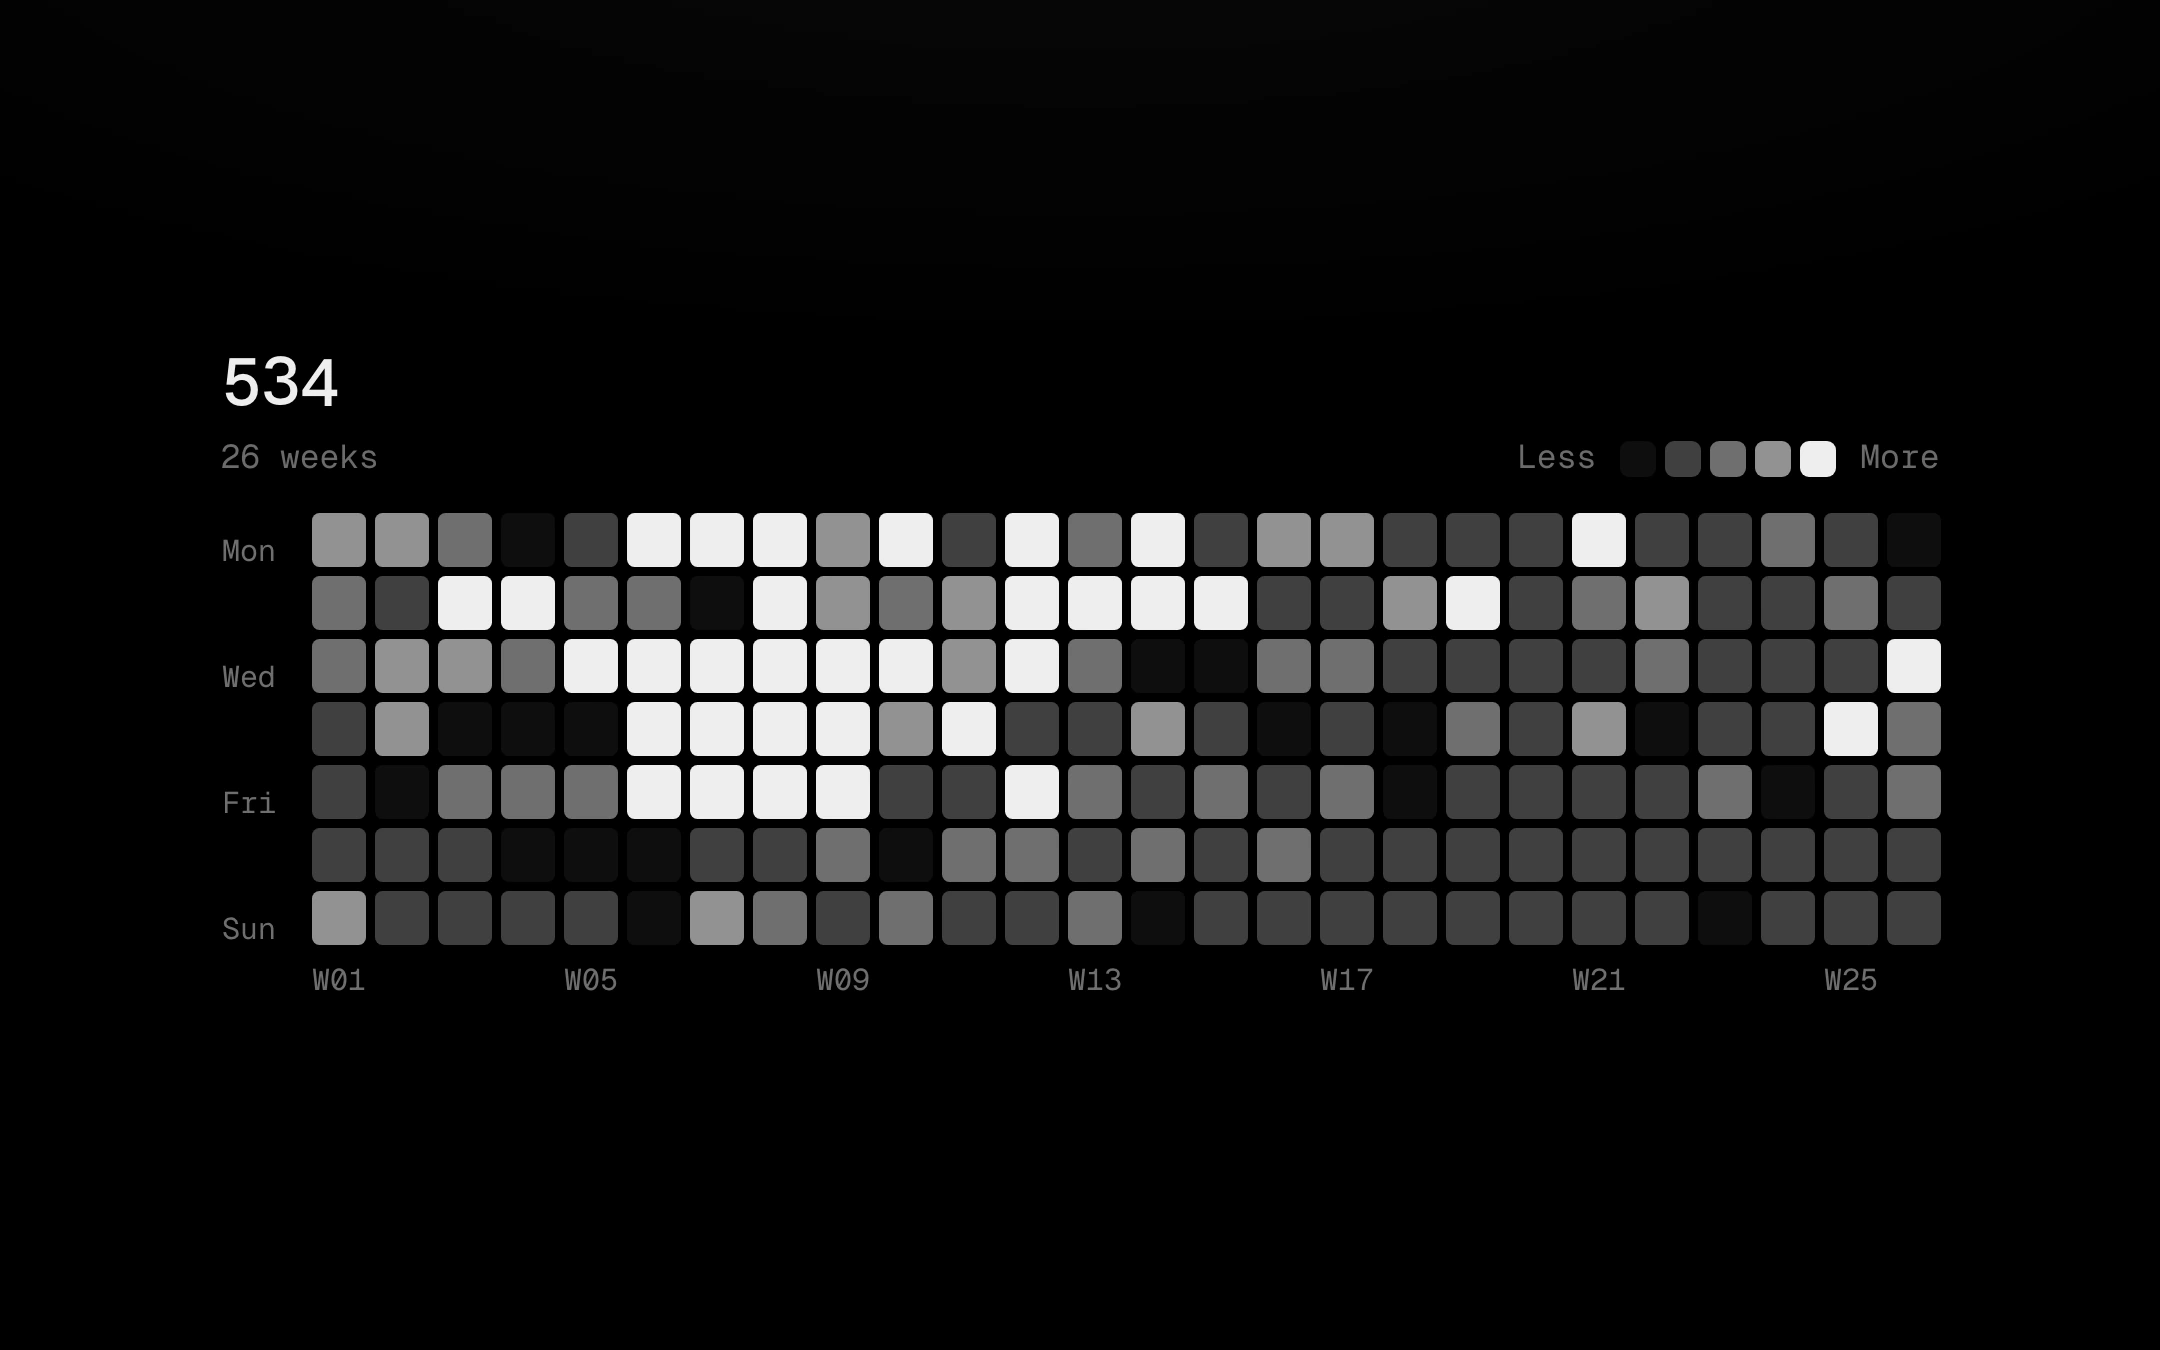
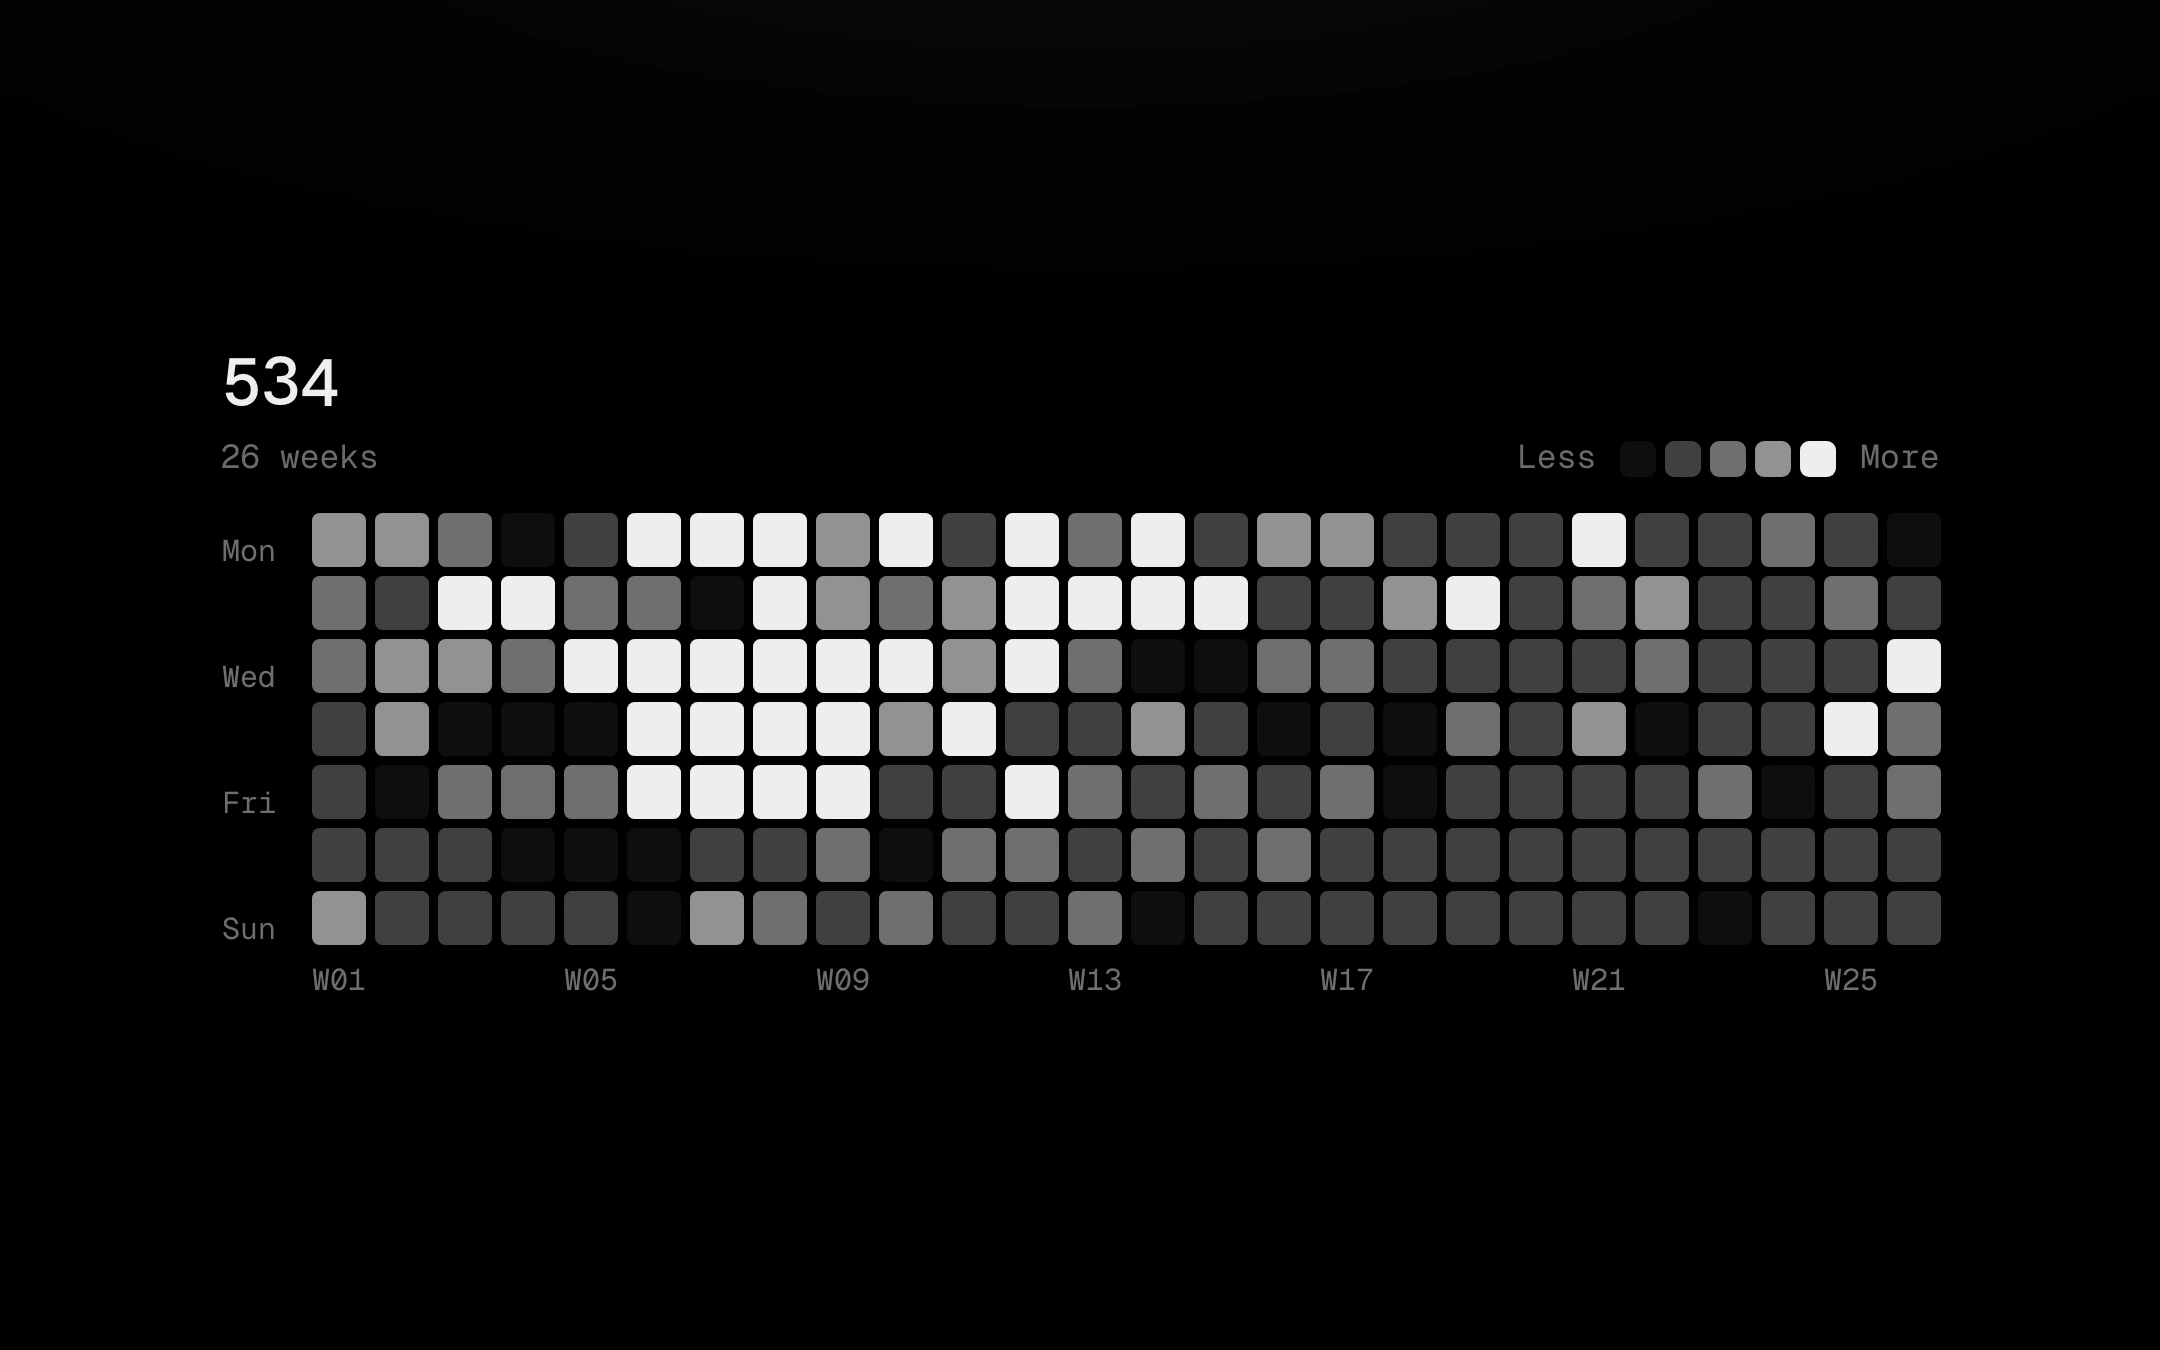
Seven days by N weeks of cells in five quiet bone levels.
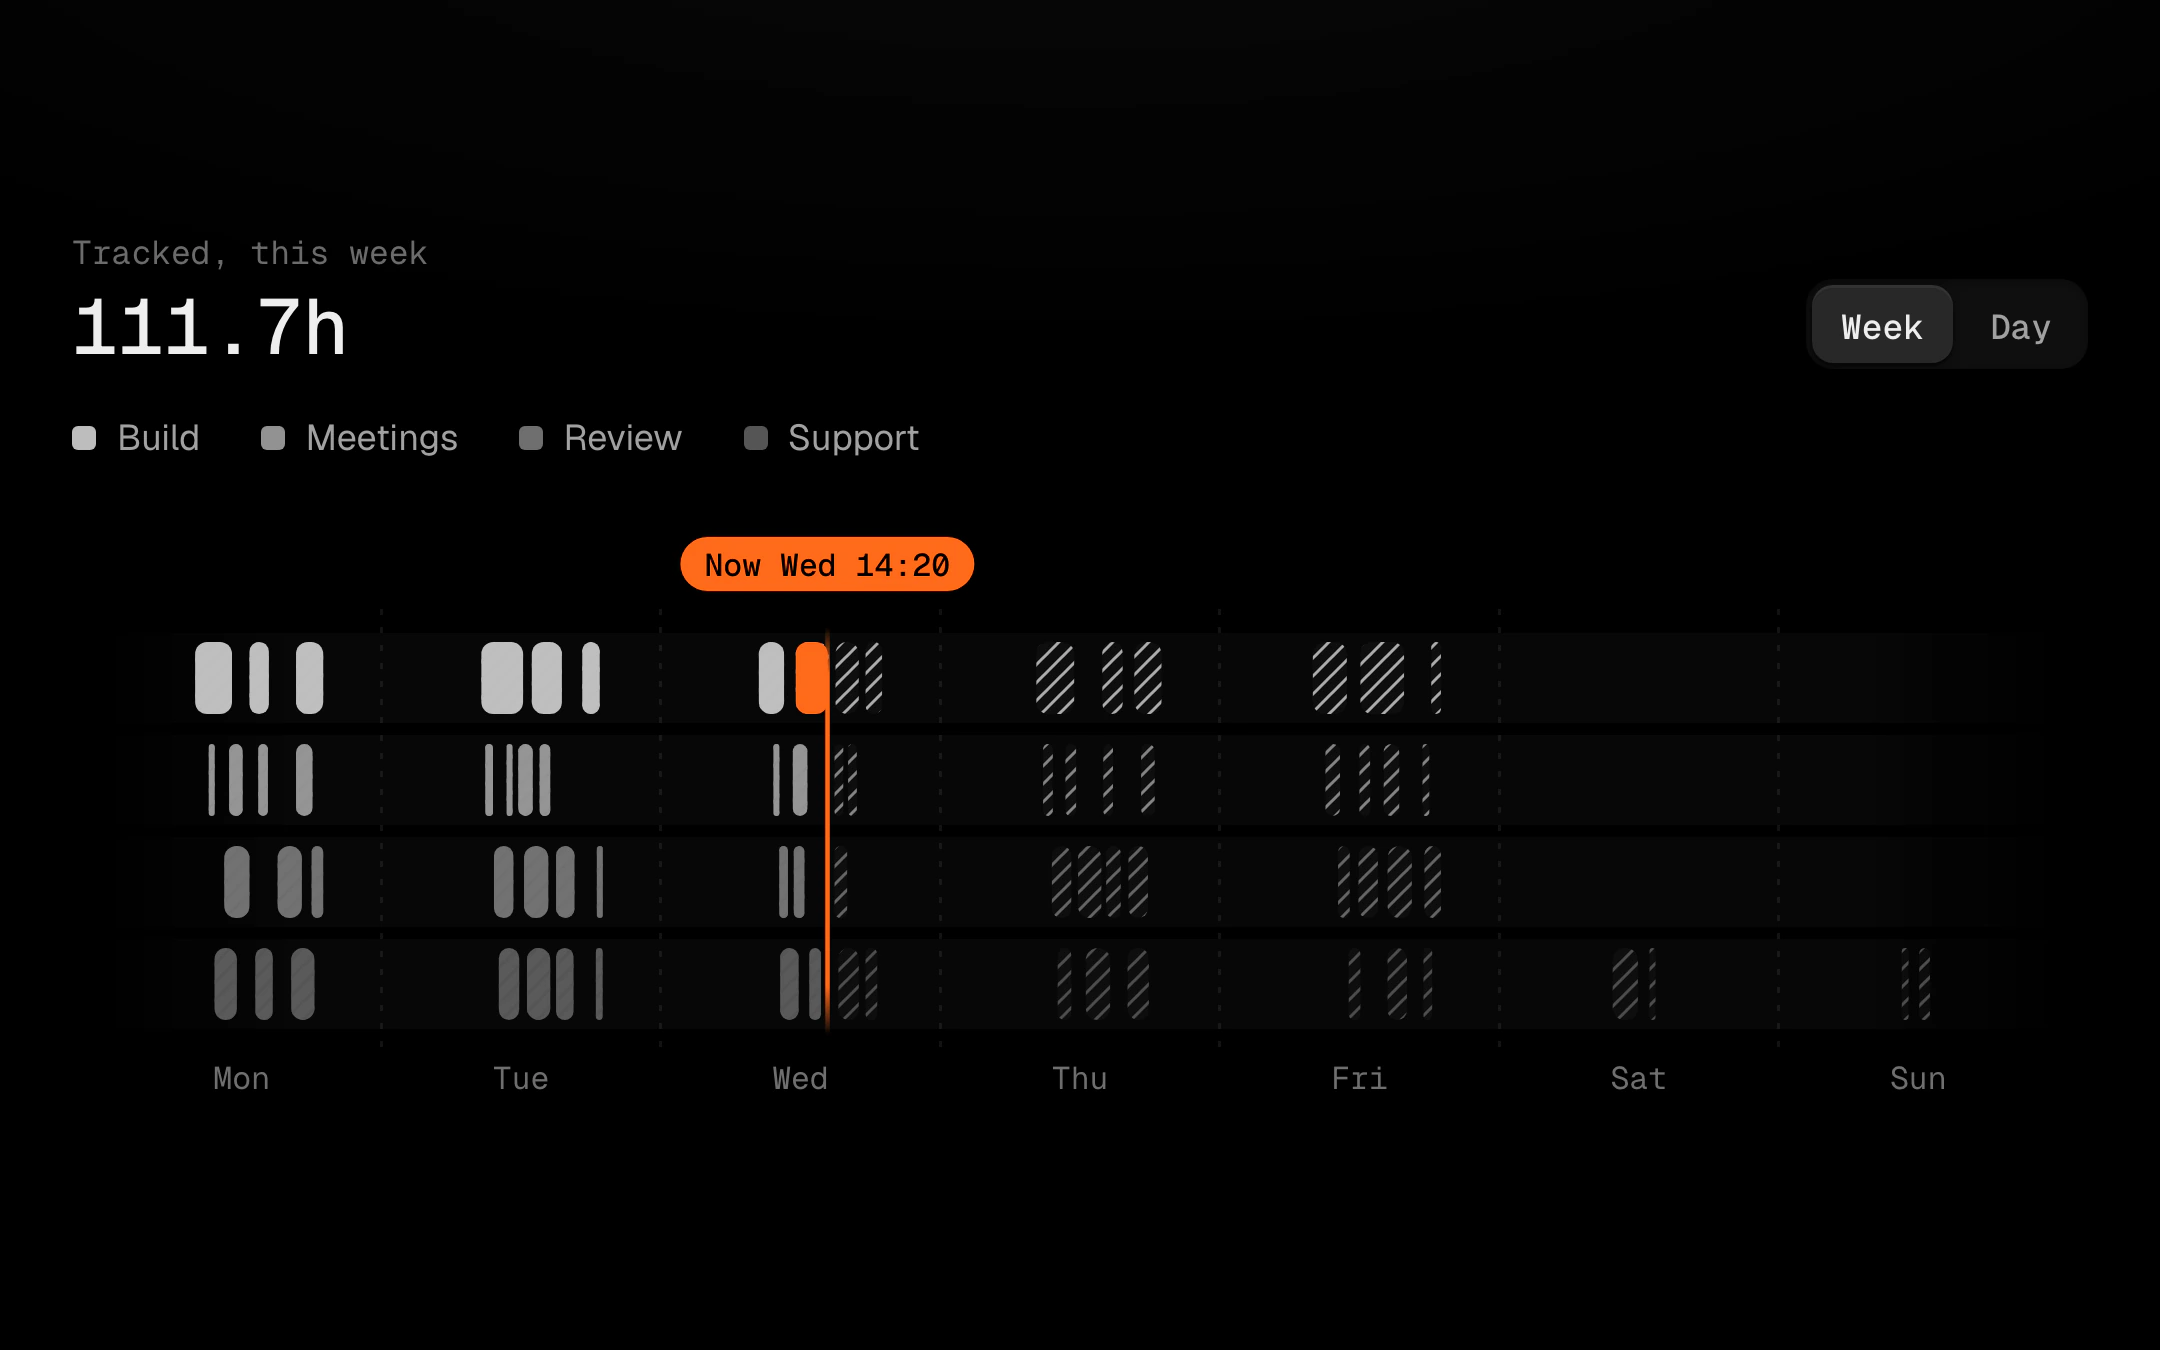
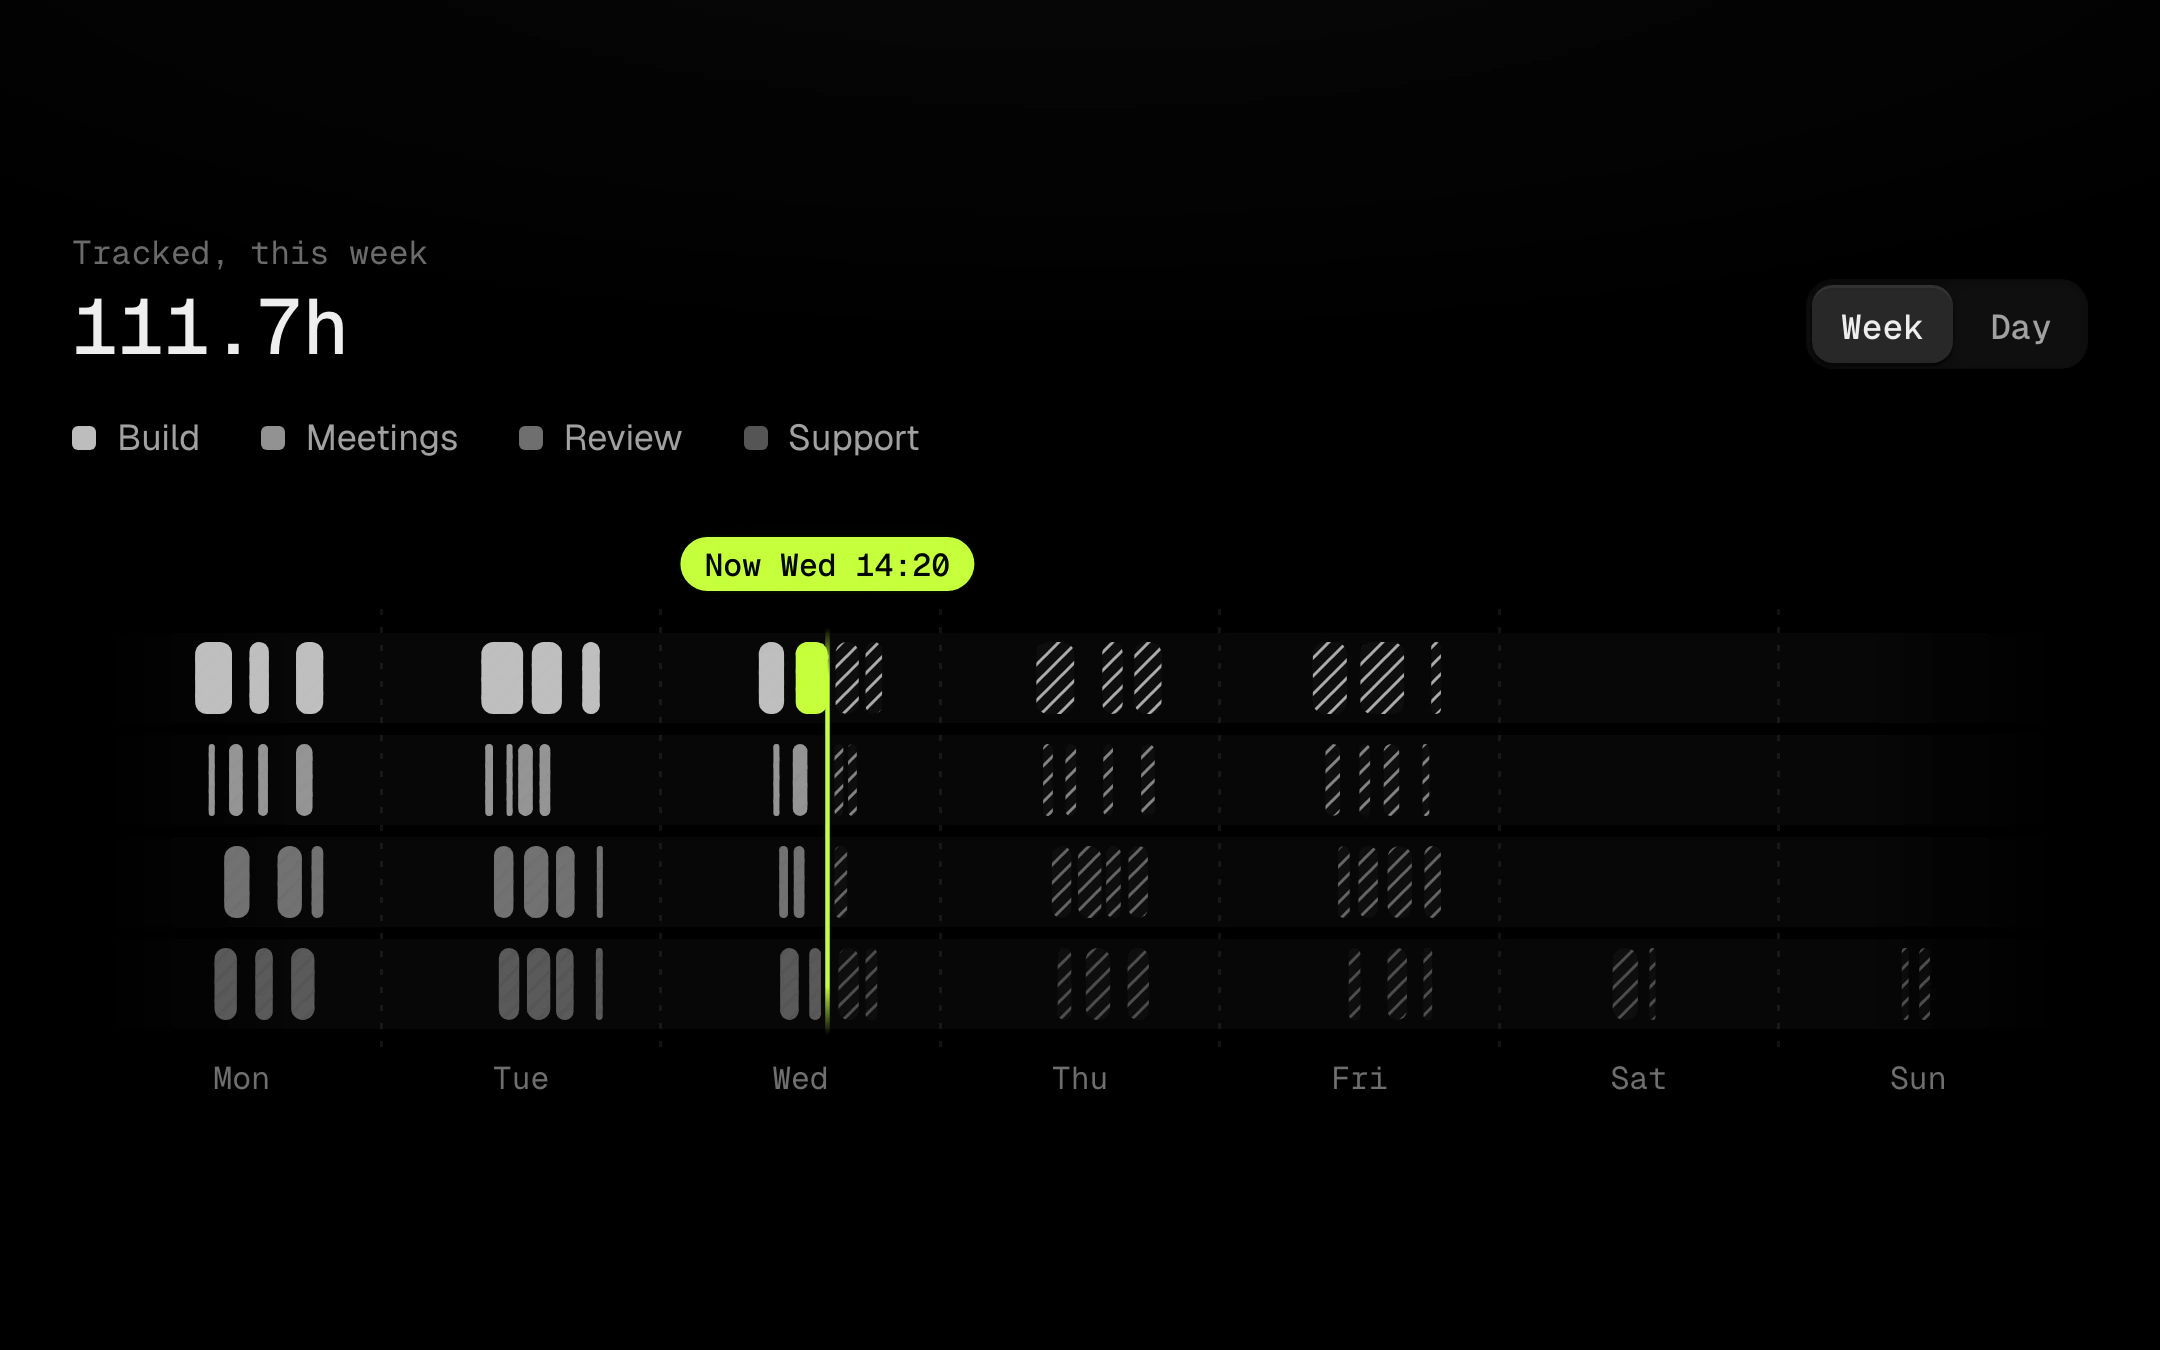
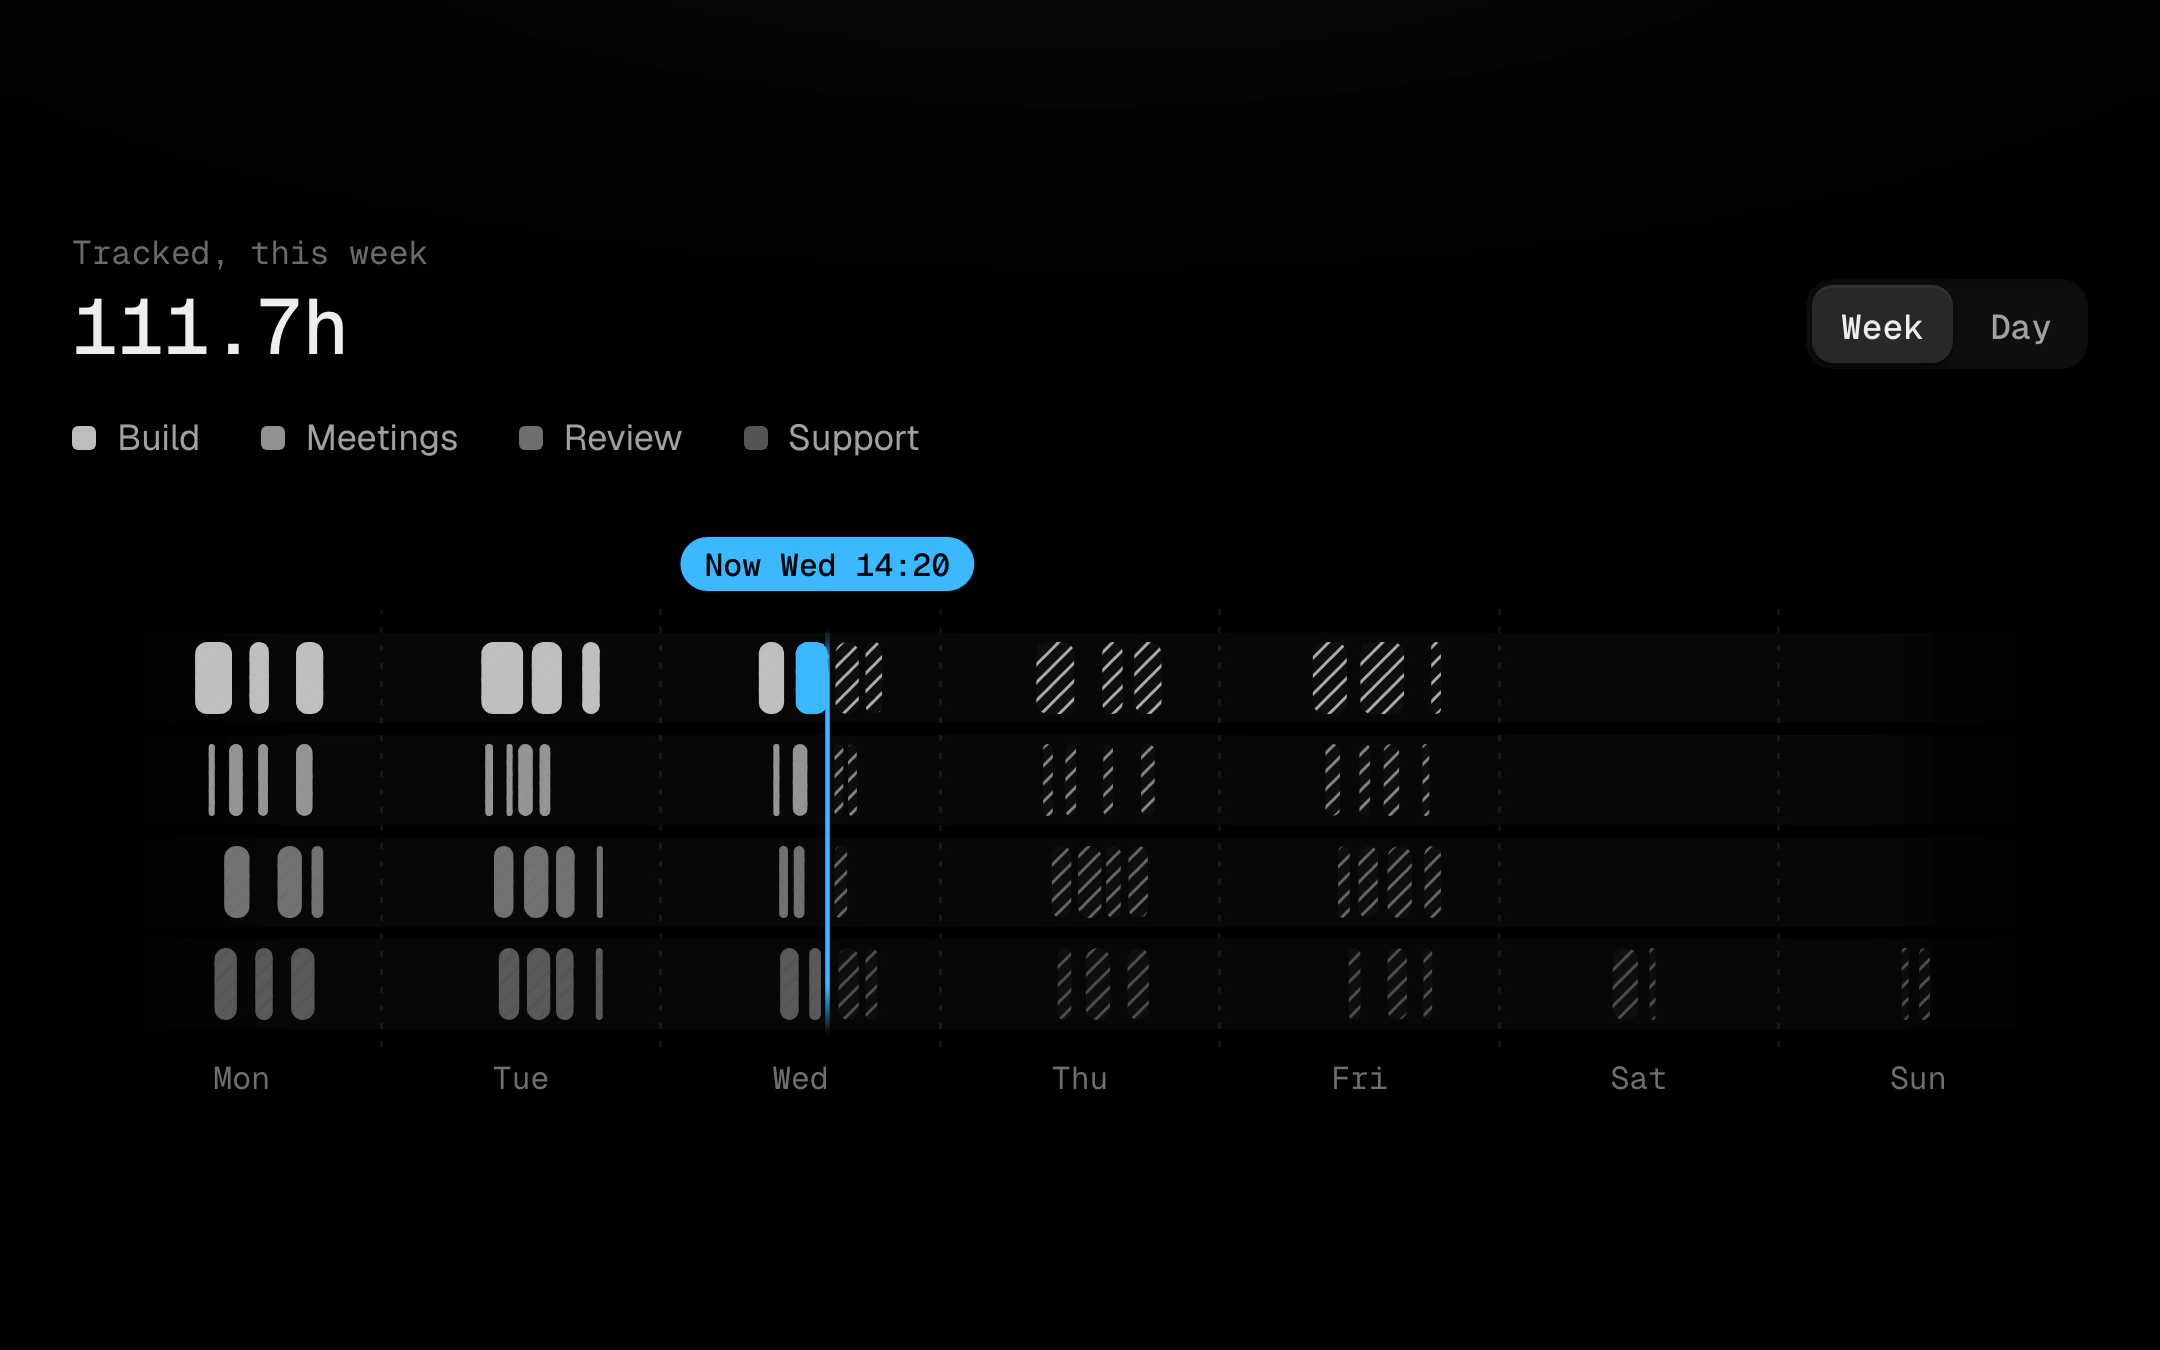
Events on a week track where a bar's width is its duration, one lane per kind.
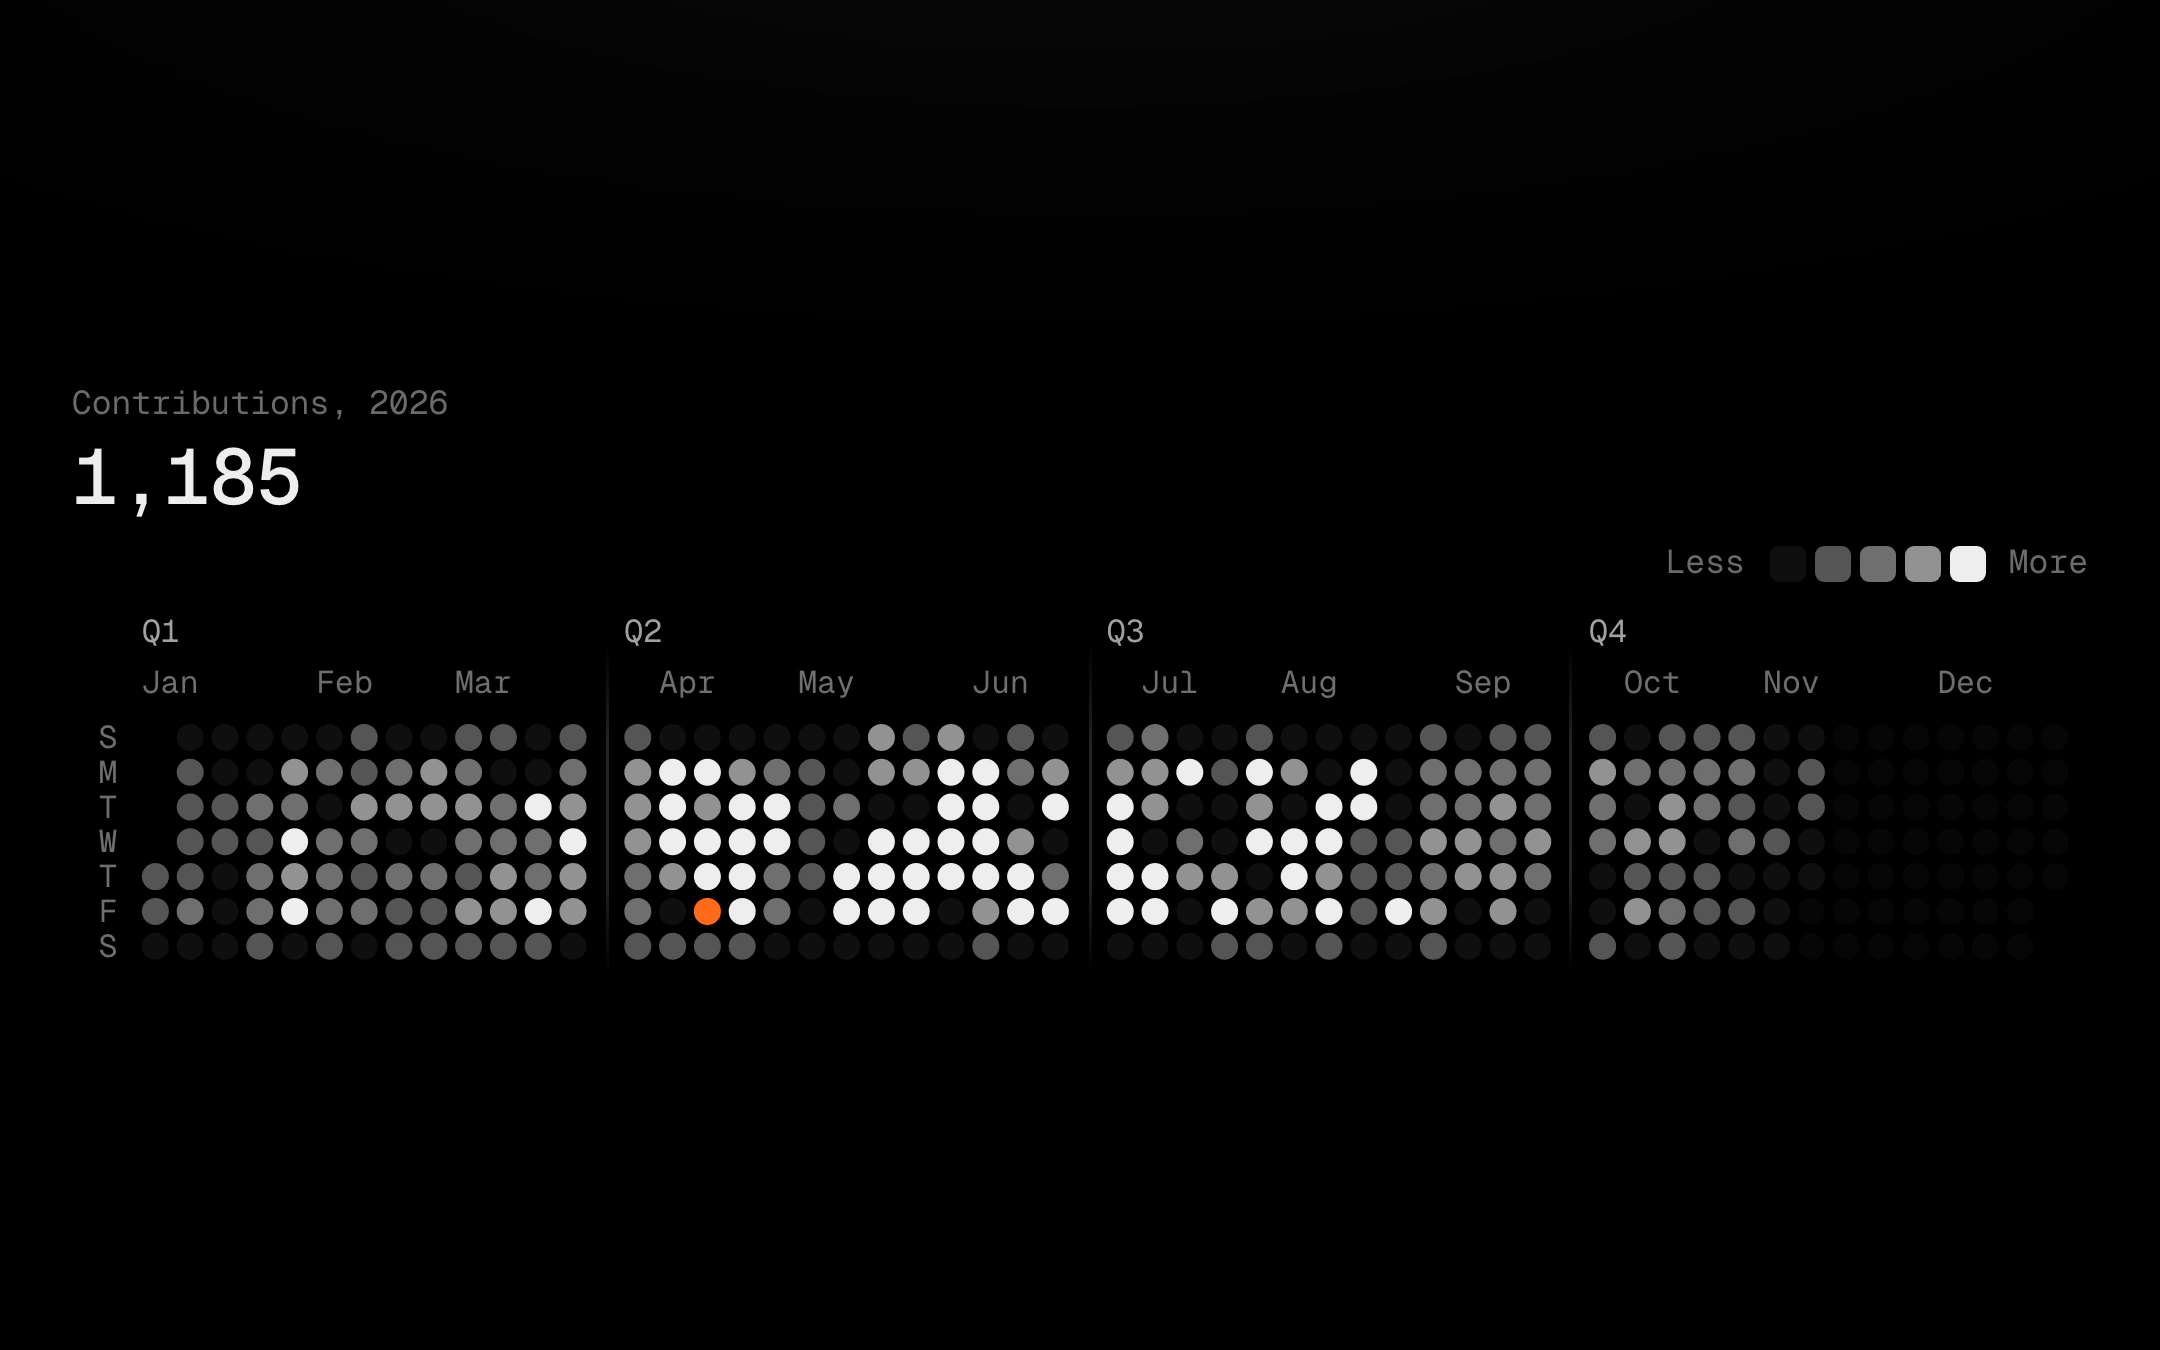
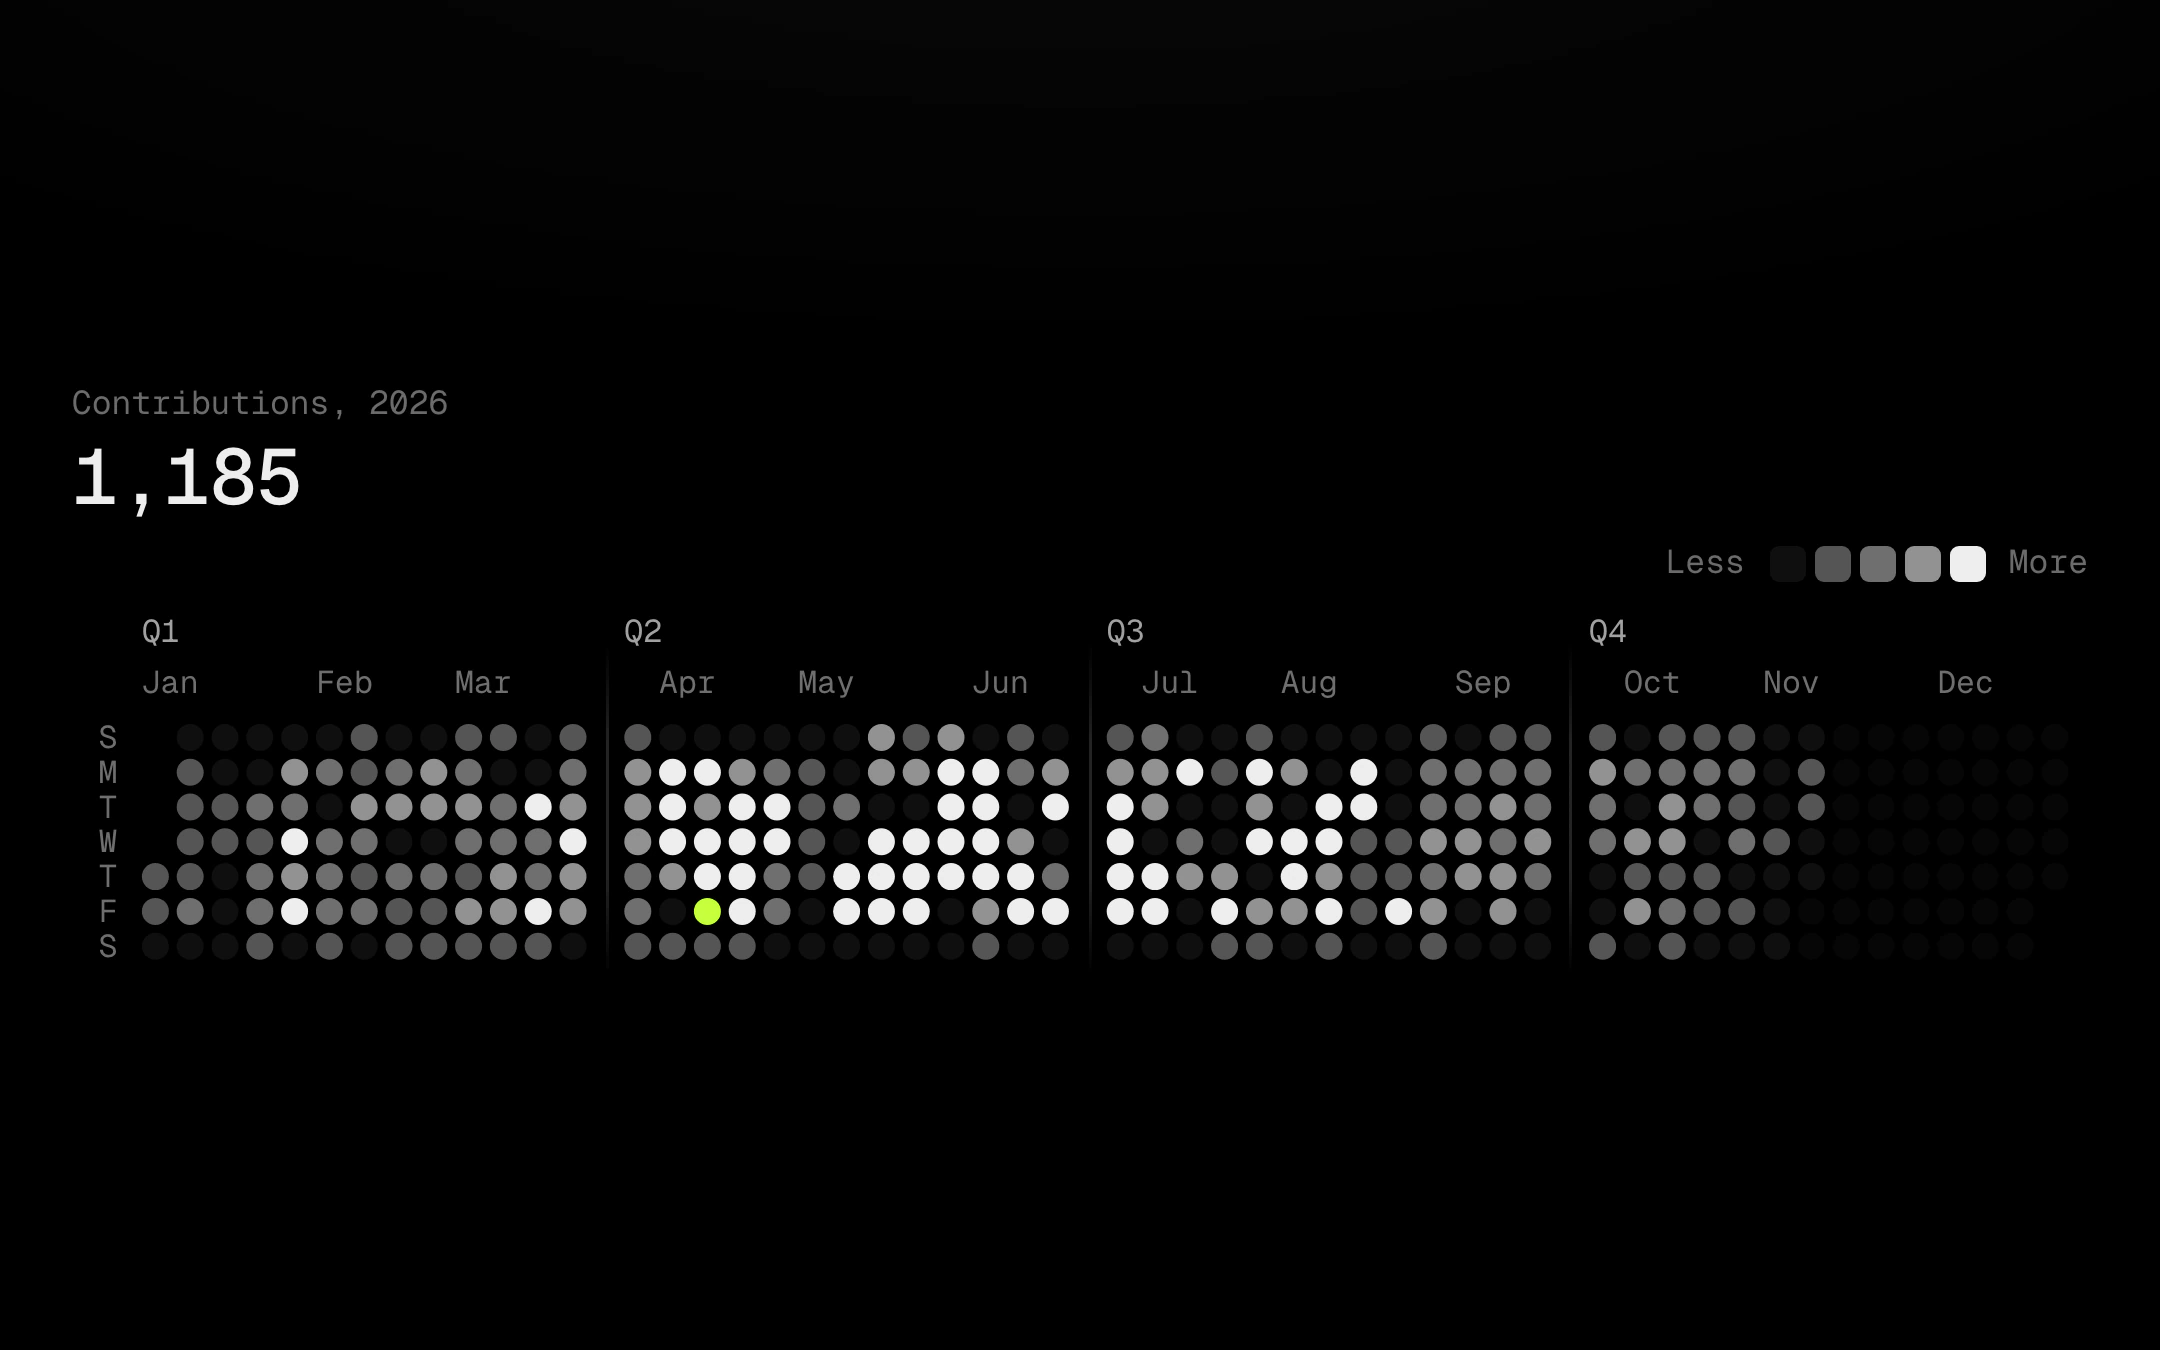
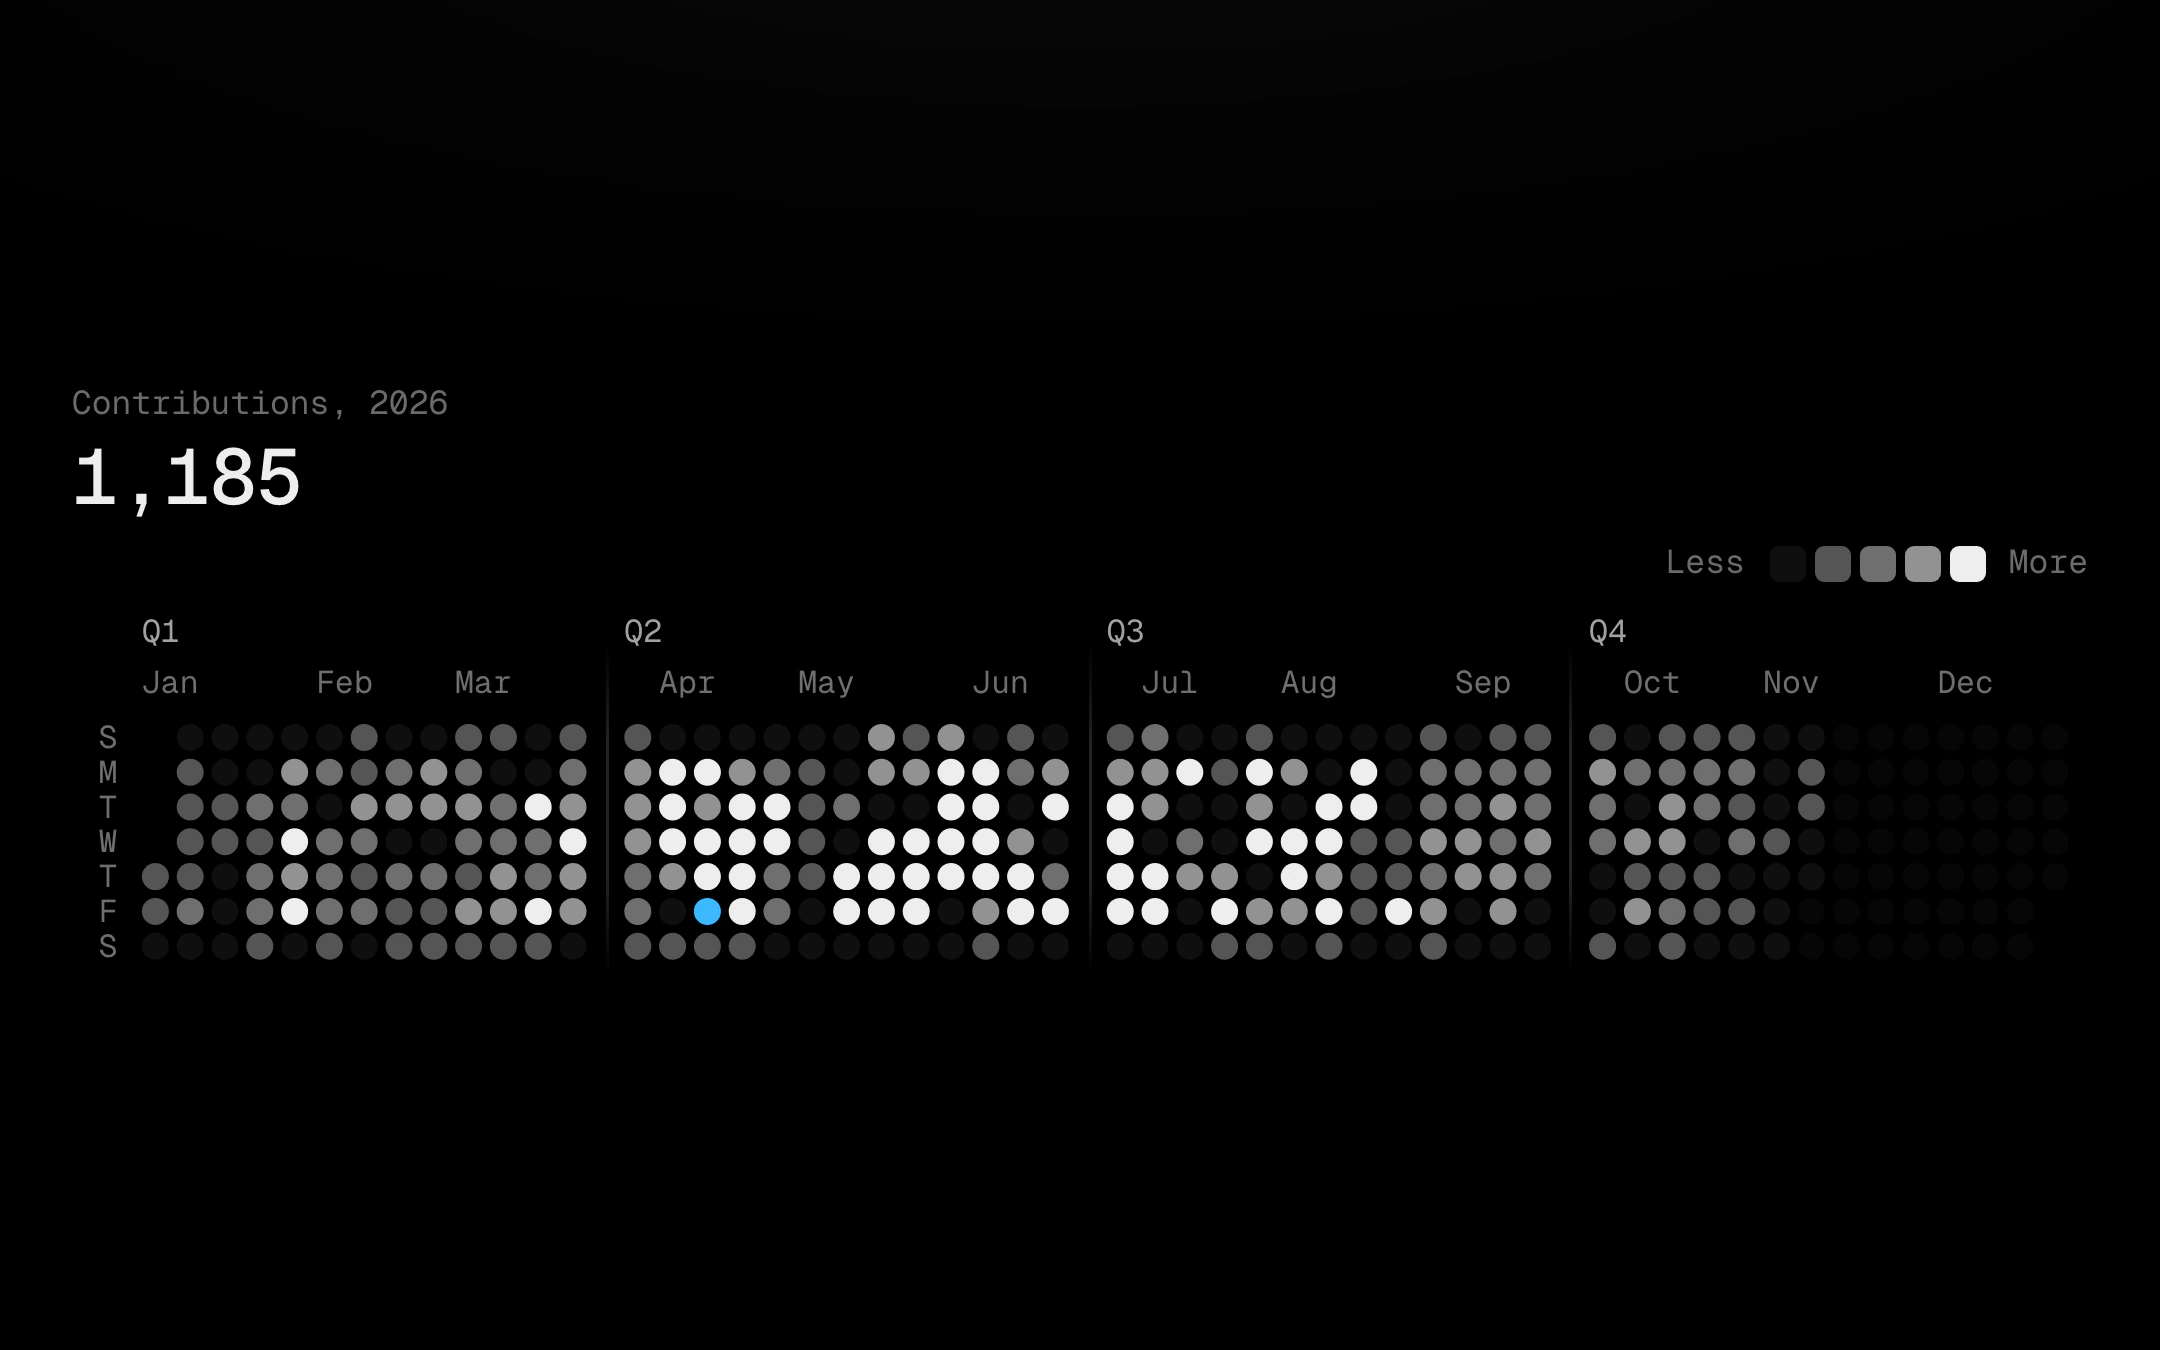
A year of days as a dot calendar: round or square cells in week columns, quarters set apart by a gap with a hairline that fades at both ends, single-letter day labels, months and quarters above, and future days left as faint empties.
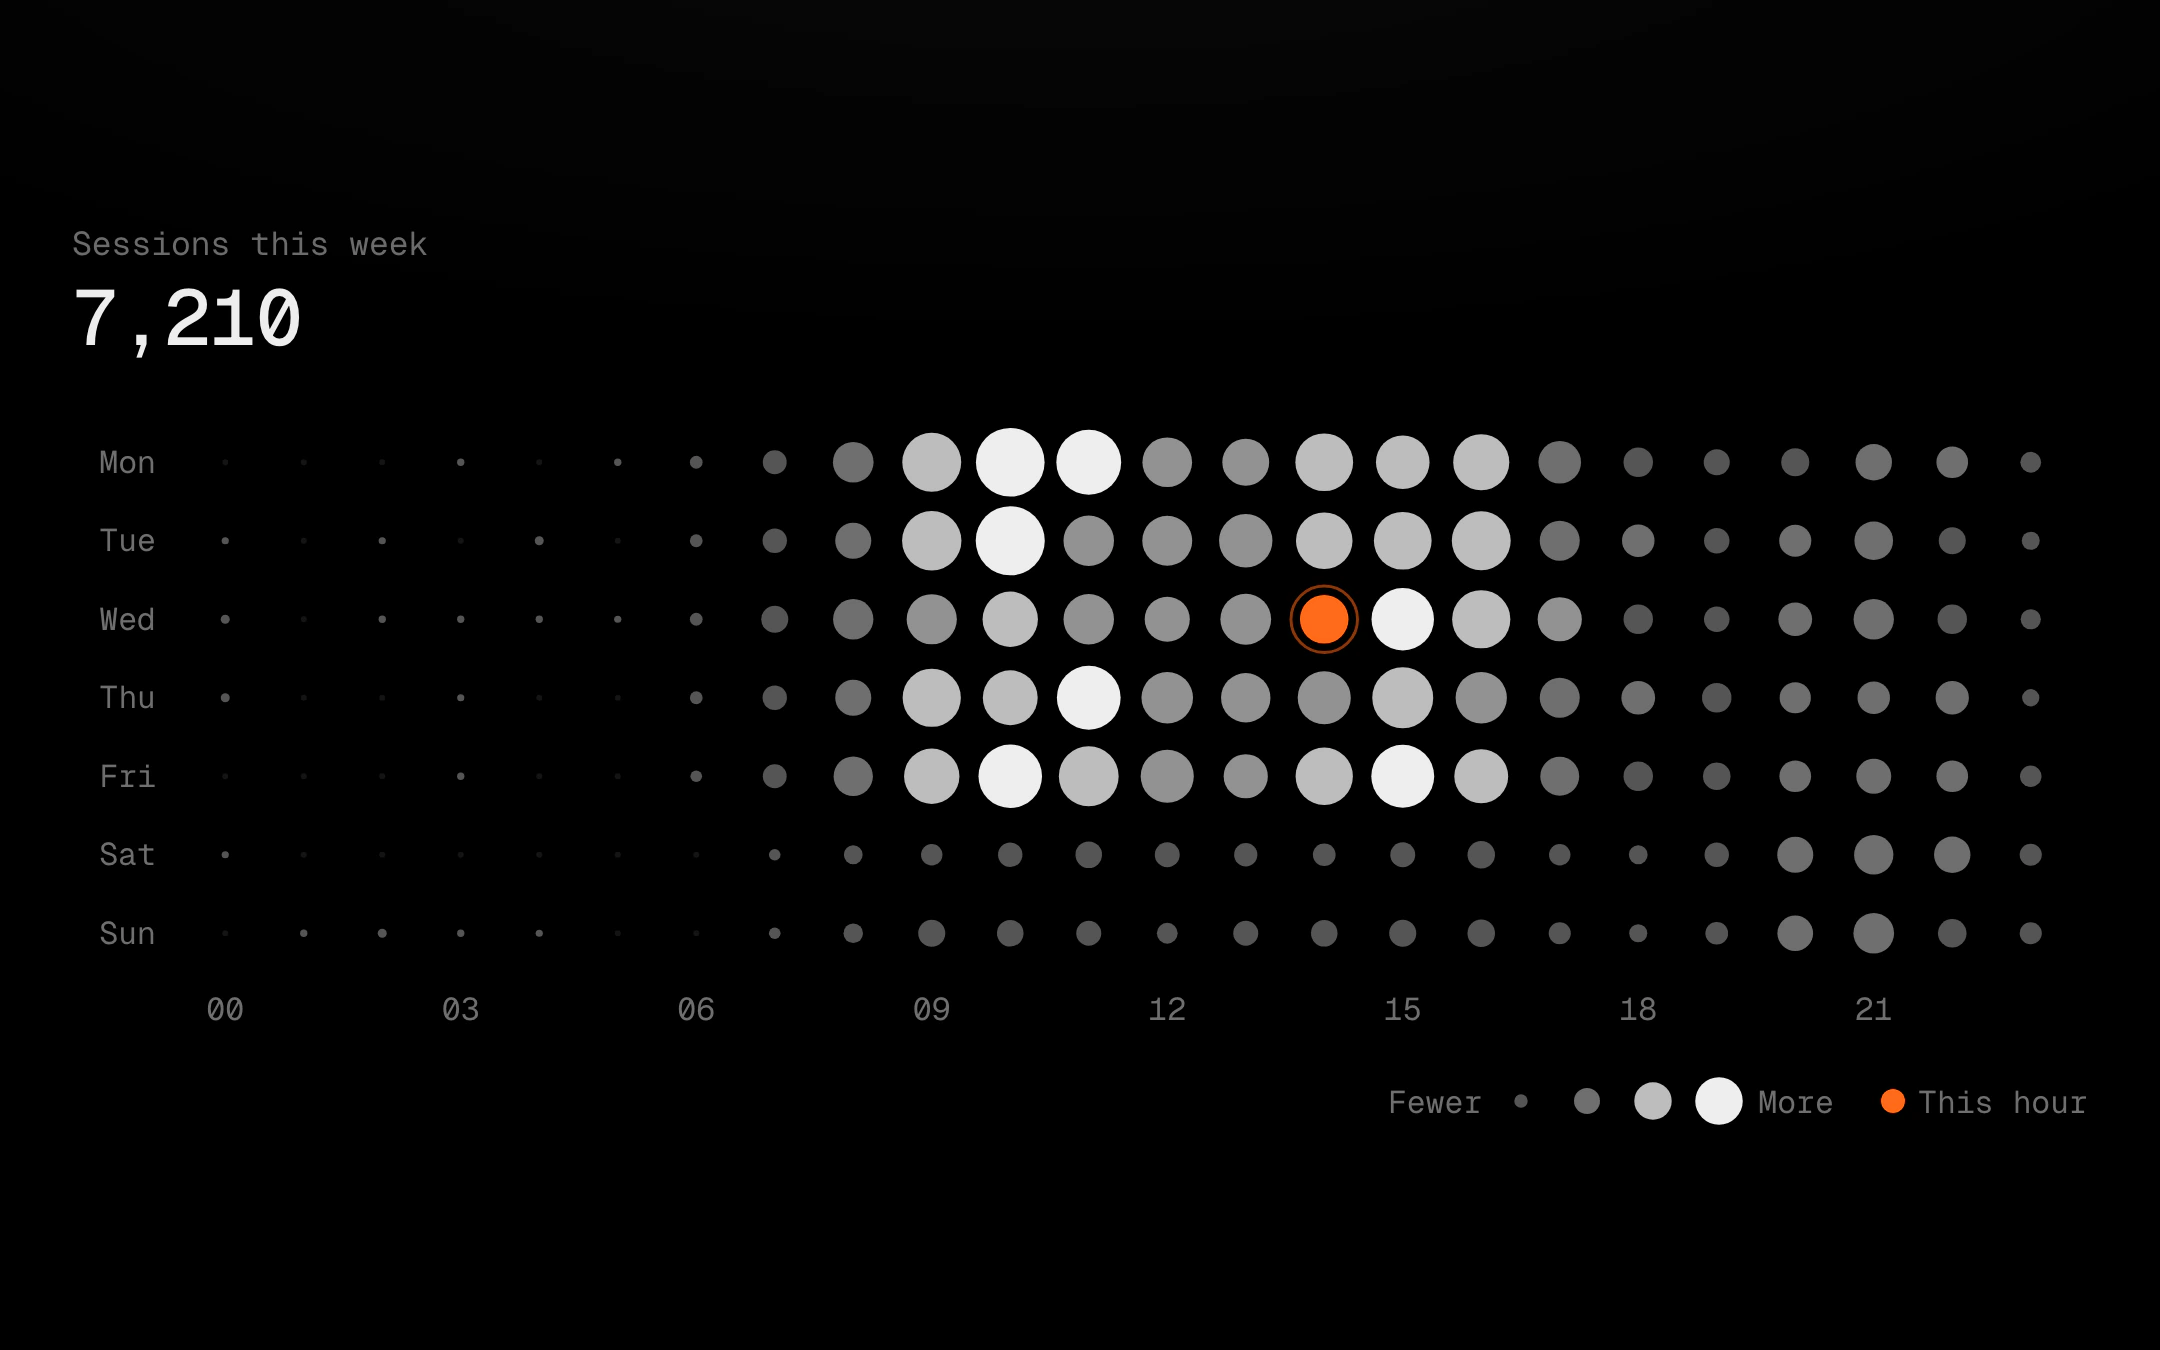
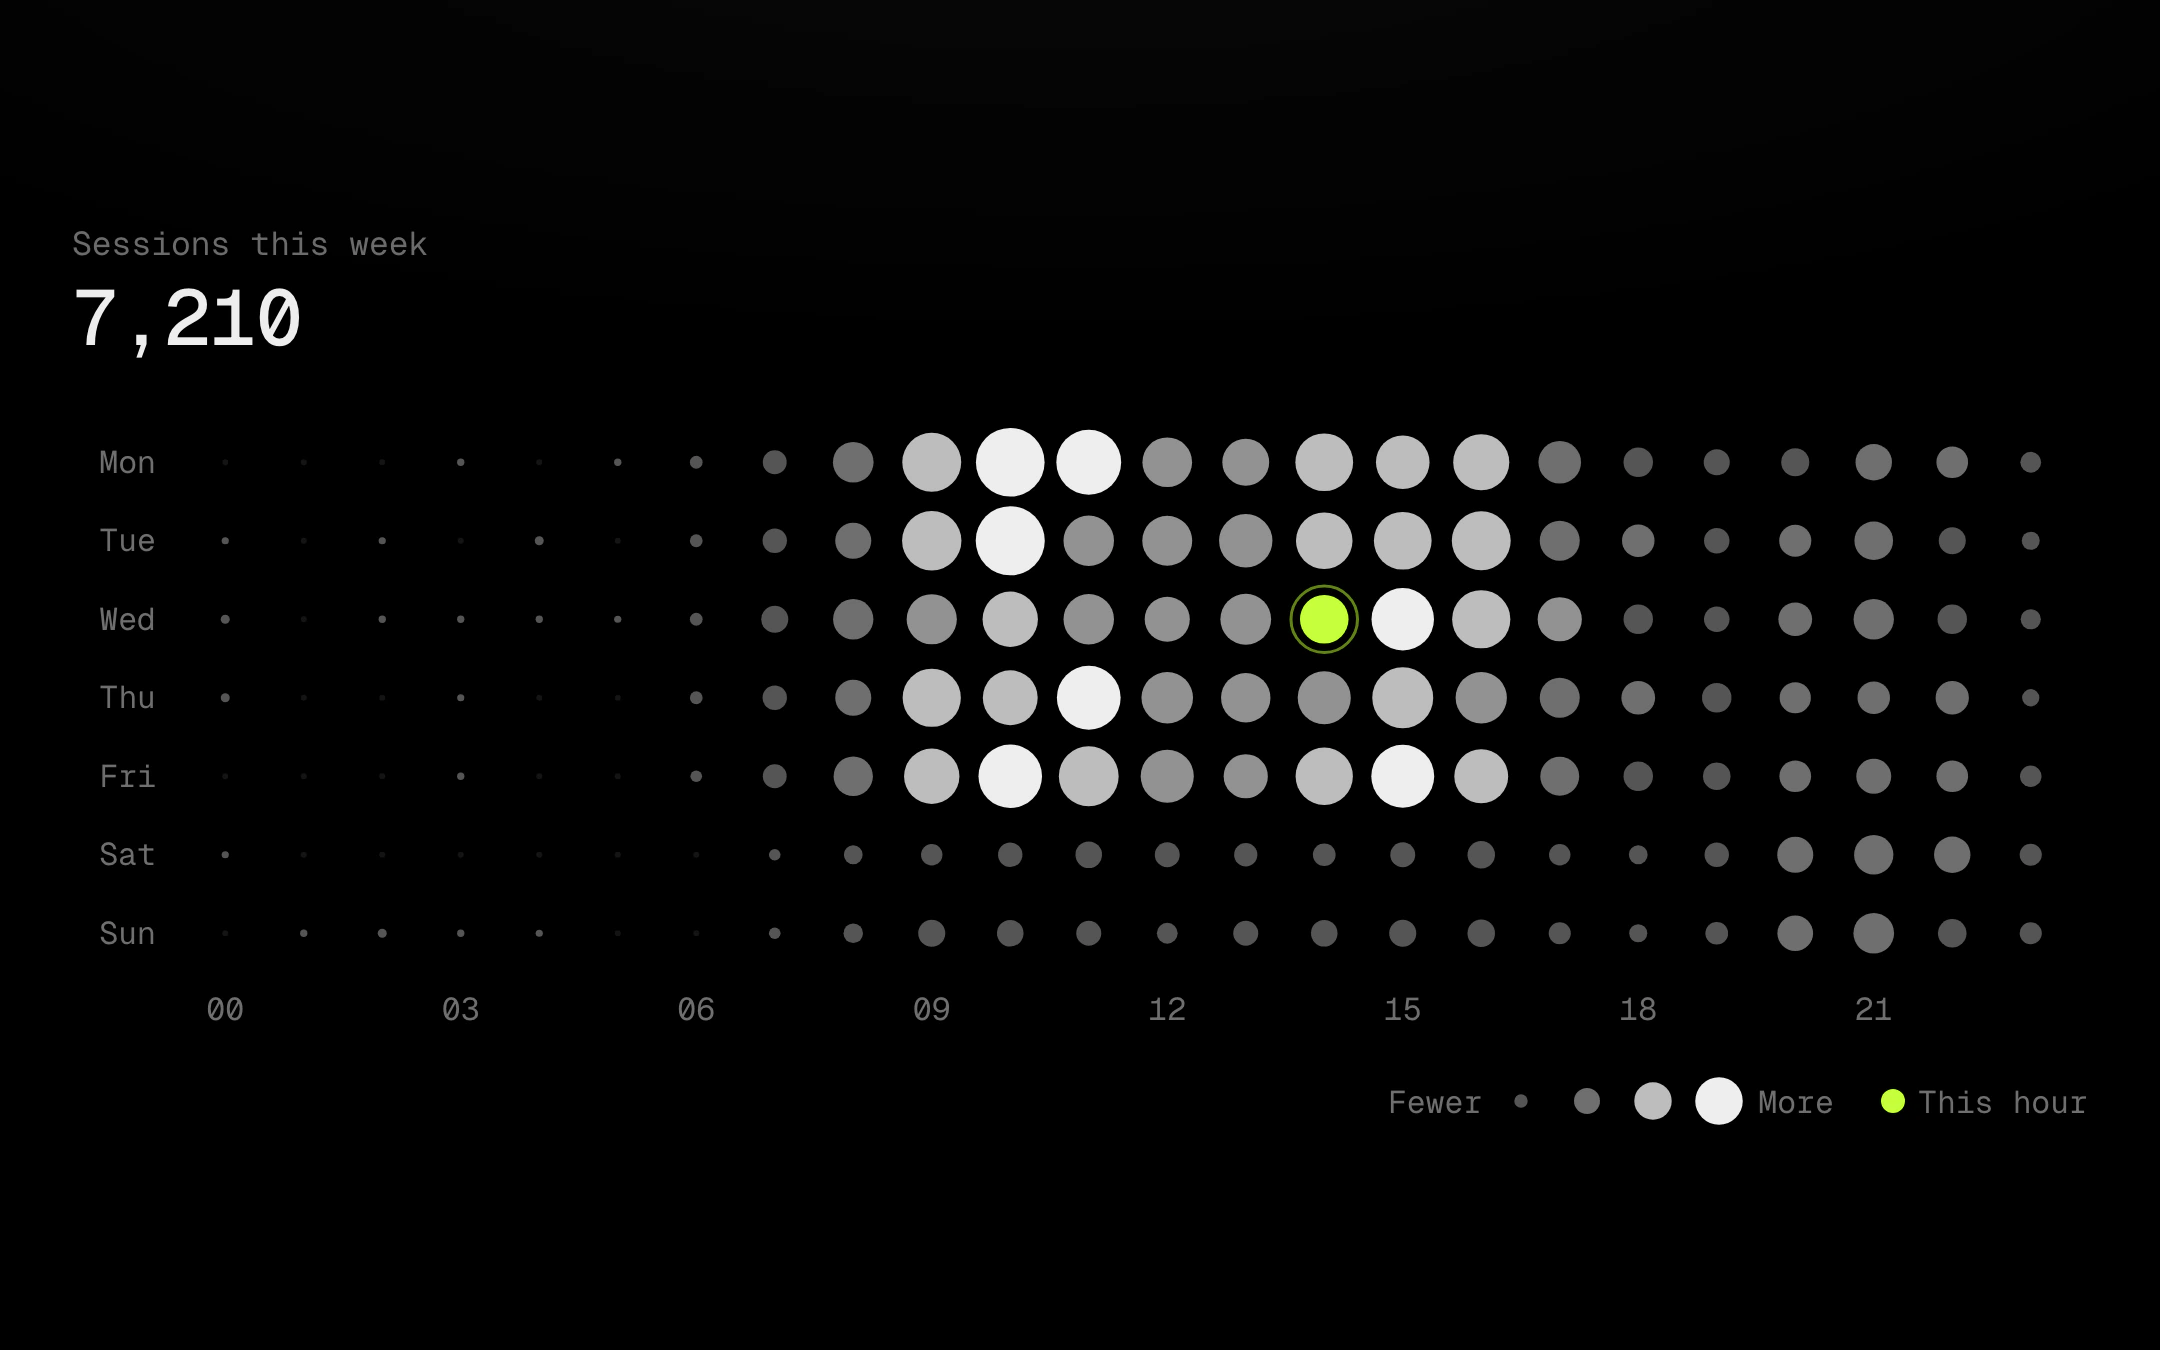
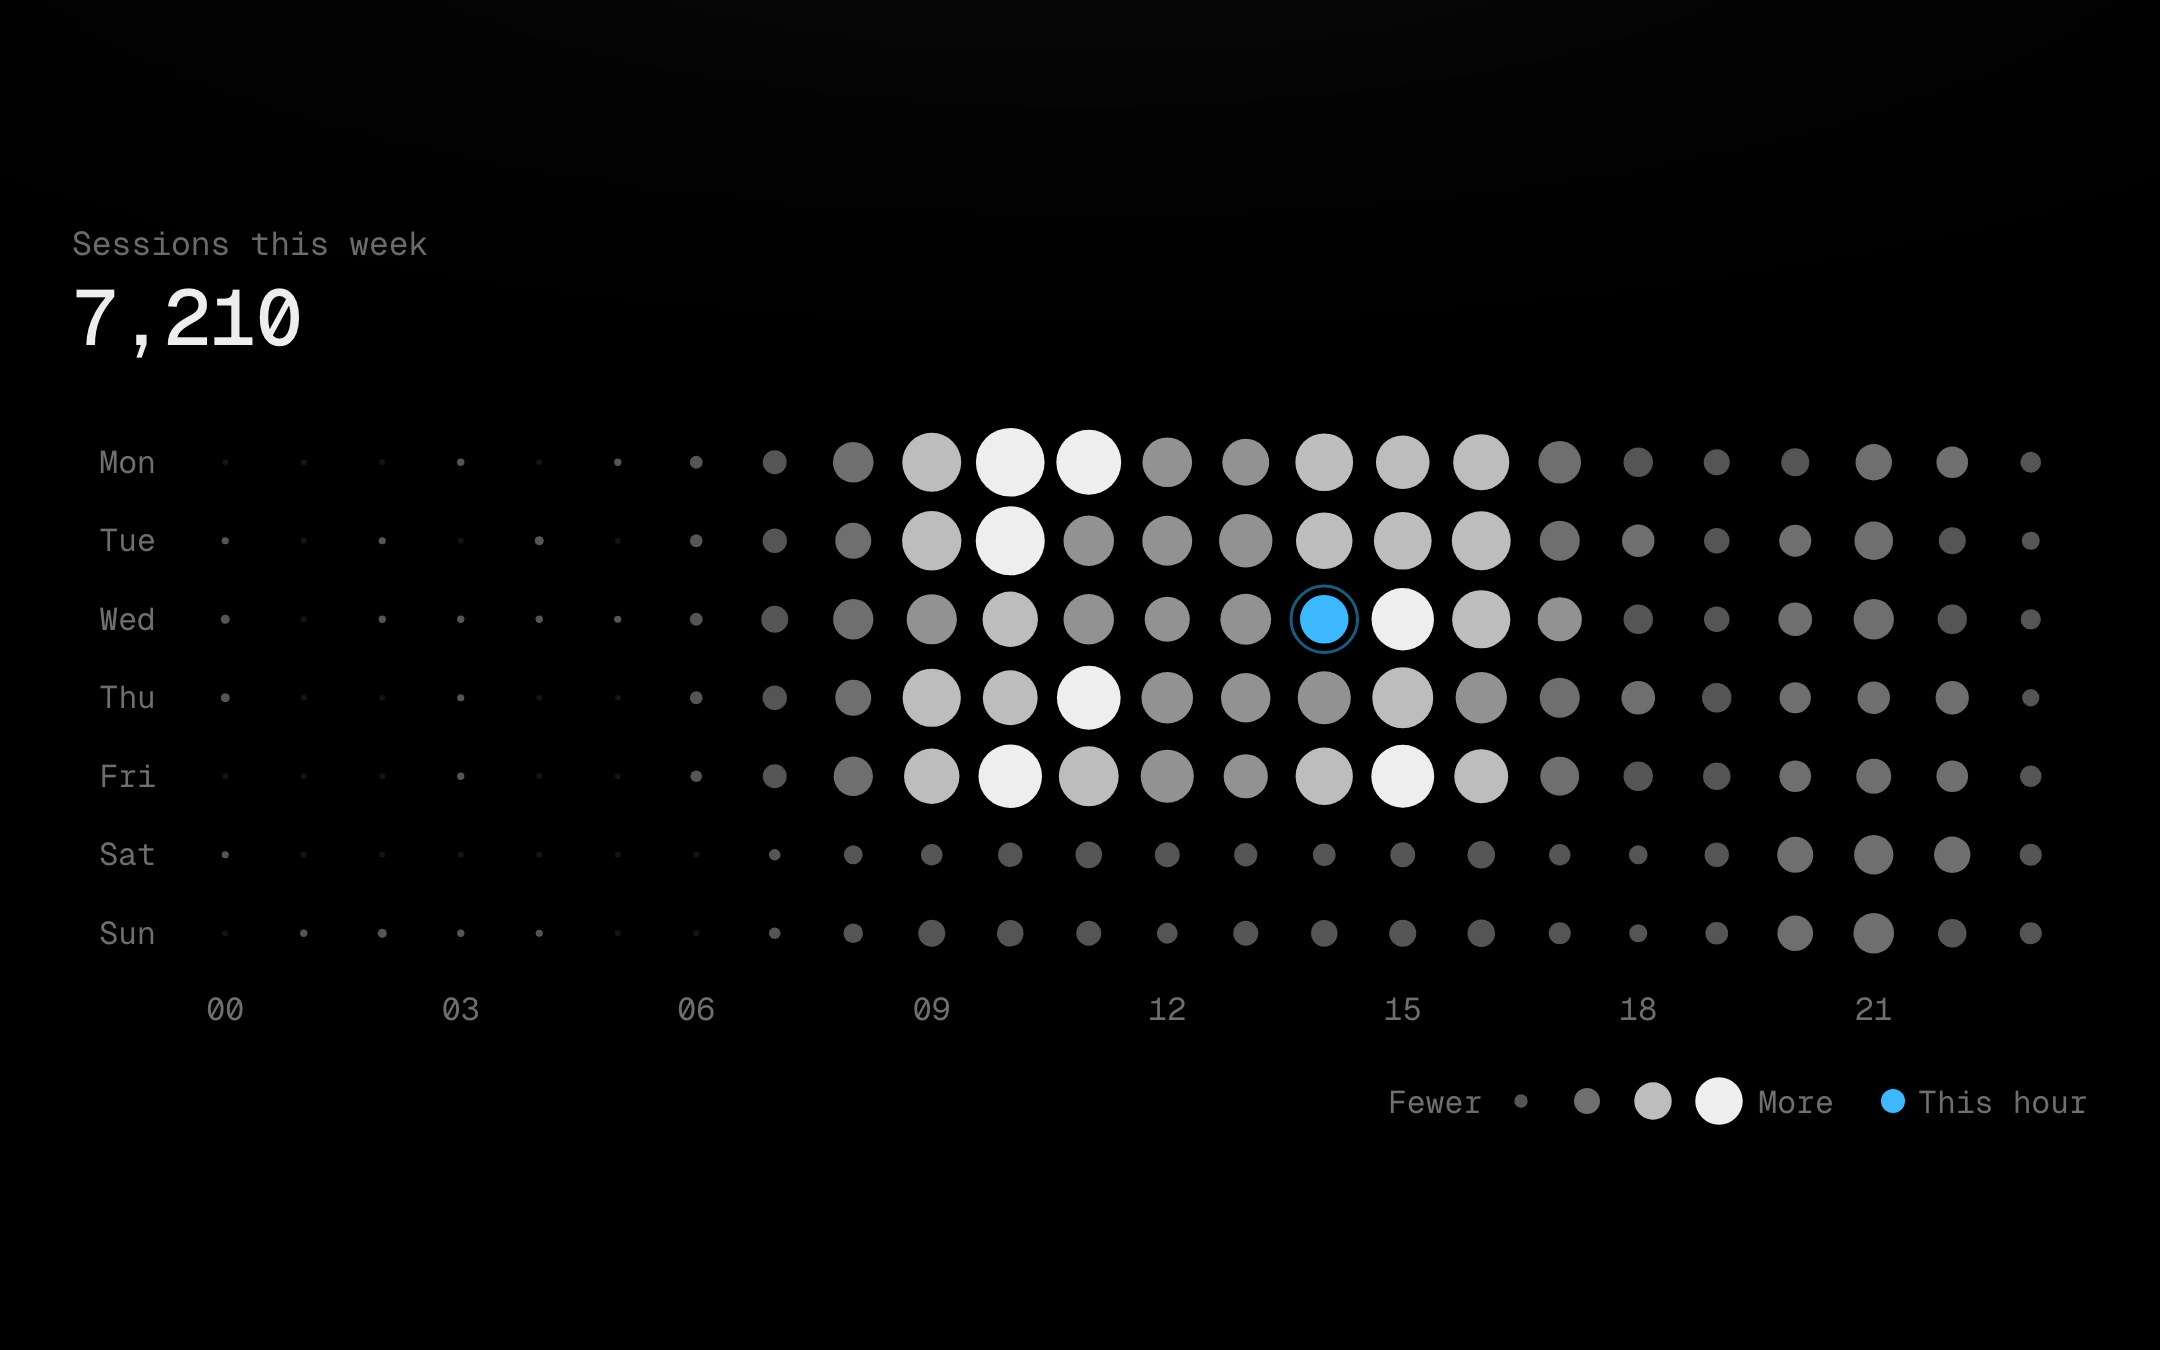
Day by hour as a grid of dots sized, and optionally shaded up the grey ladder, by value, so the busy hours of the week read at a glance and empty slots stay as pinpricks.
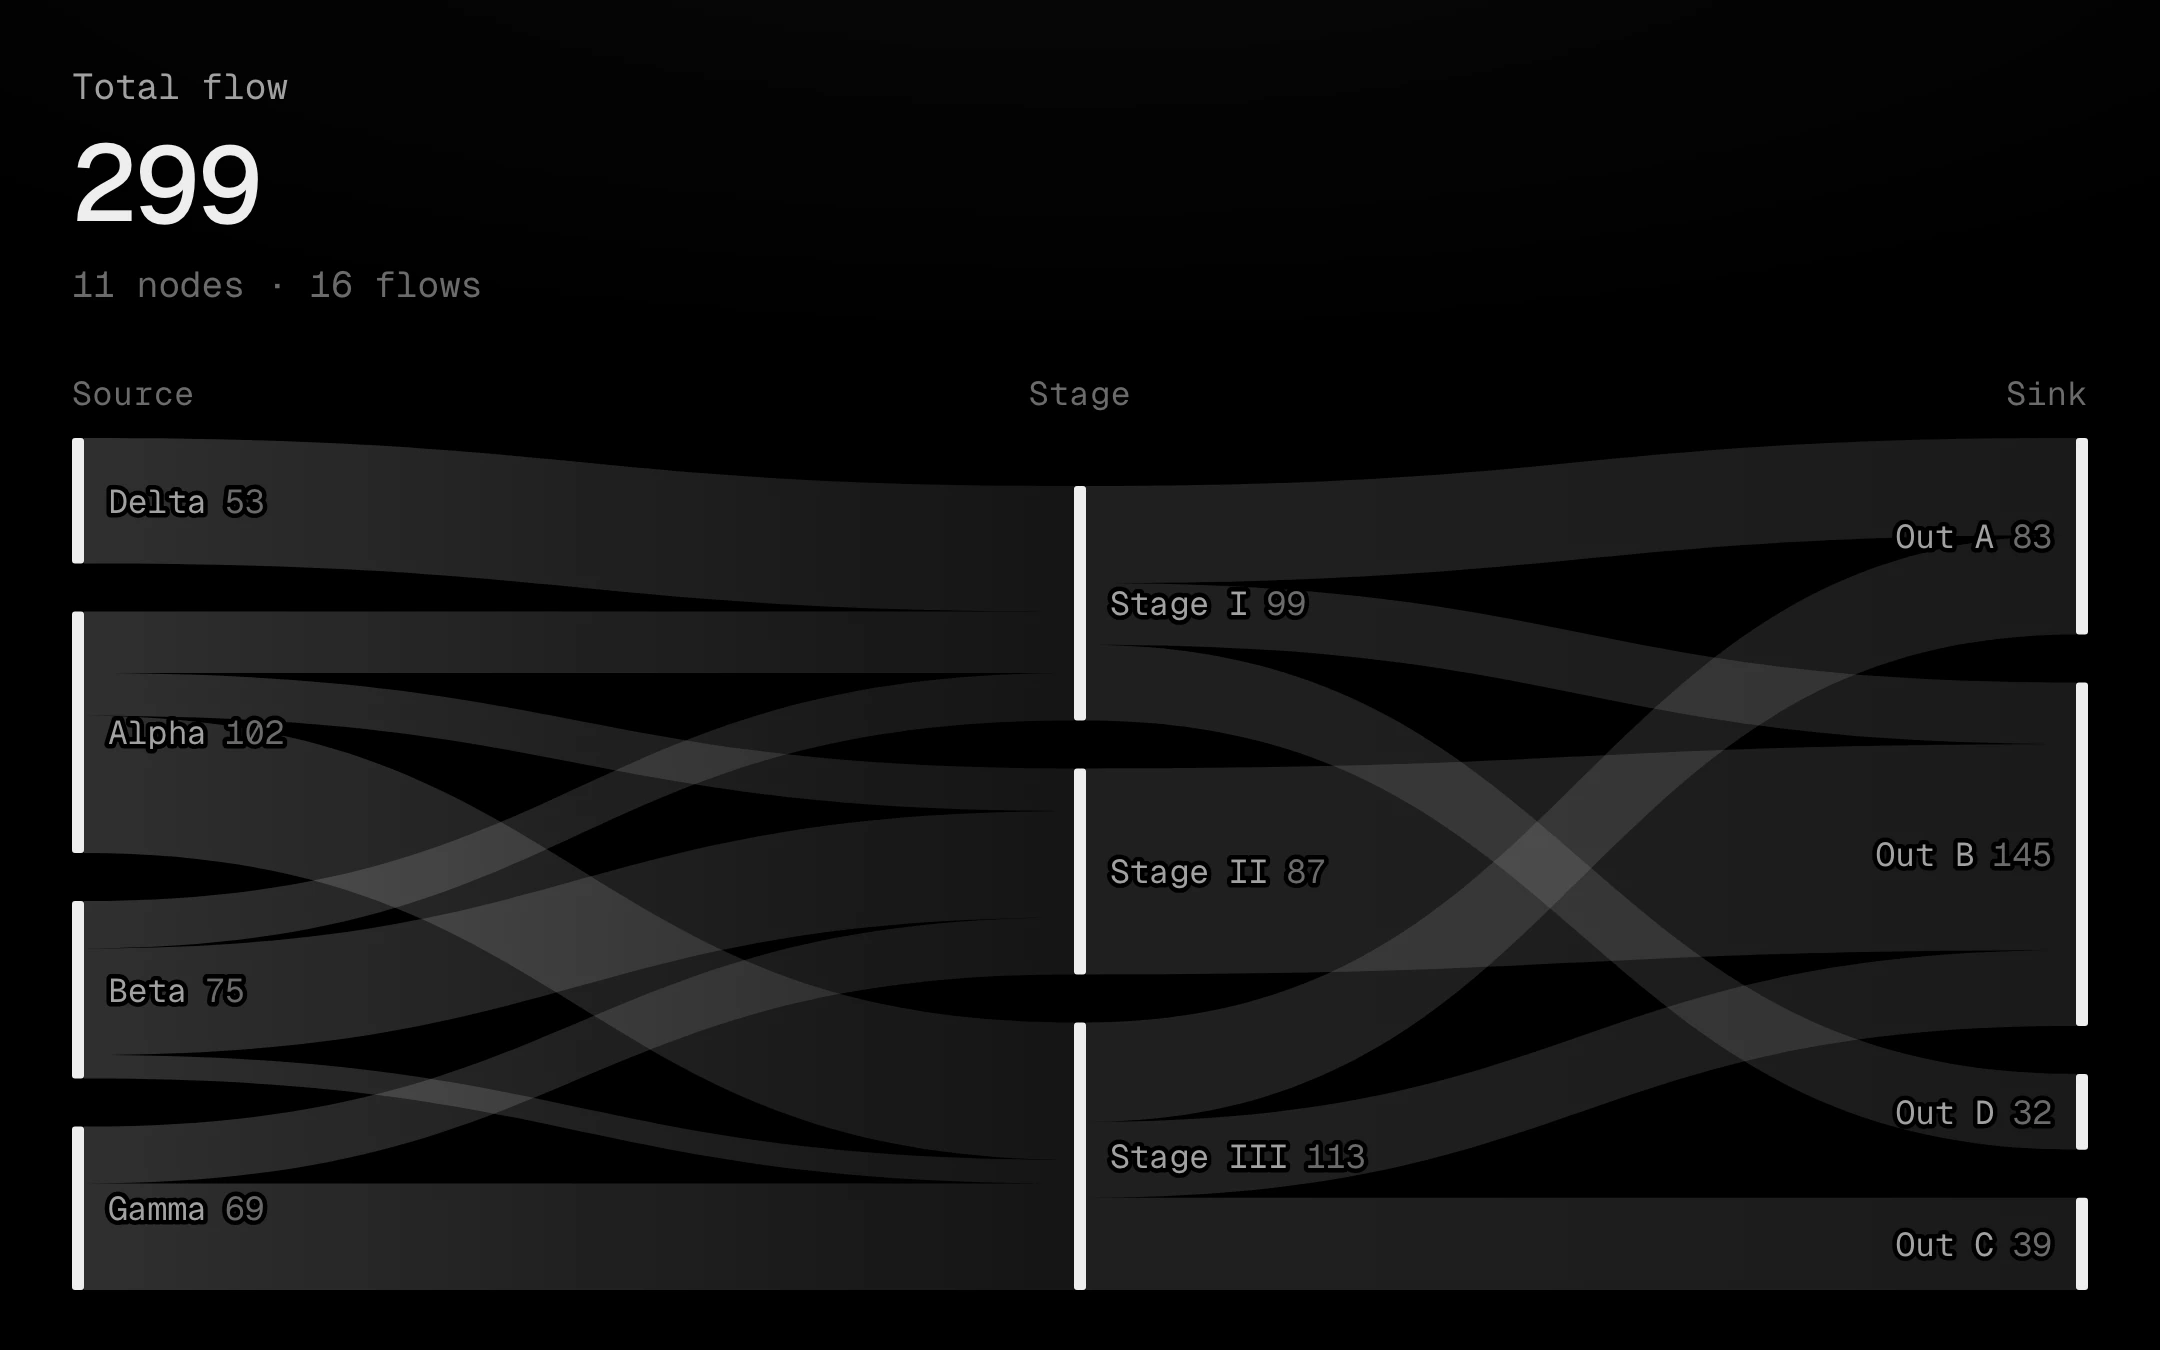
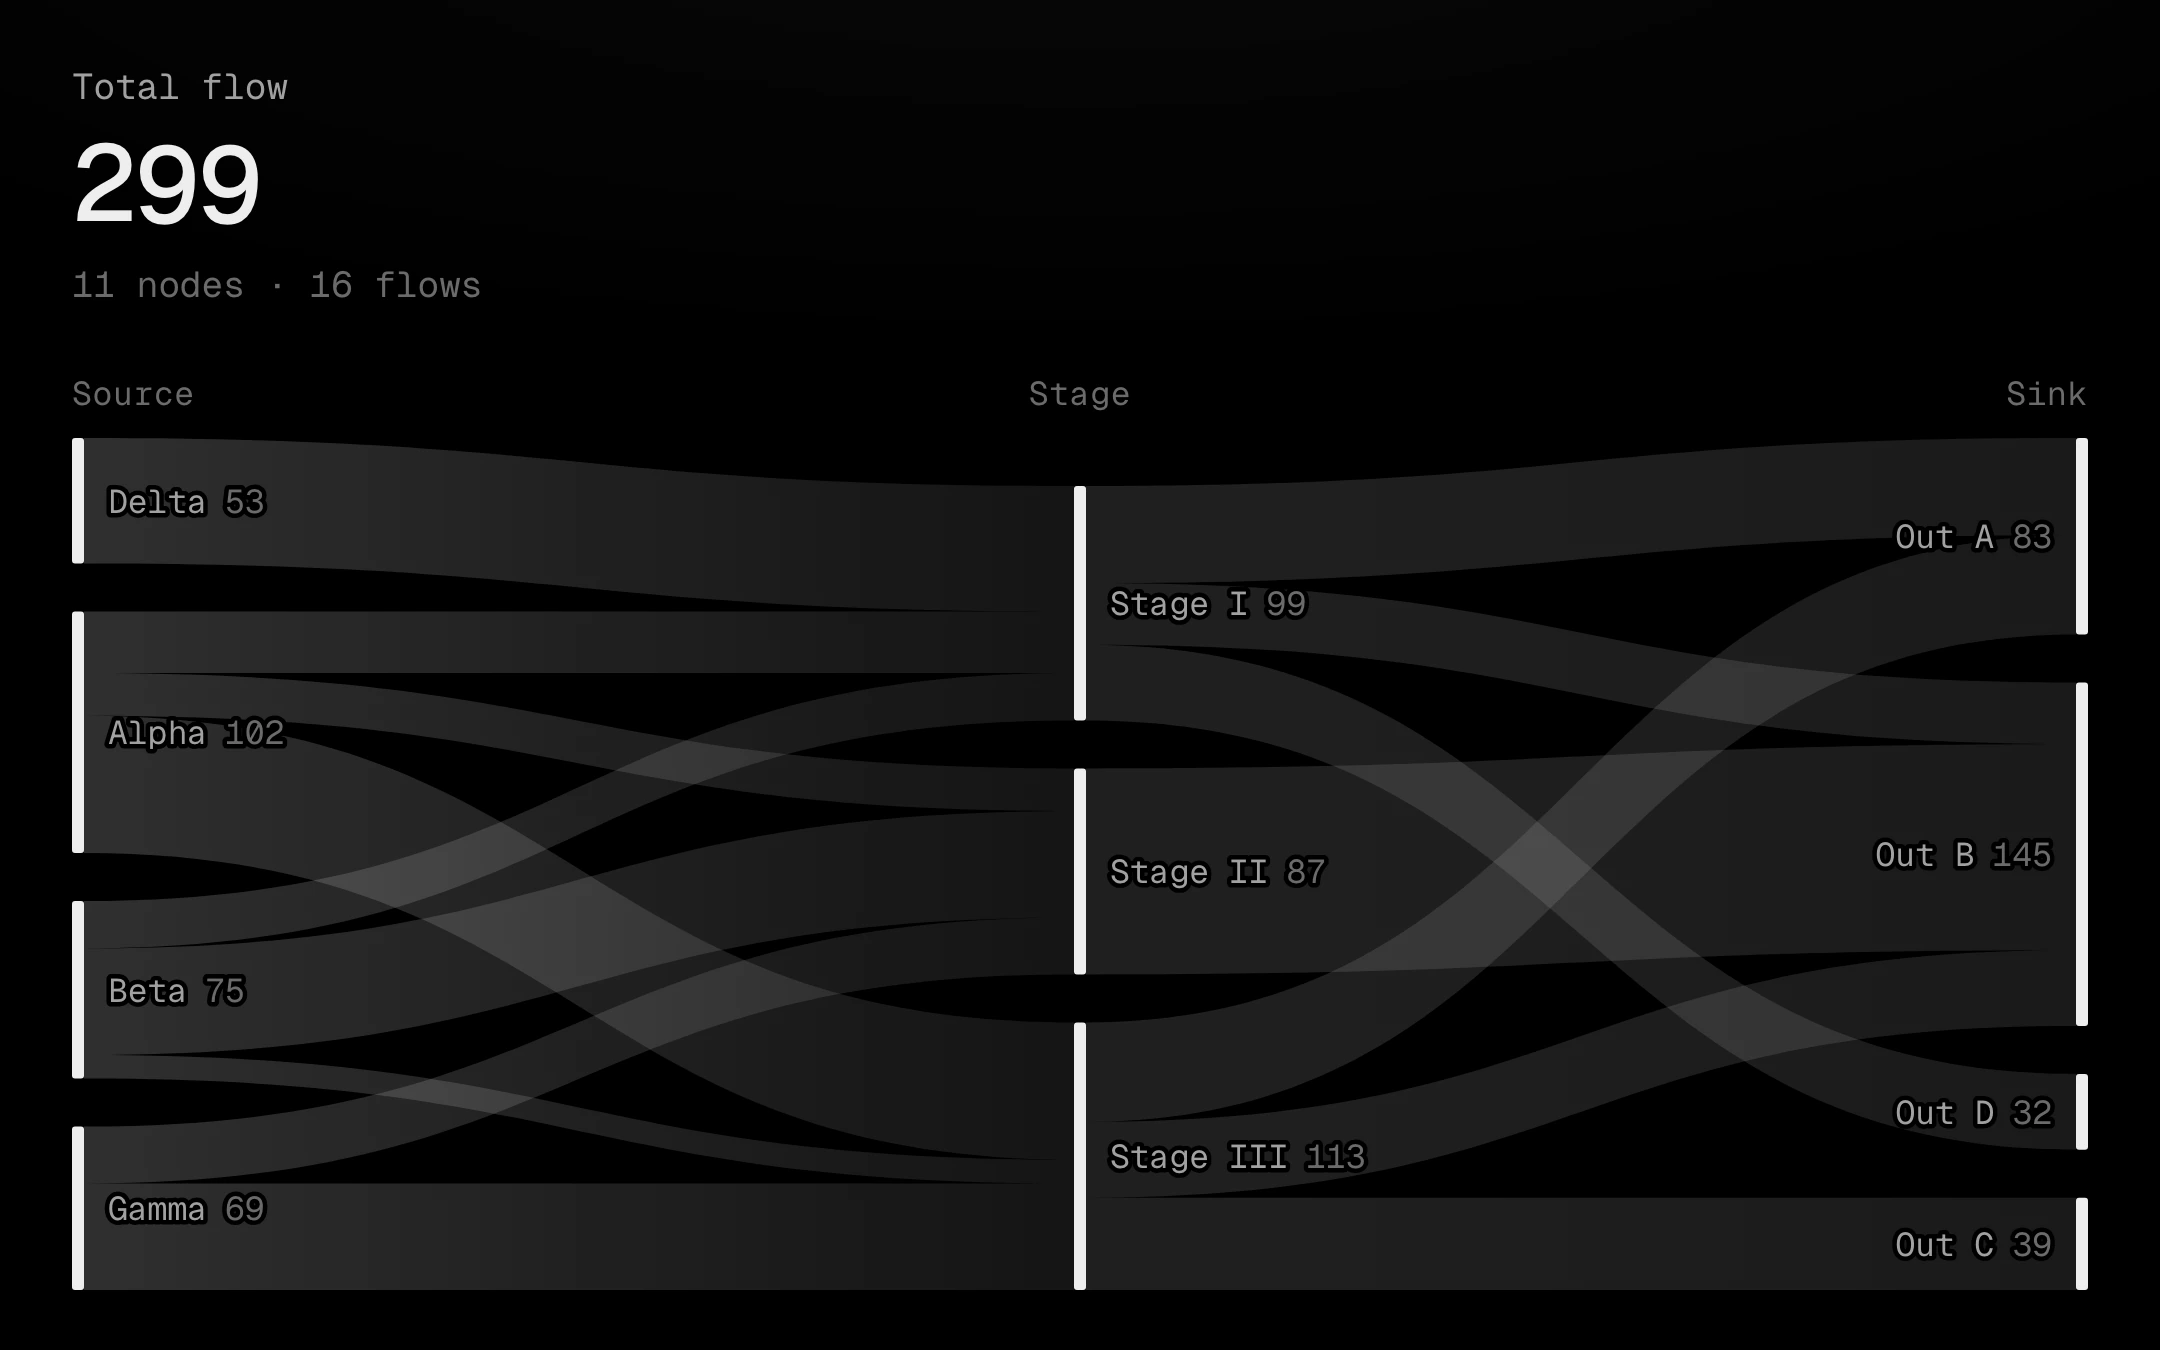
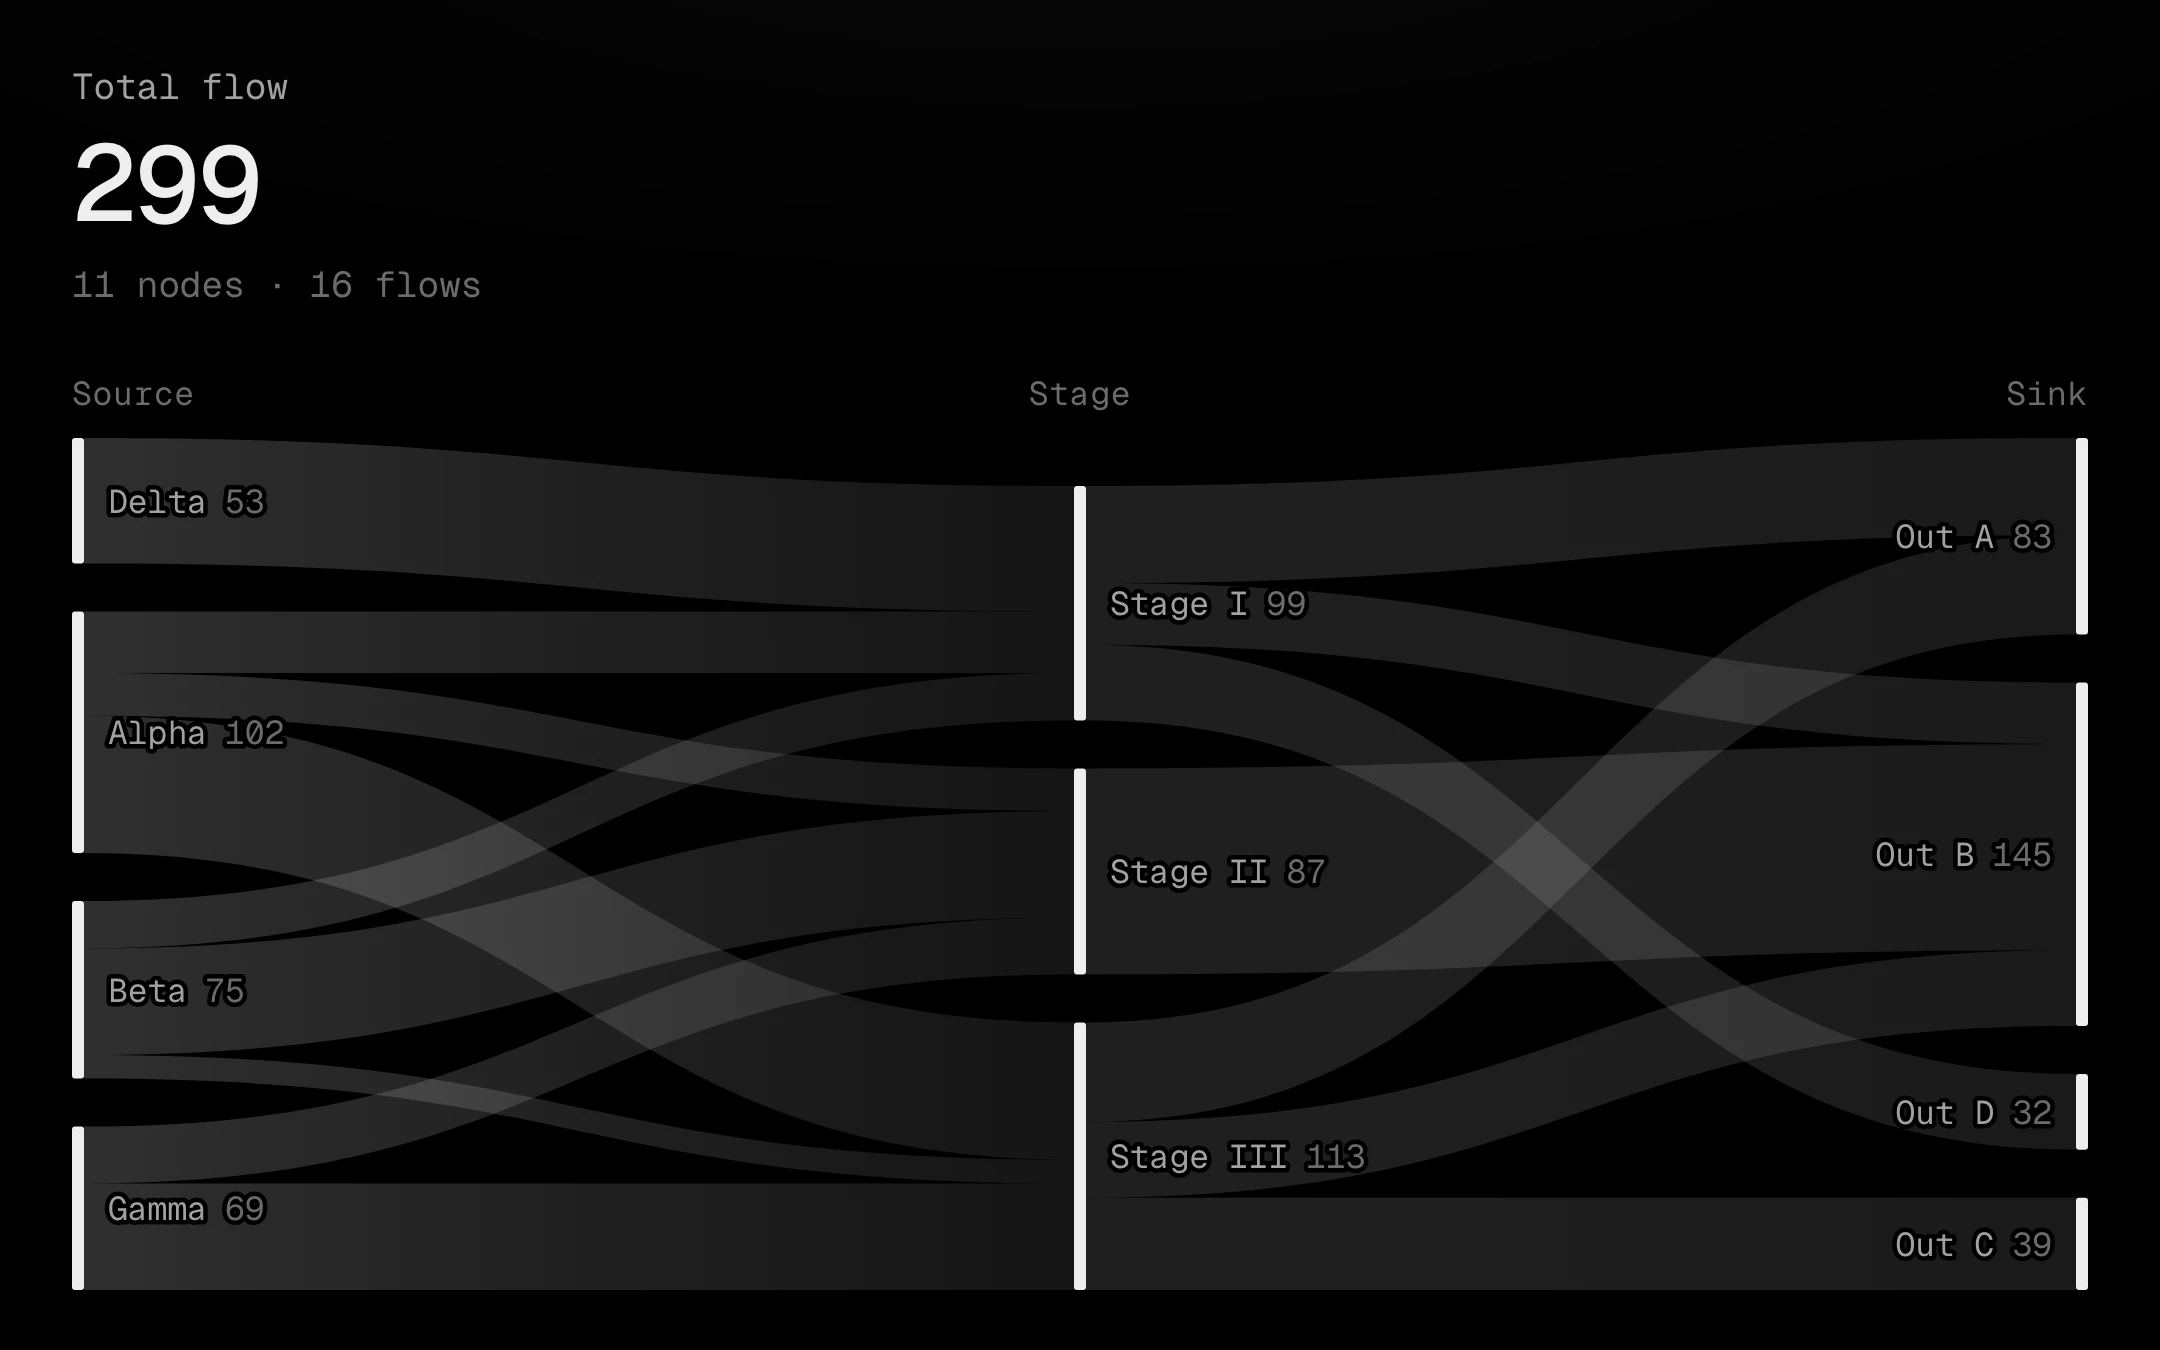
Flows between columns of thin bone bars, carried by ribbons that run as gradients from the source's grey to the target's.
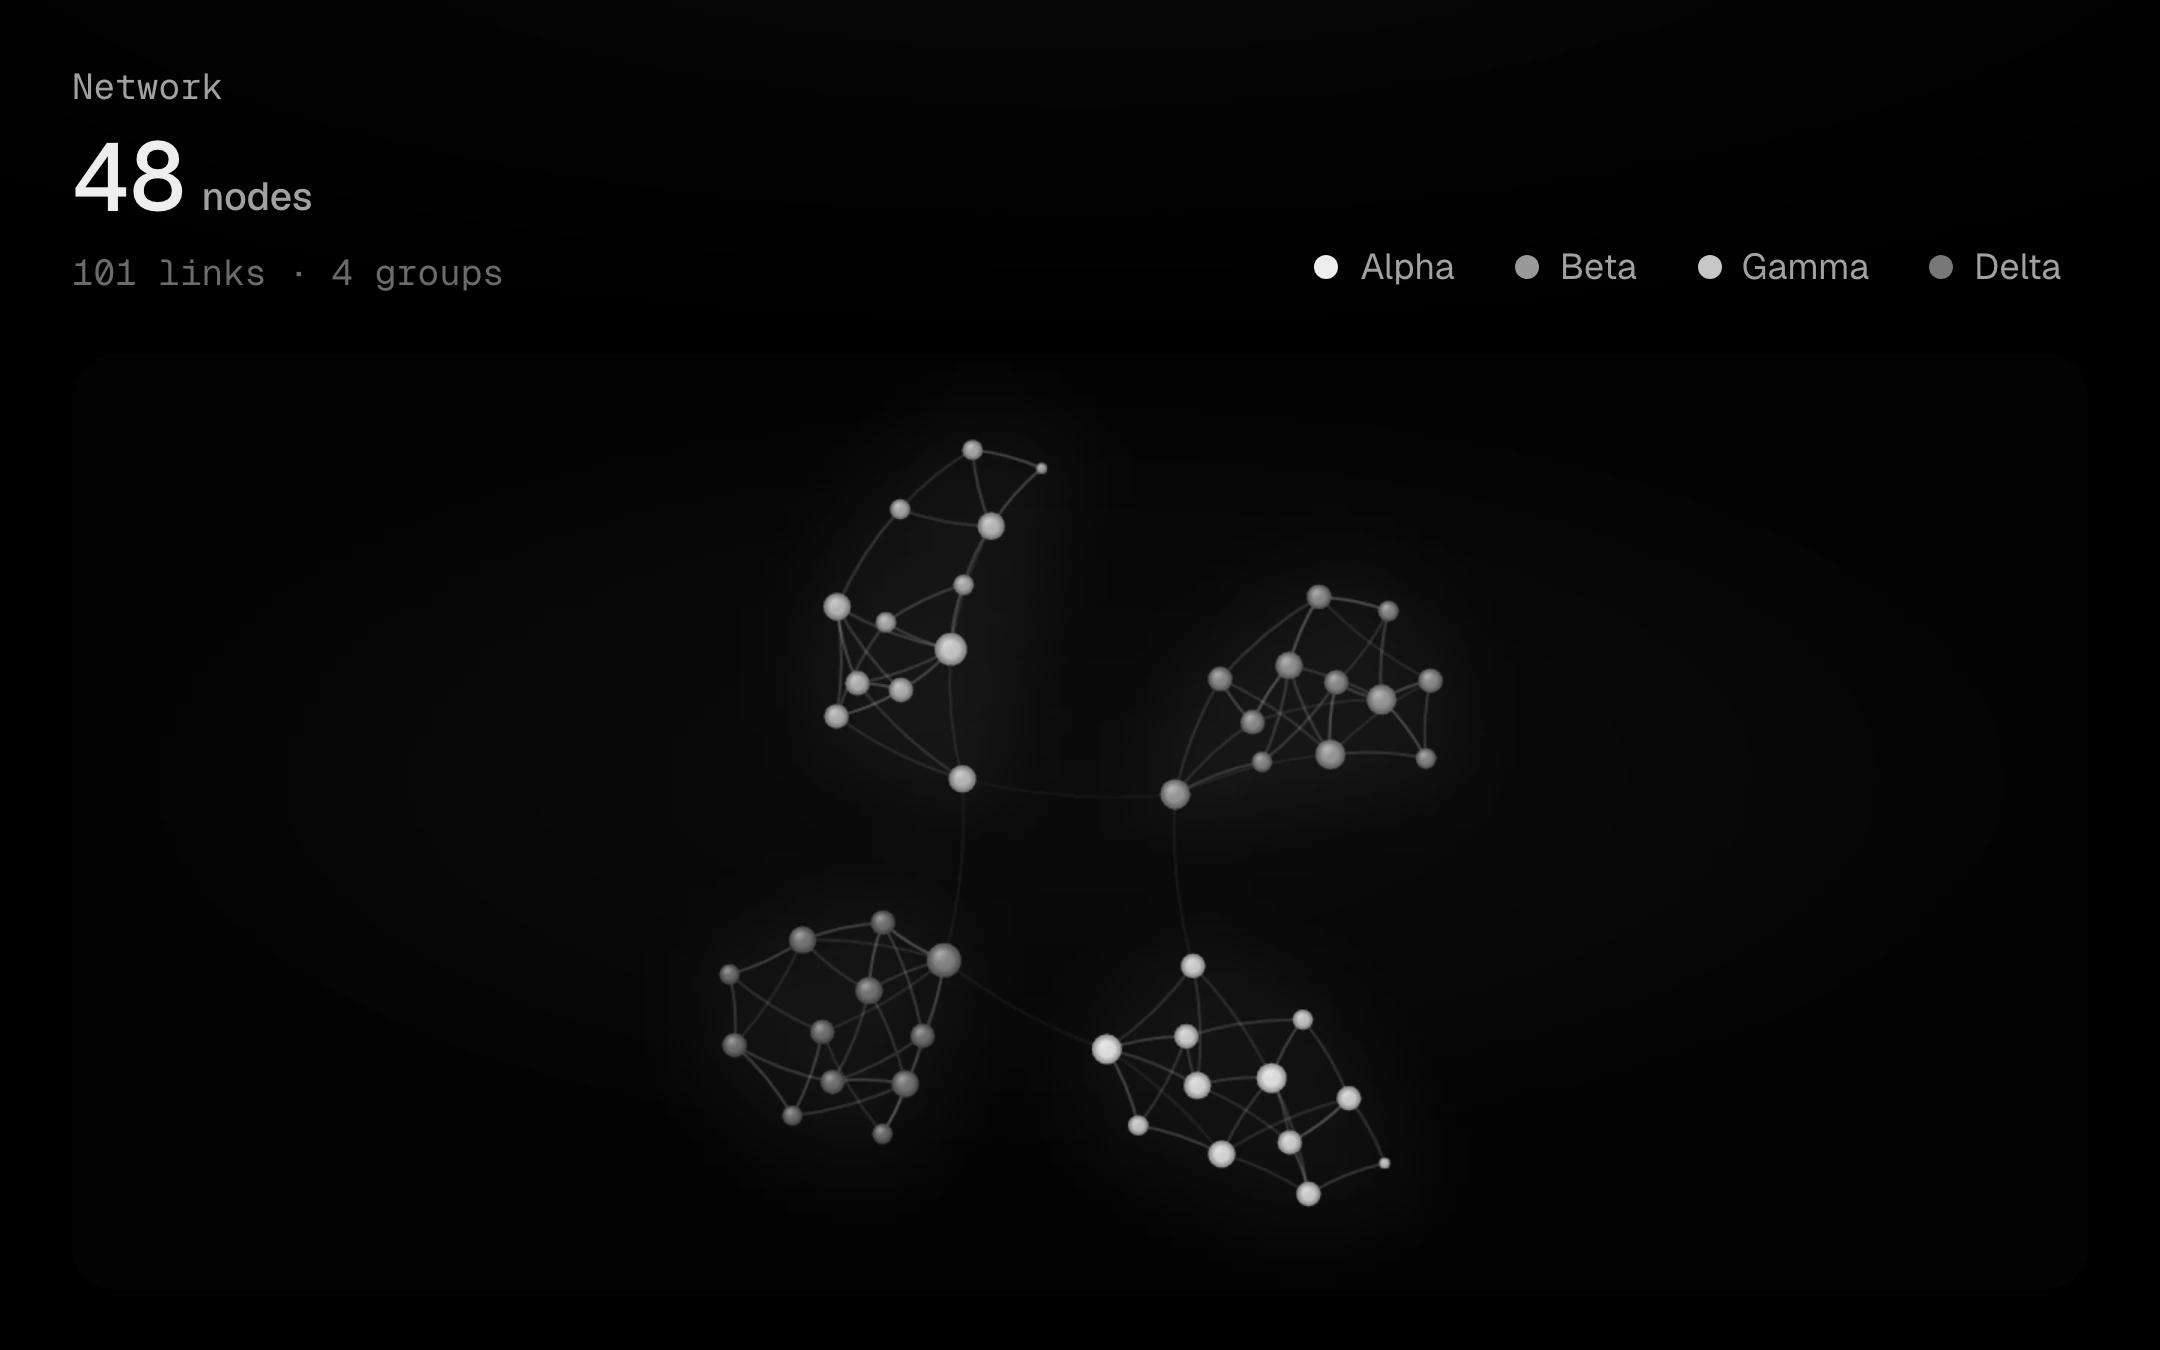
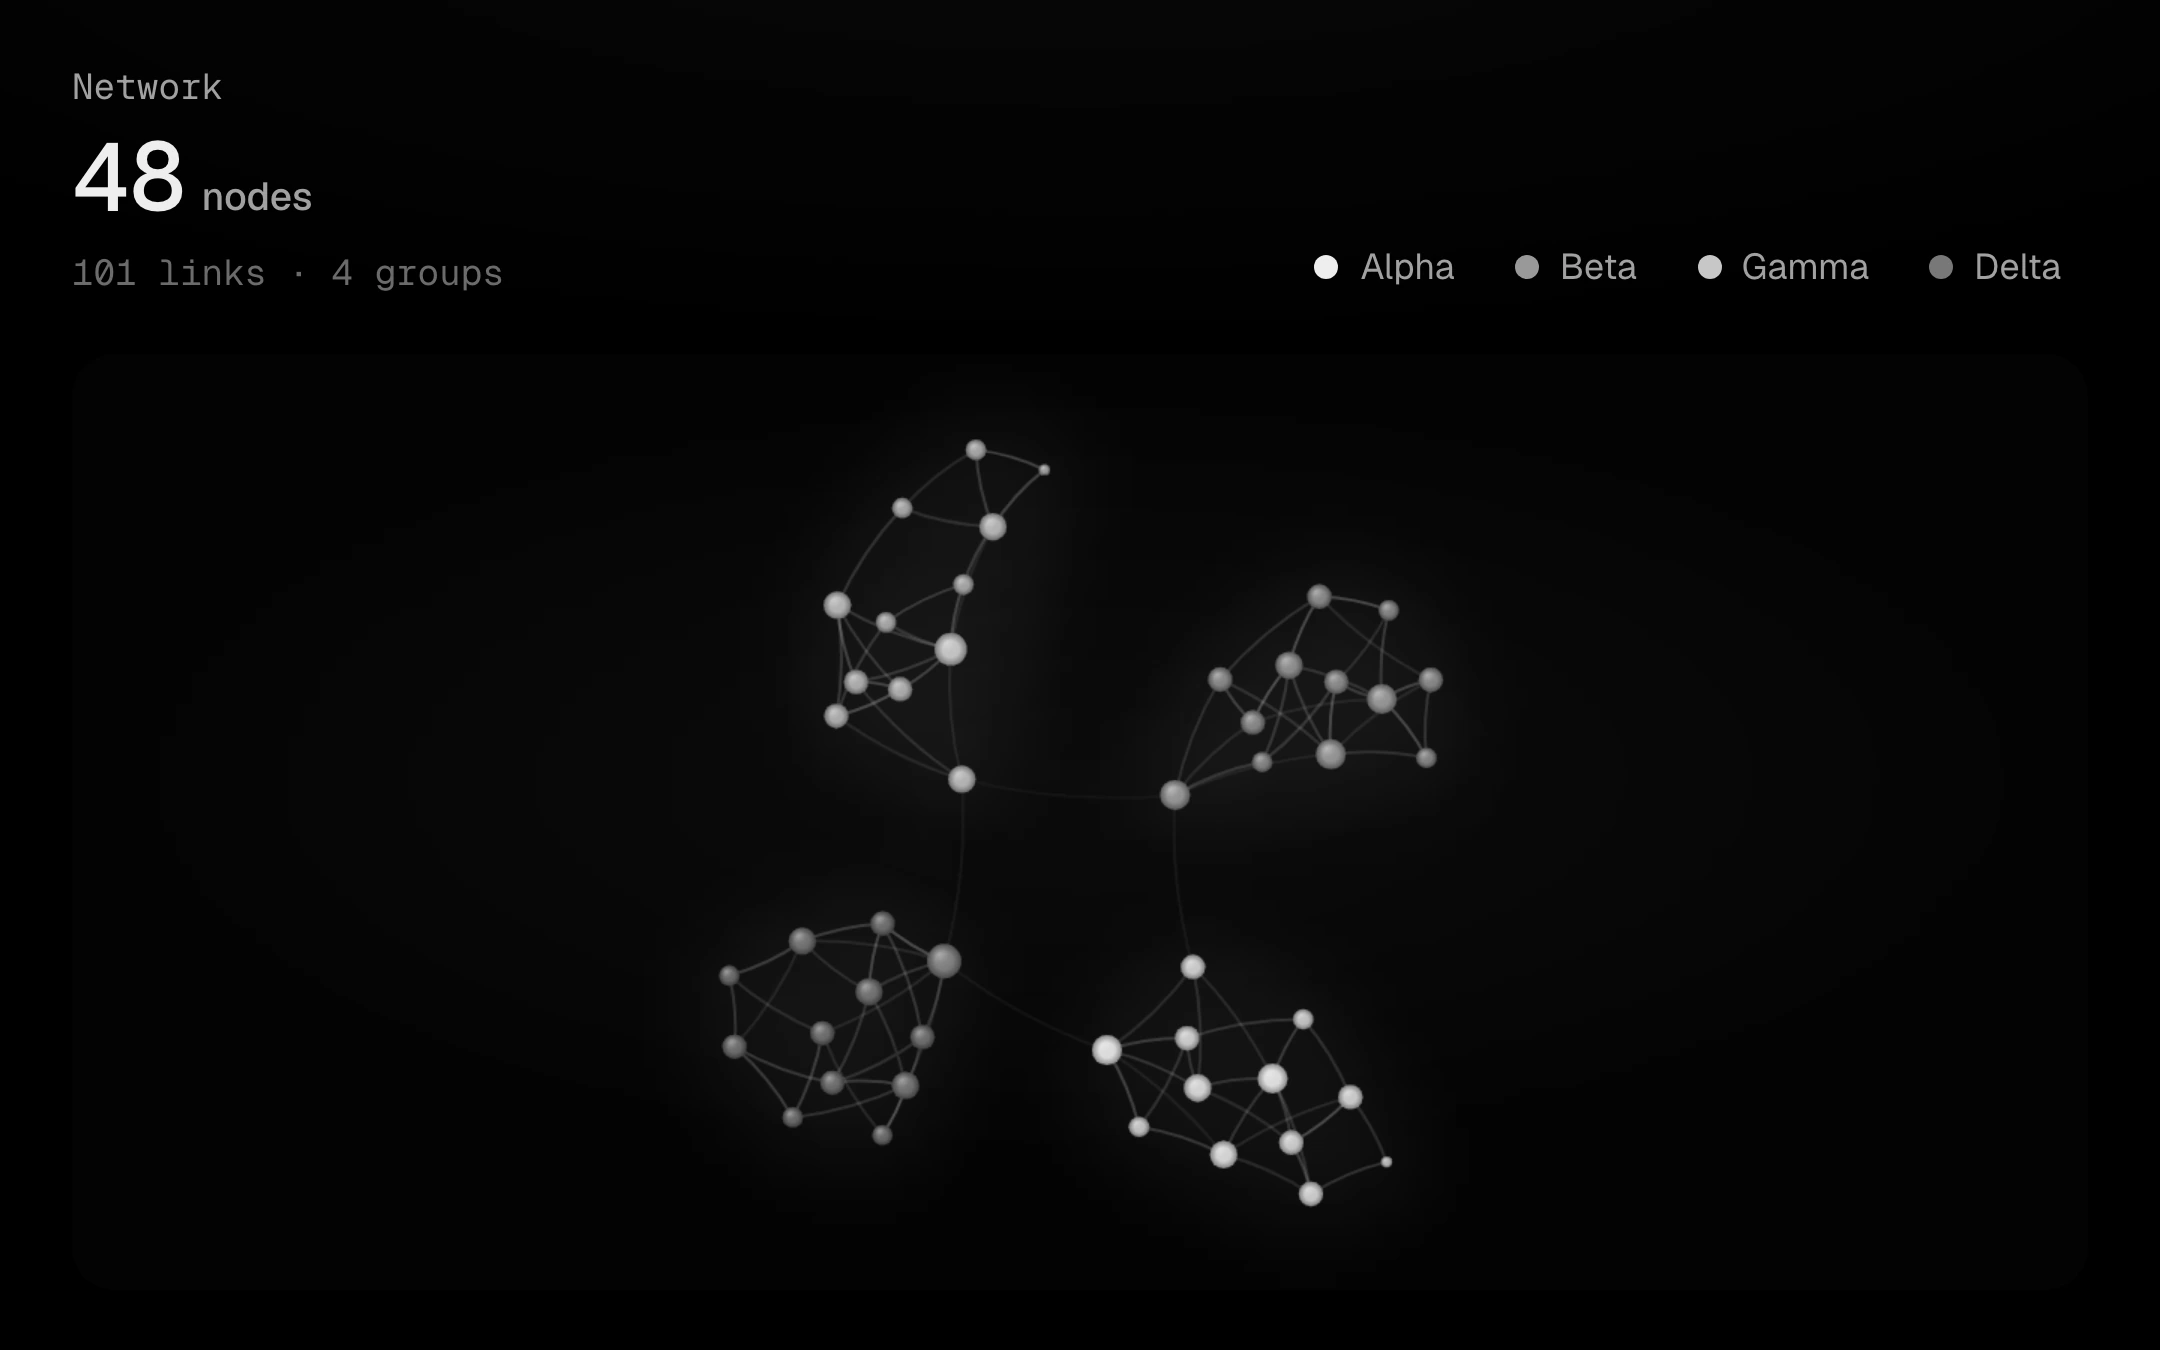
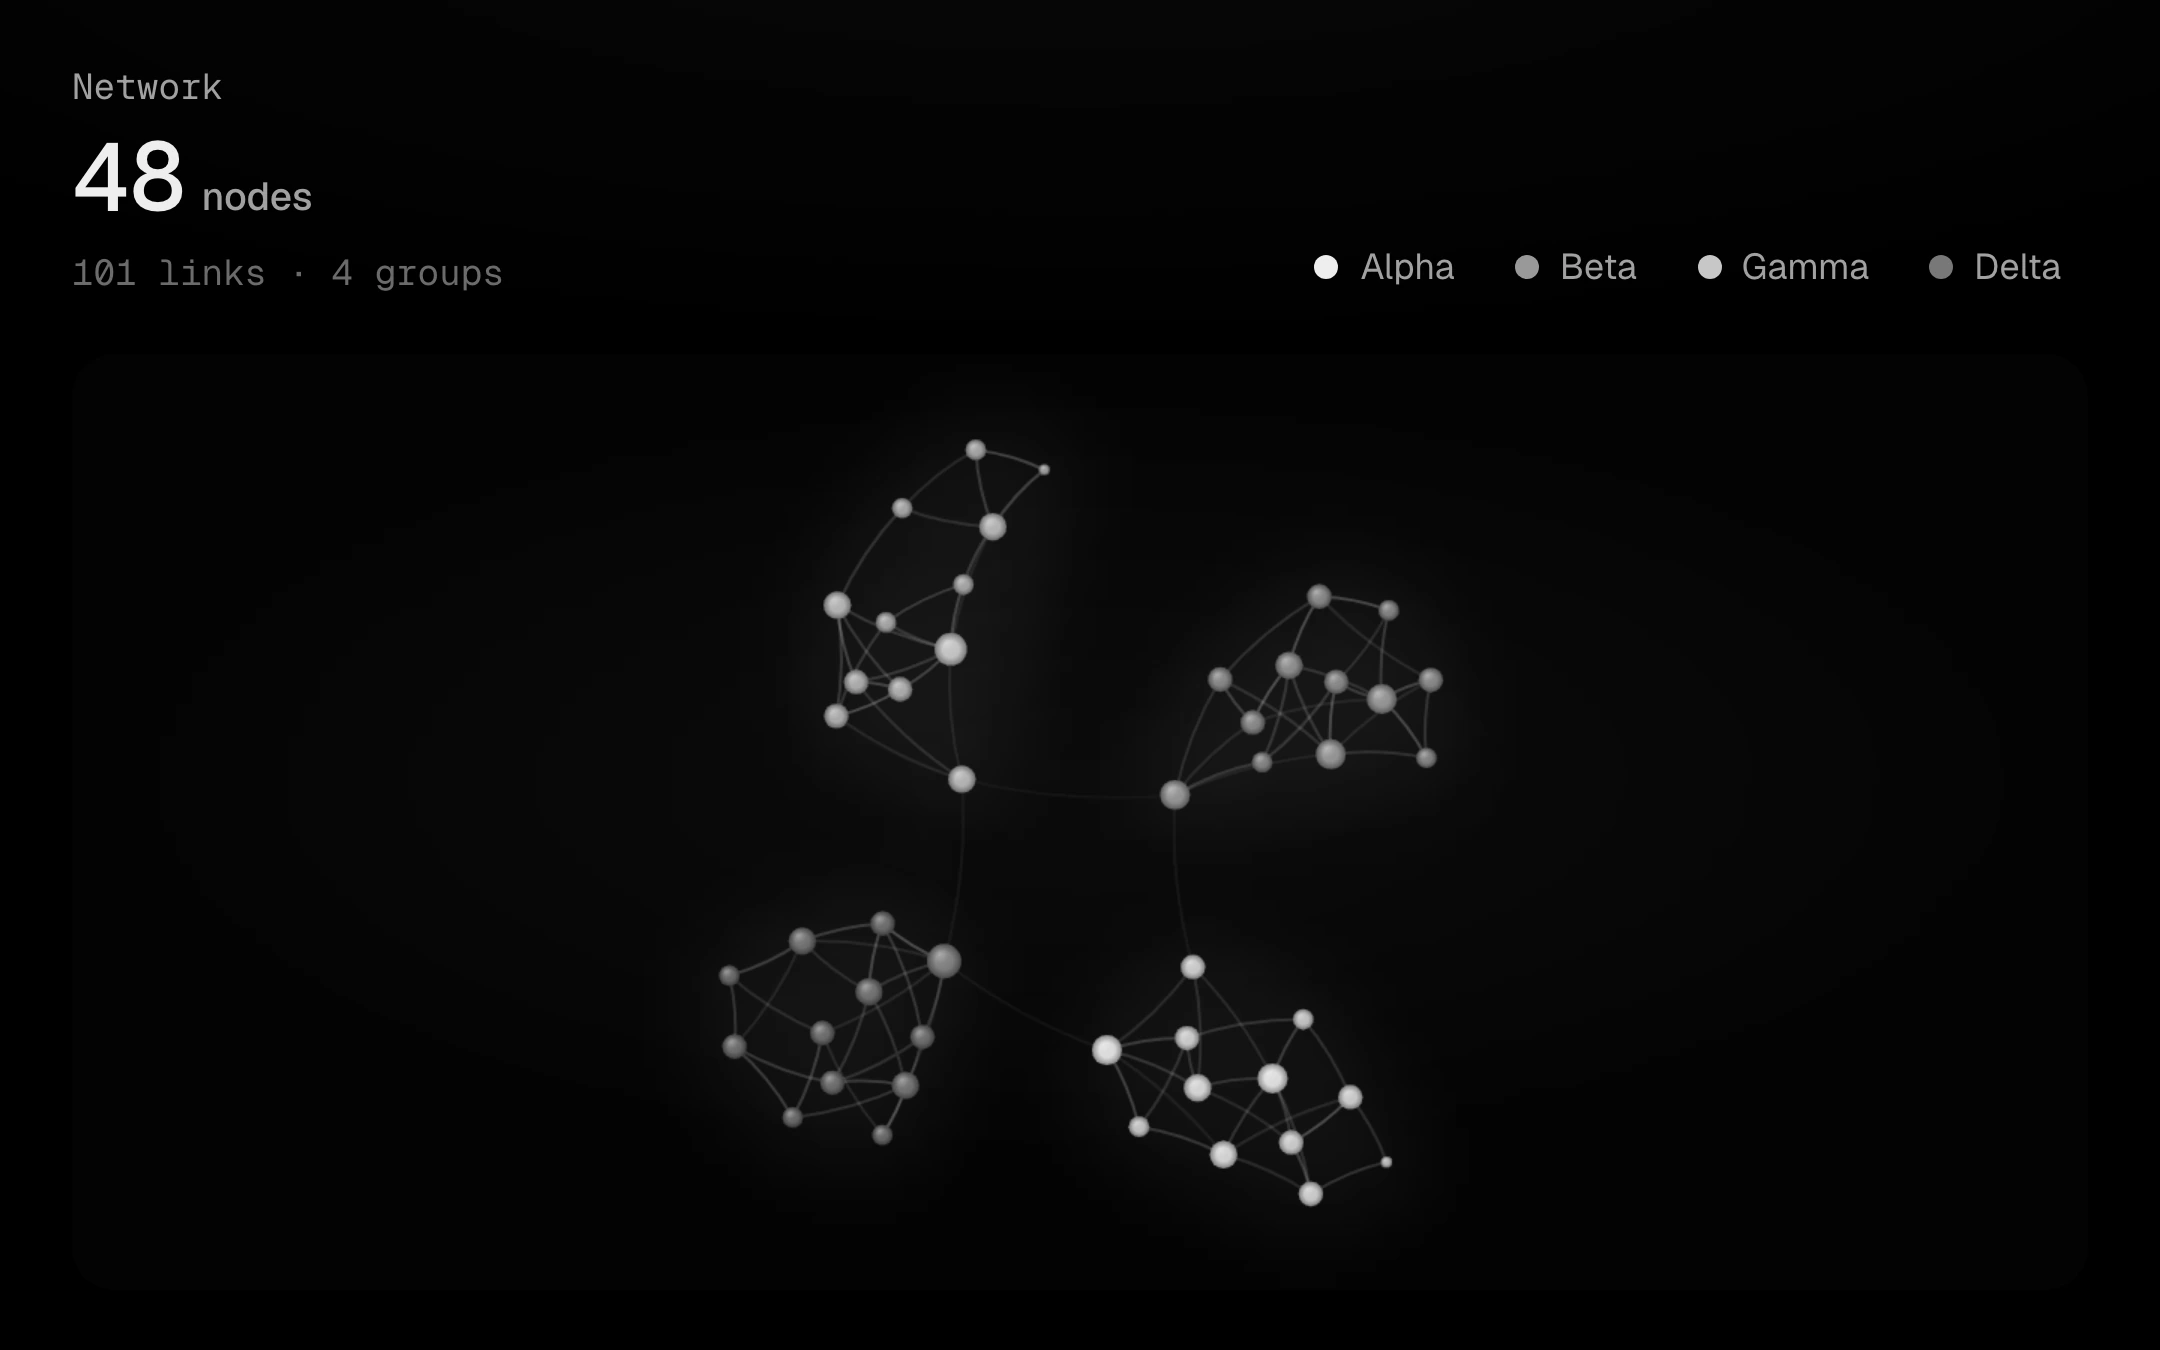
A force-directed graph on one canvas that cools to rest: nodes sized by their links under a soft top light, gently arced links that fade with length and weight, and a faint filled blob behind each group.
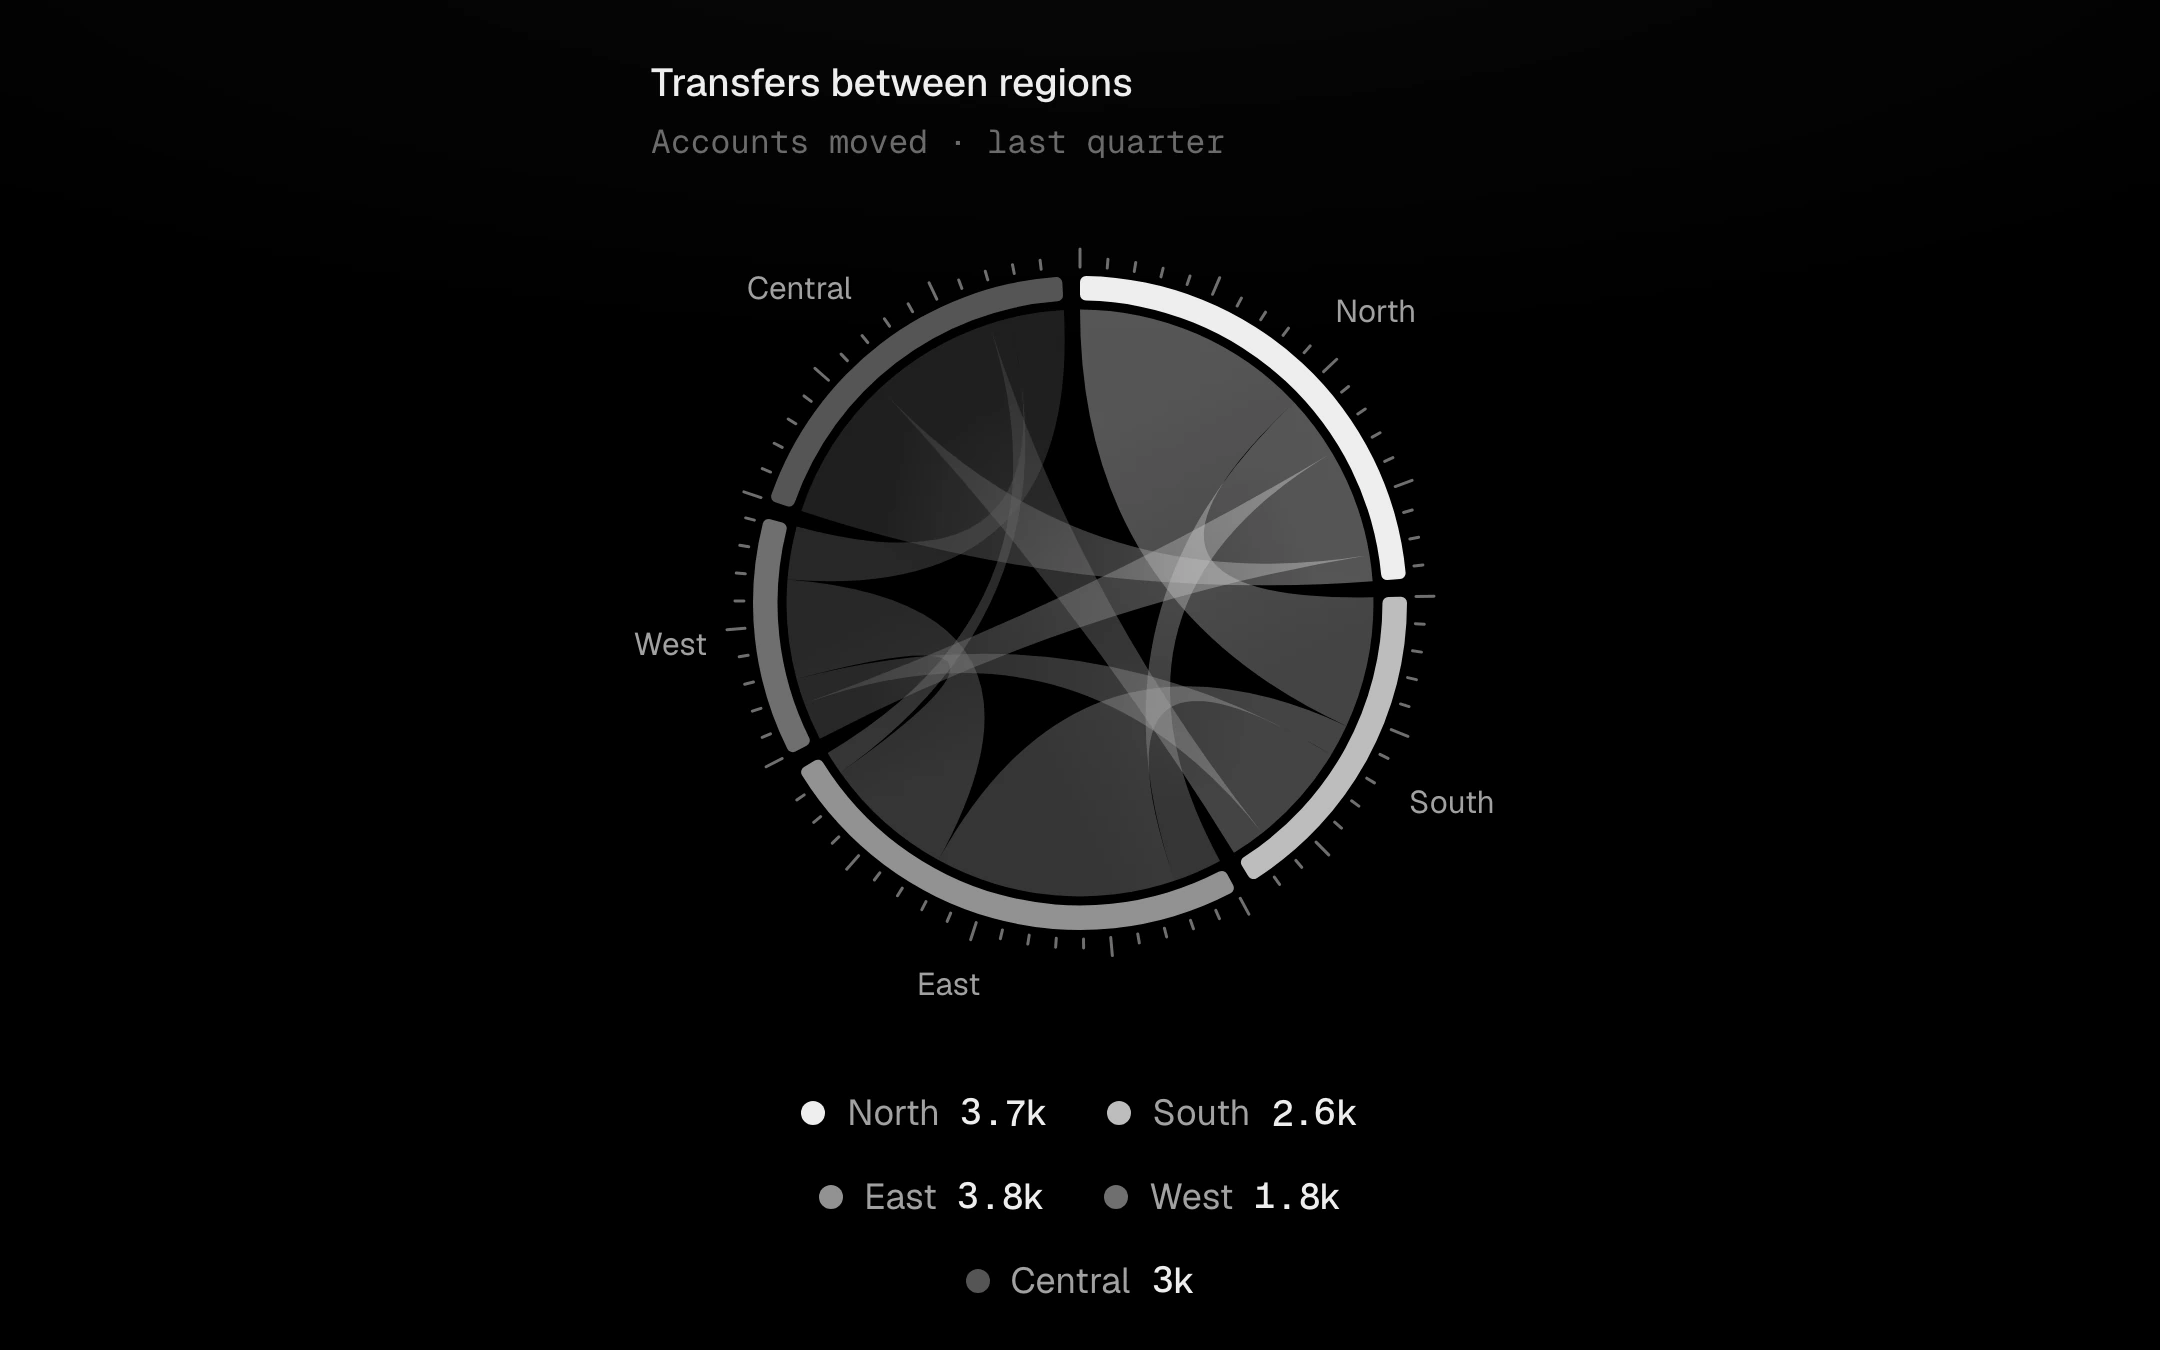
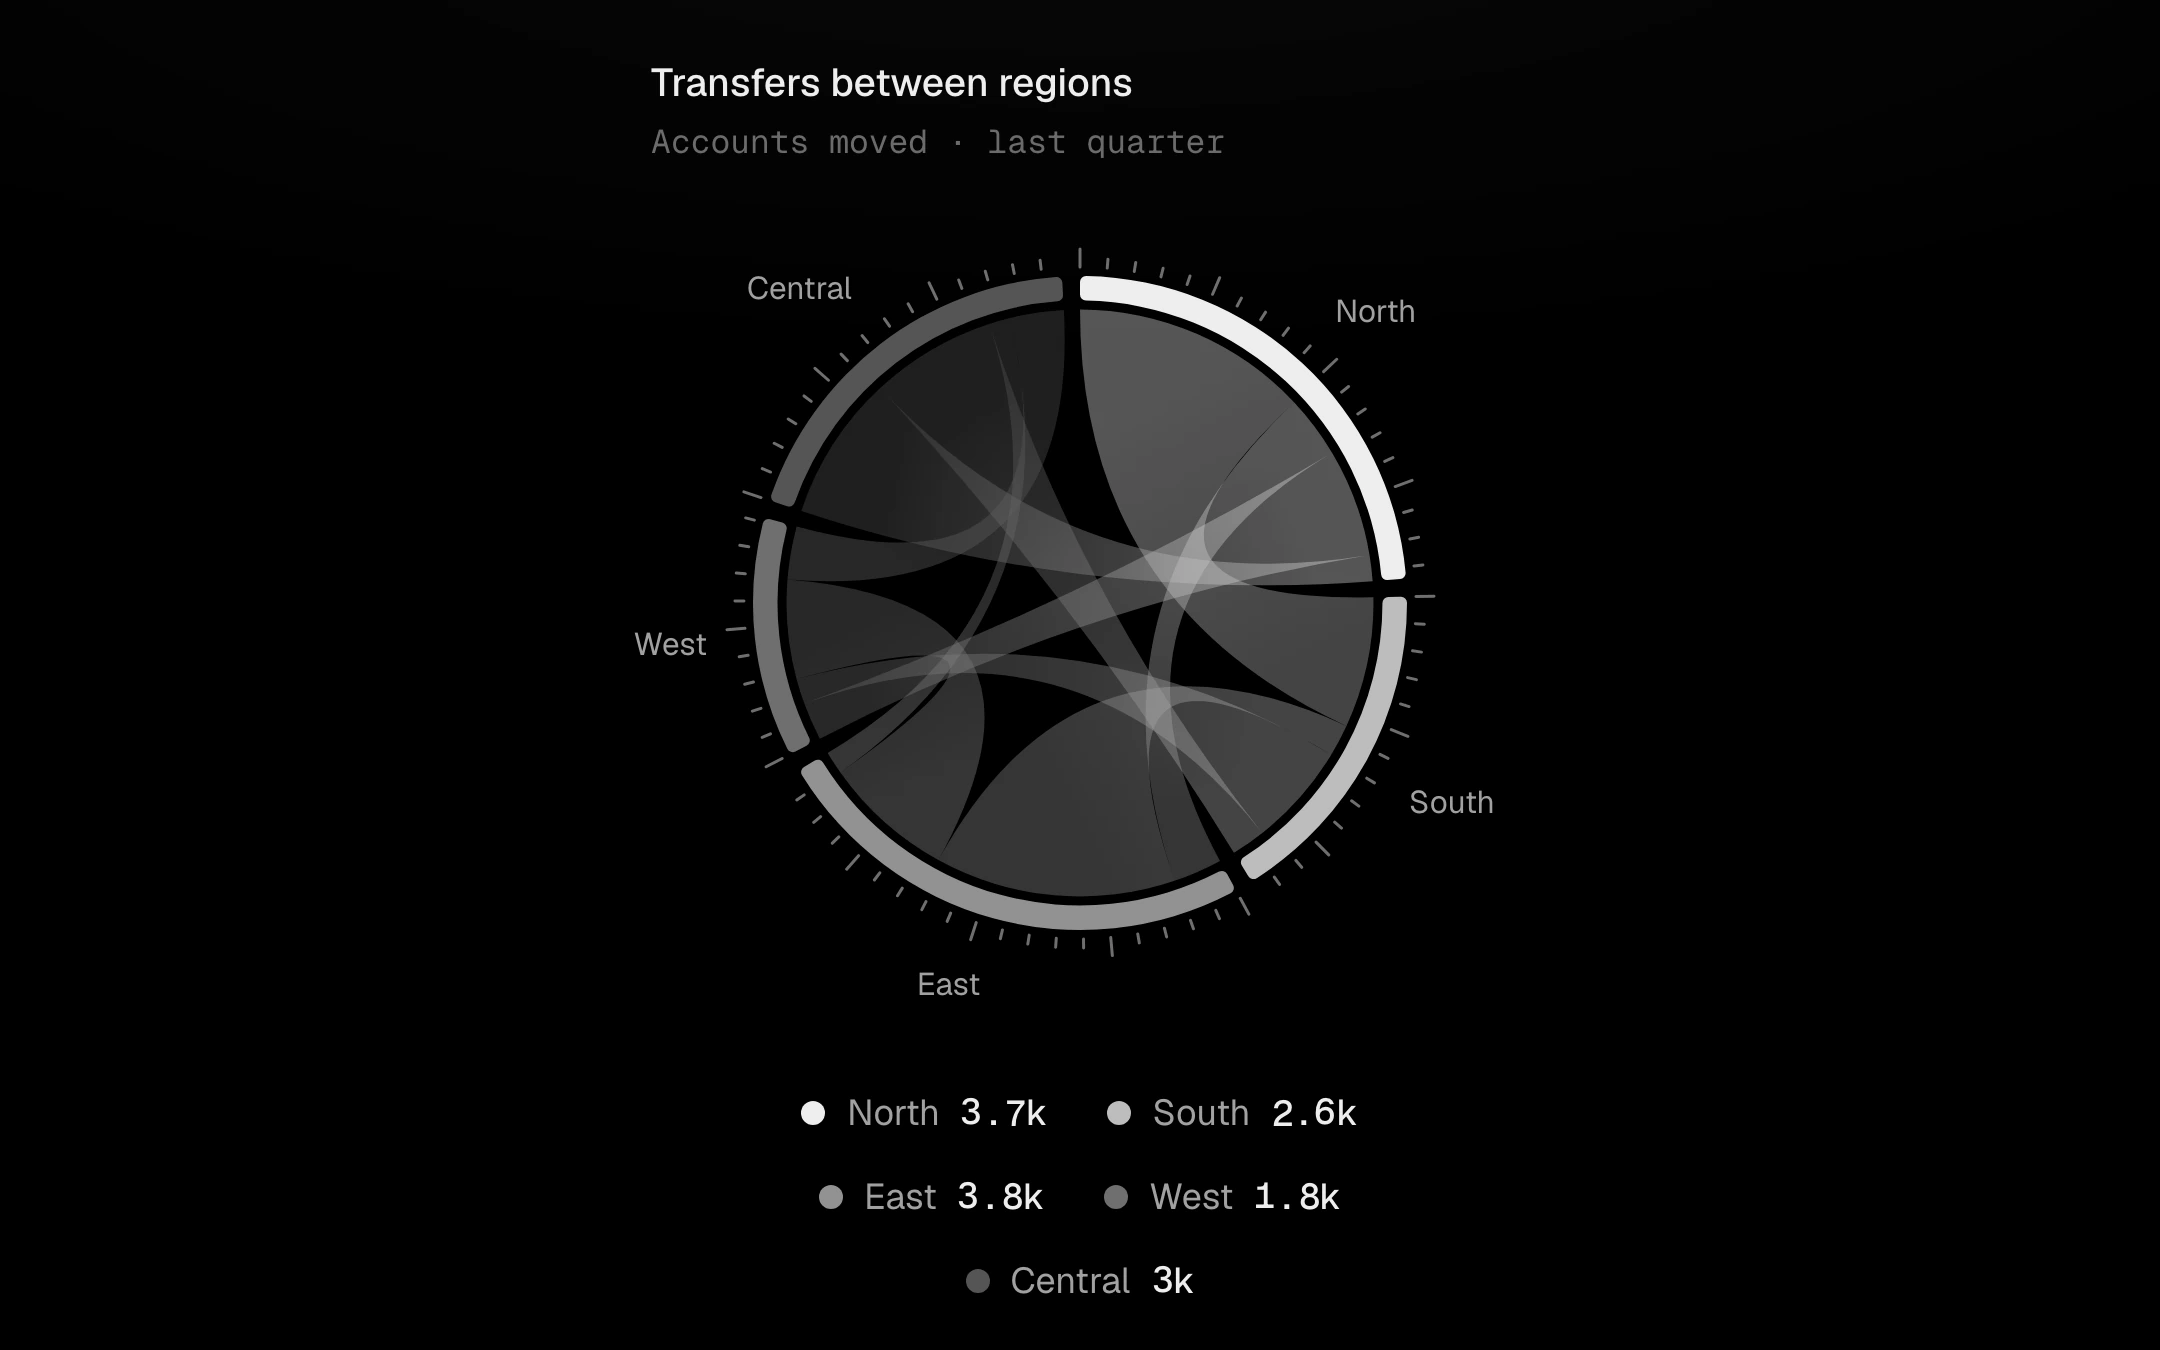
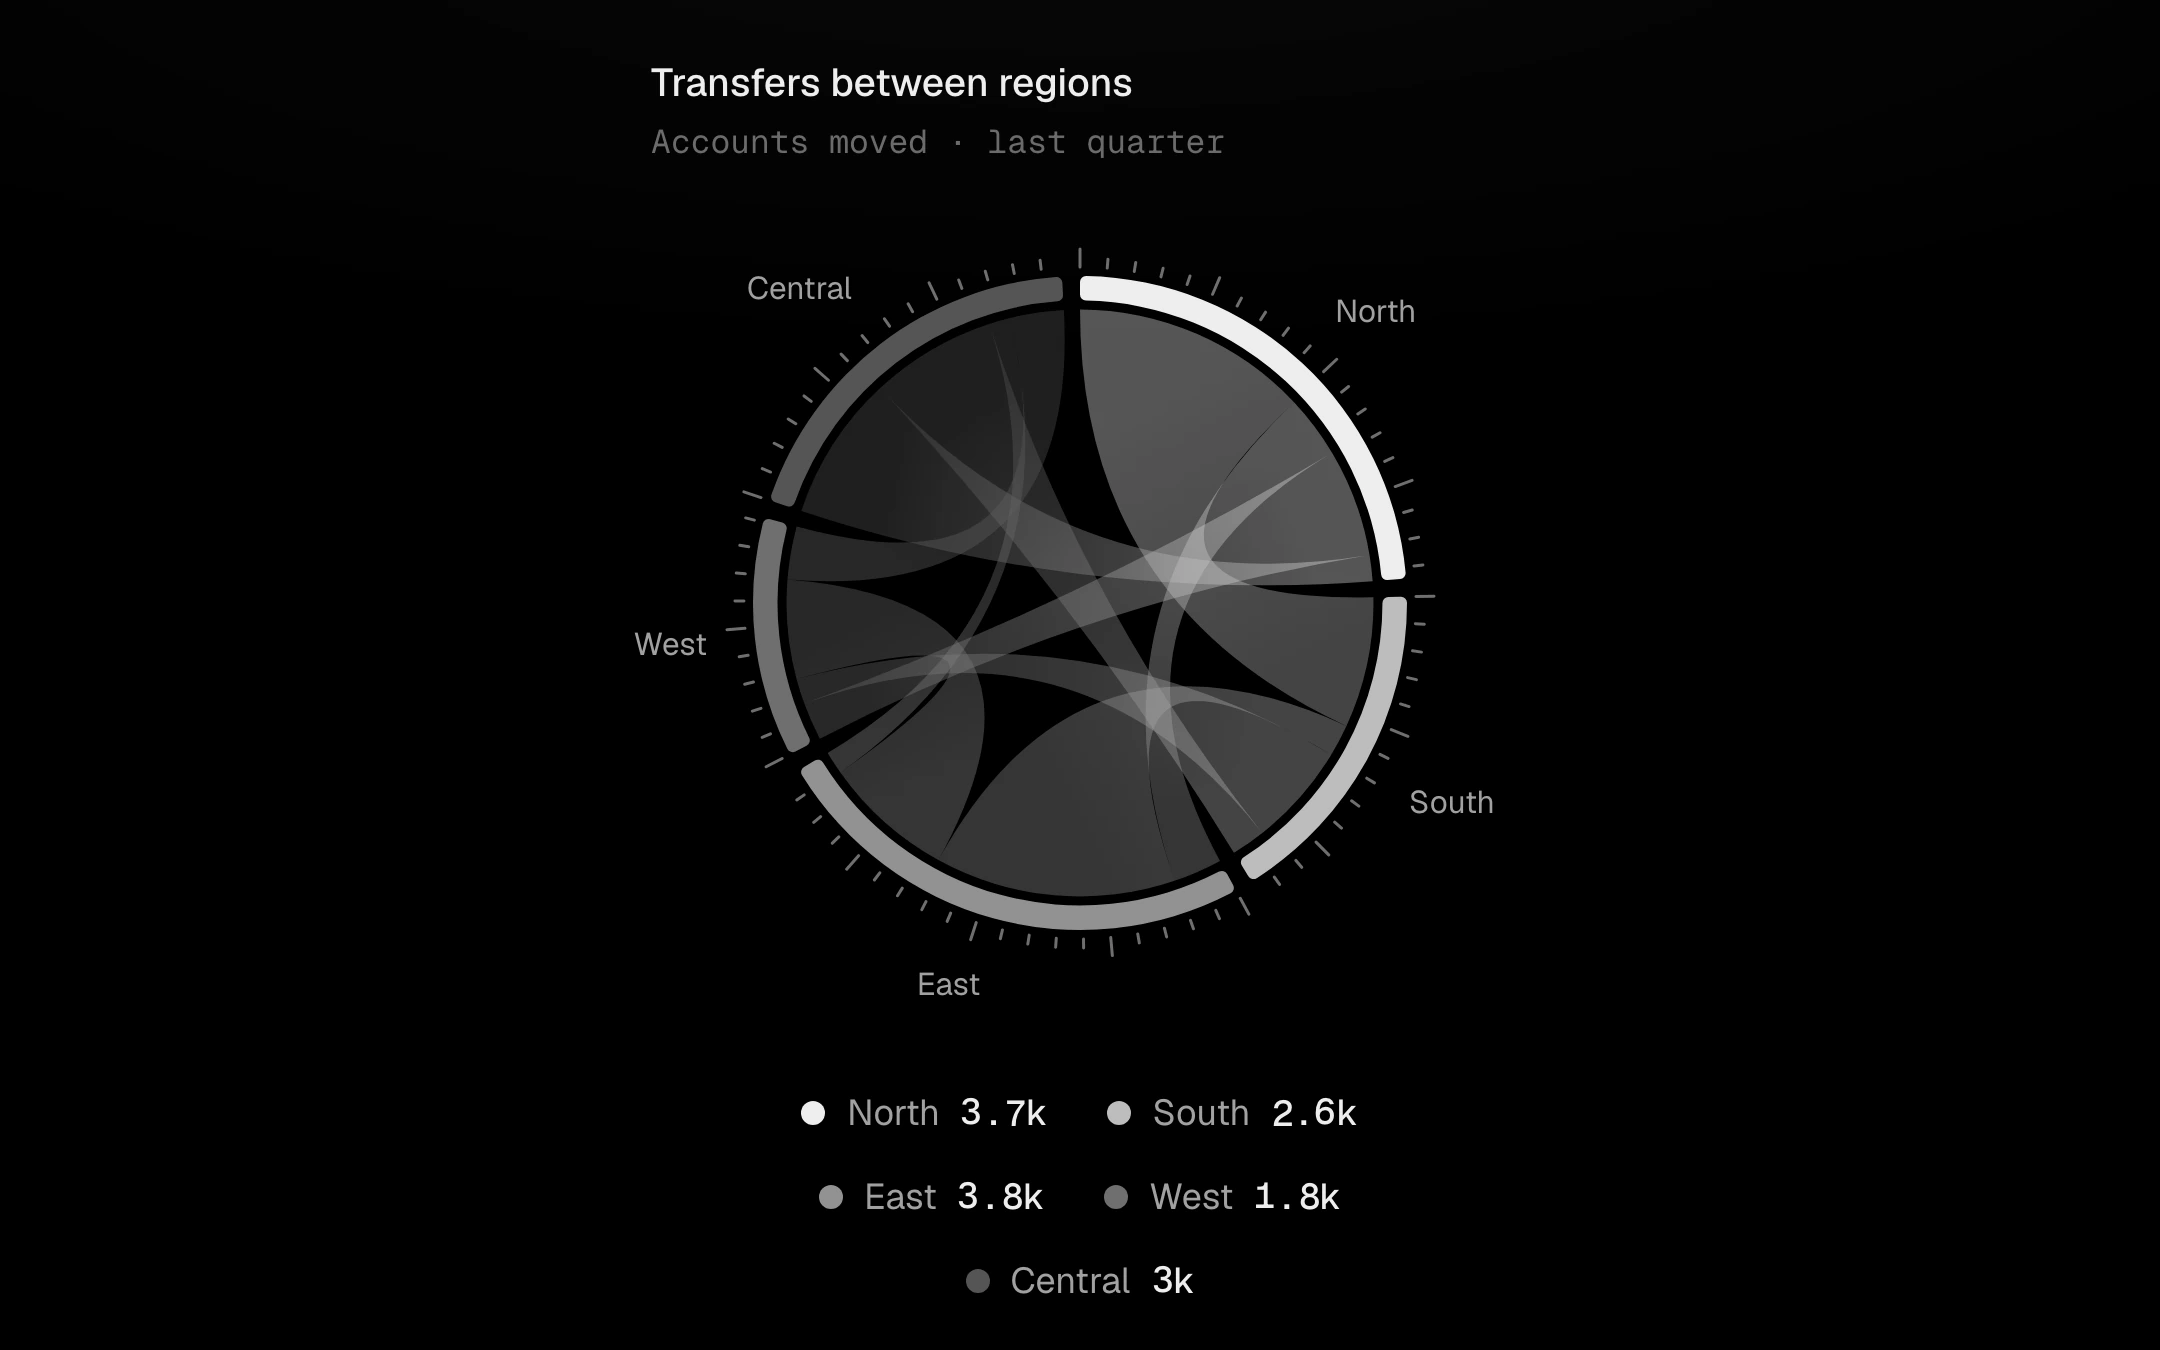
Flows between groups around a circle.
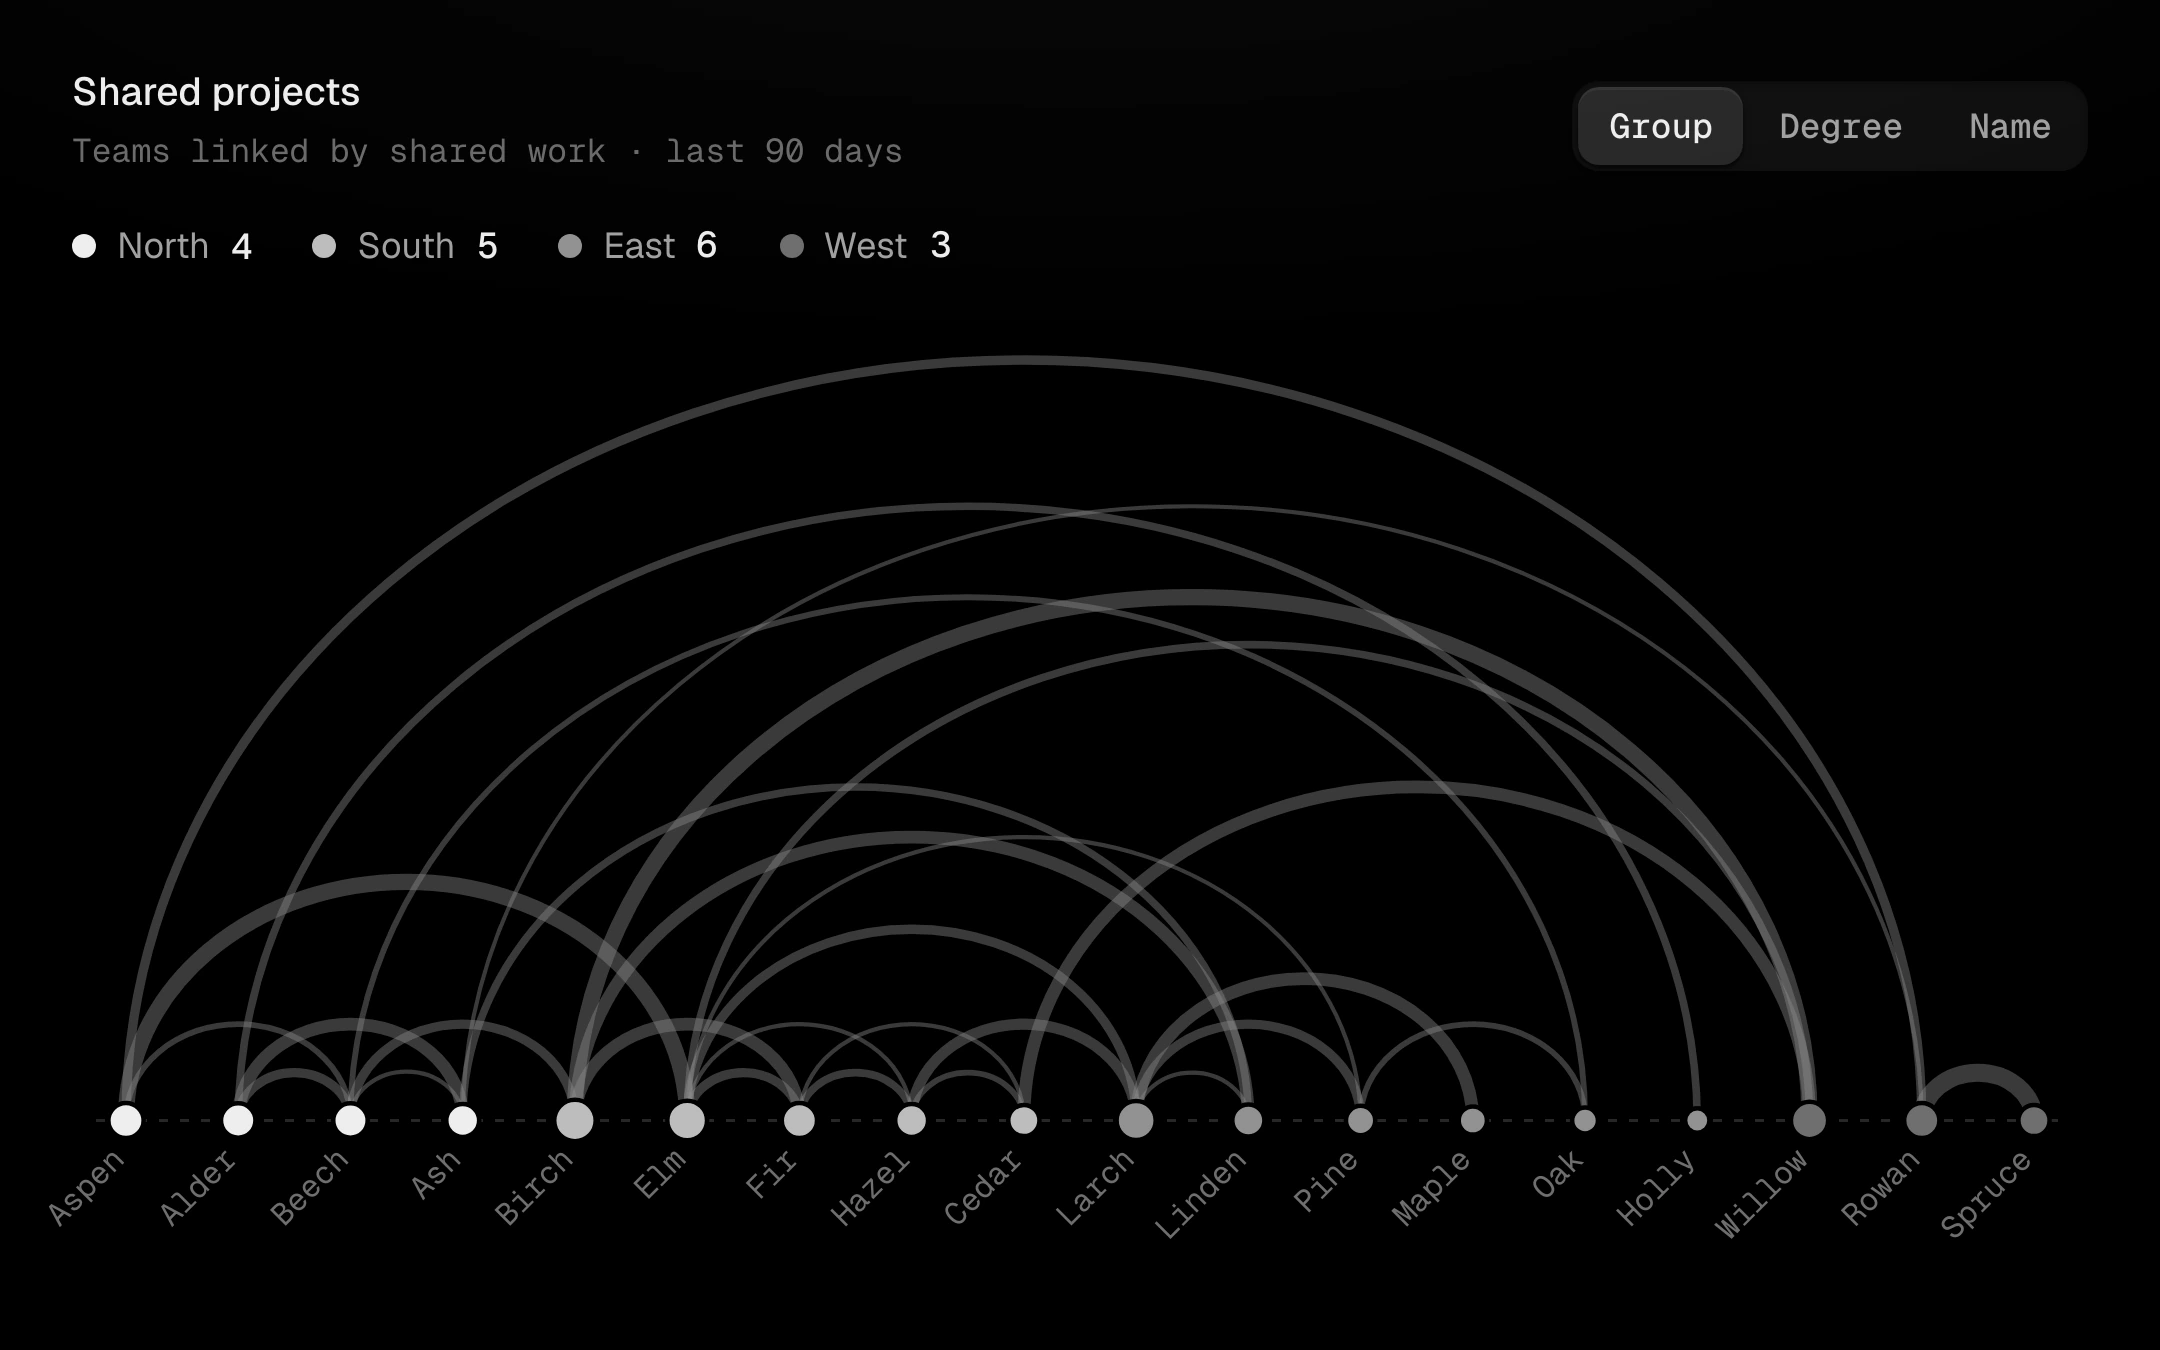
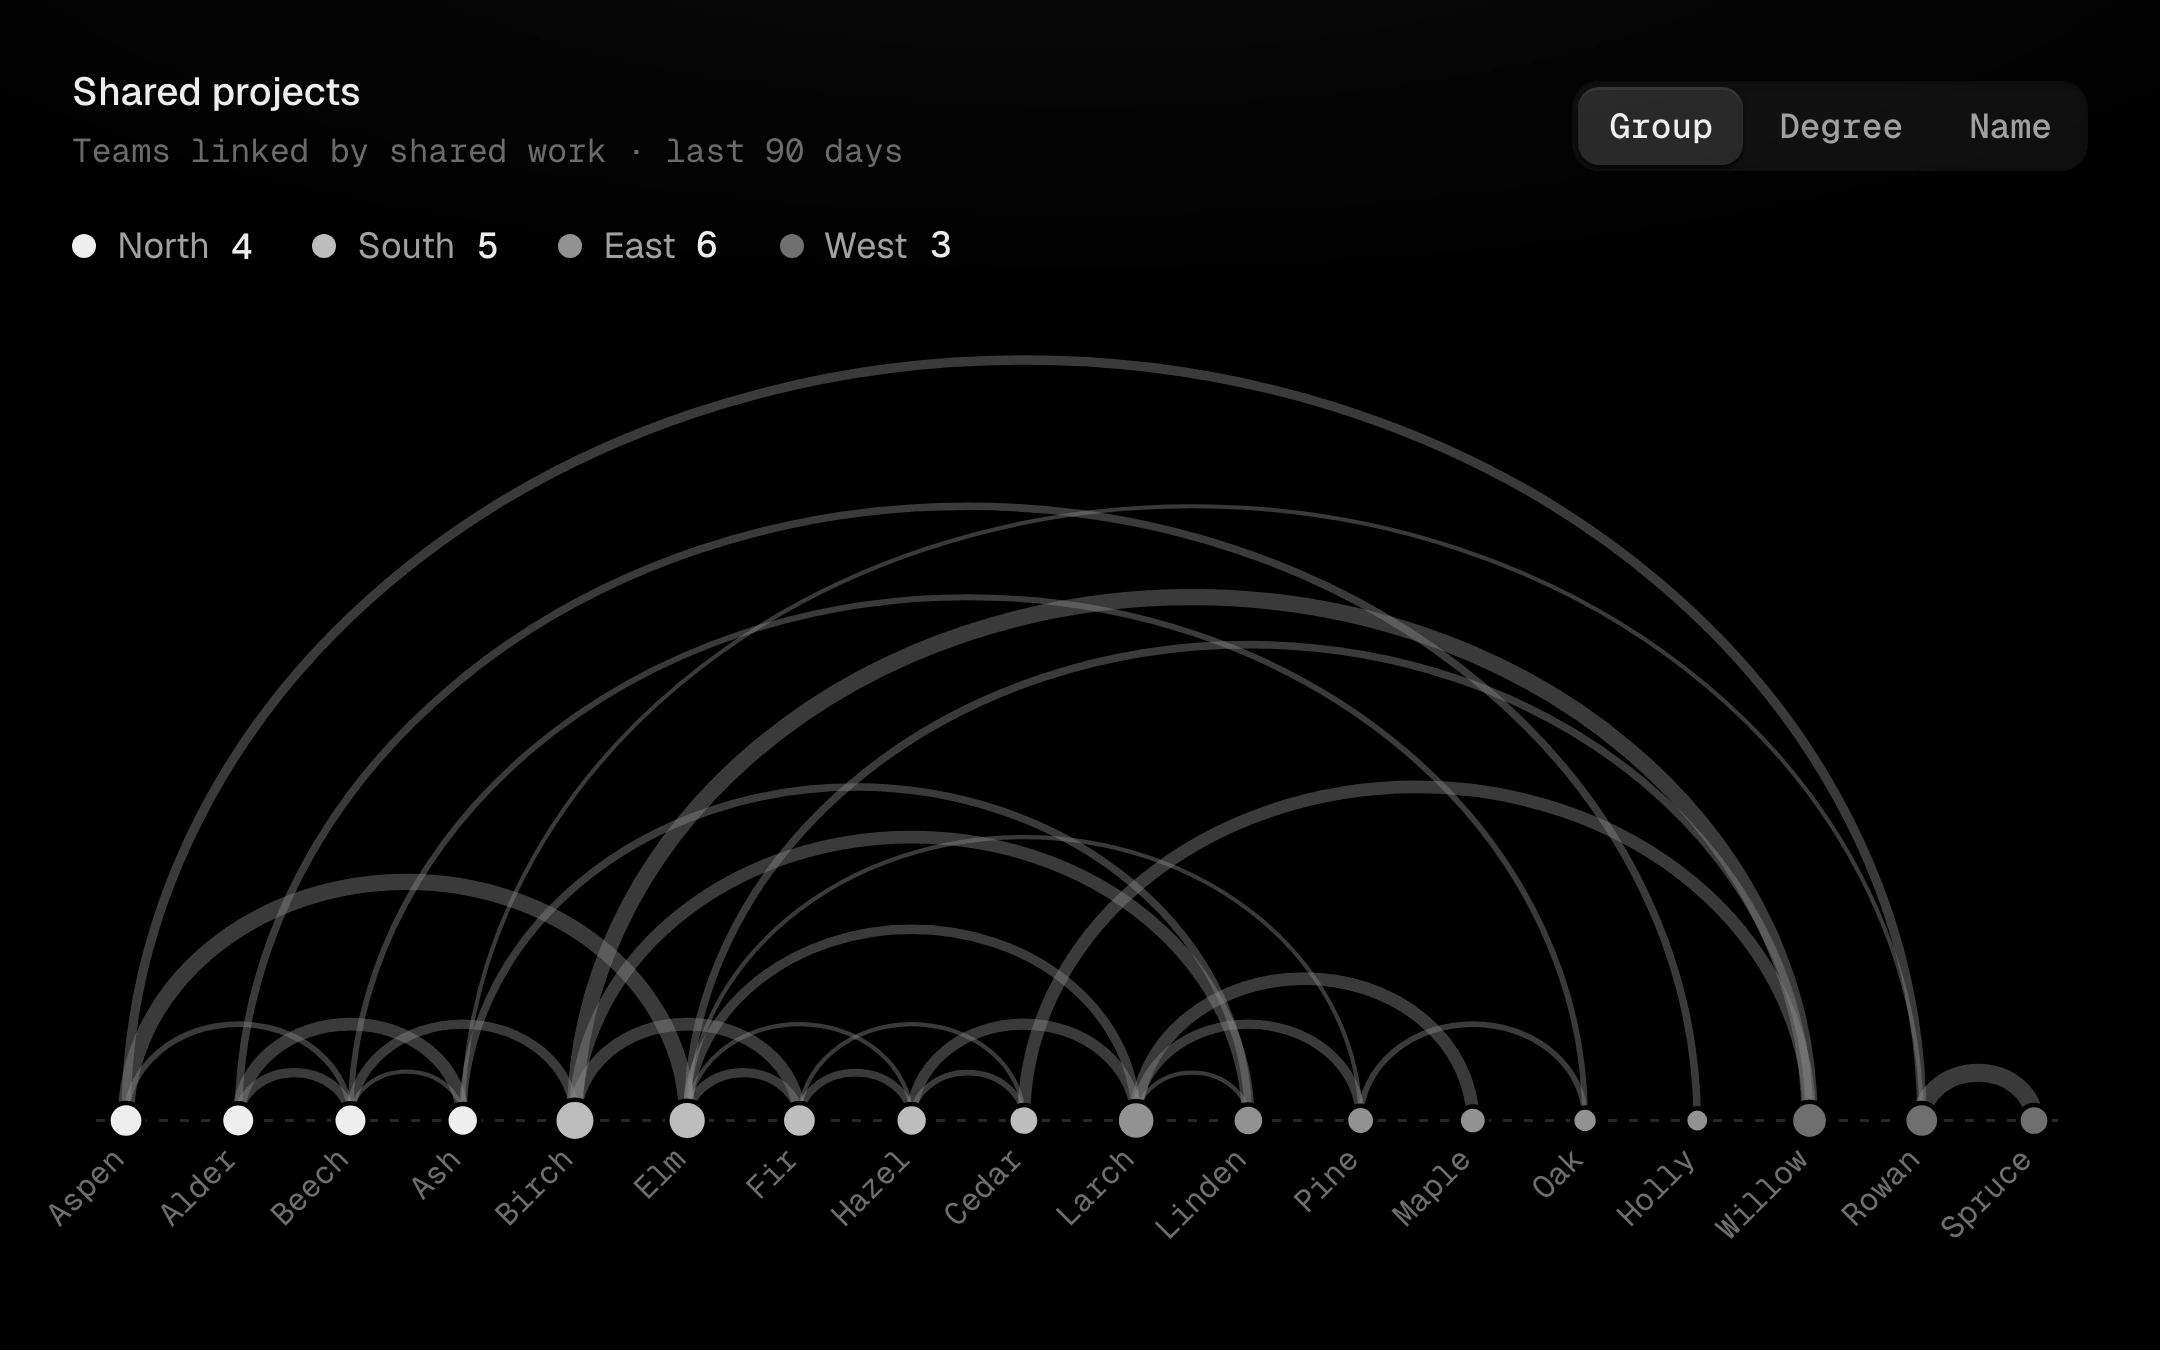
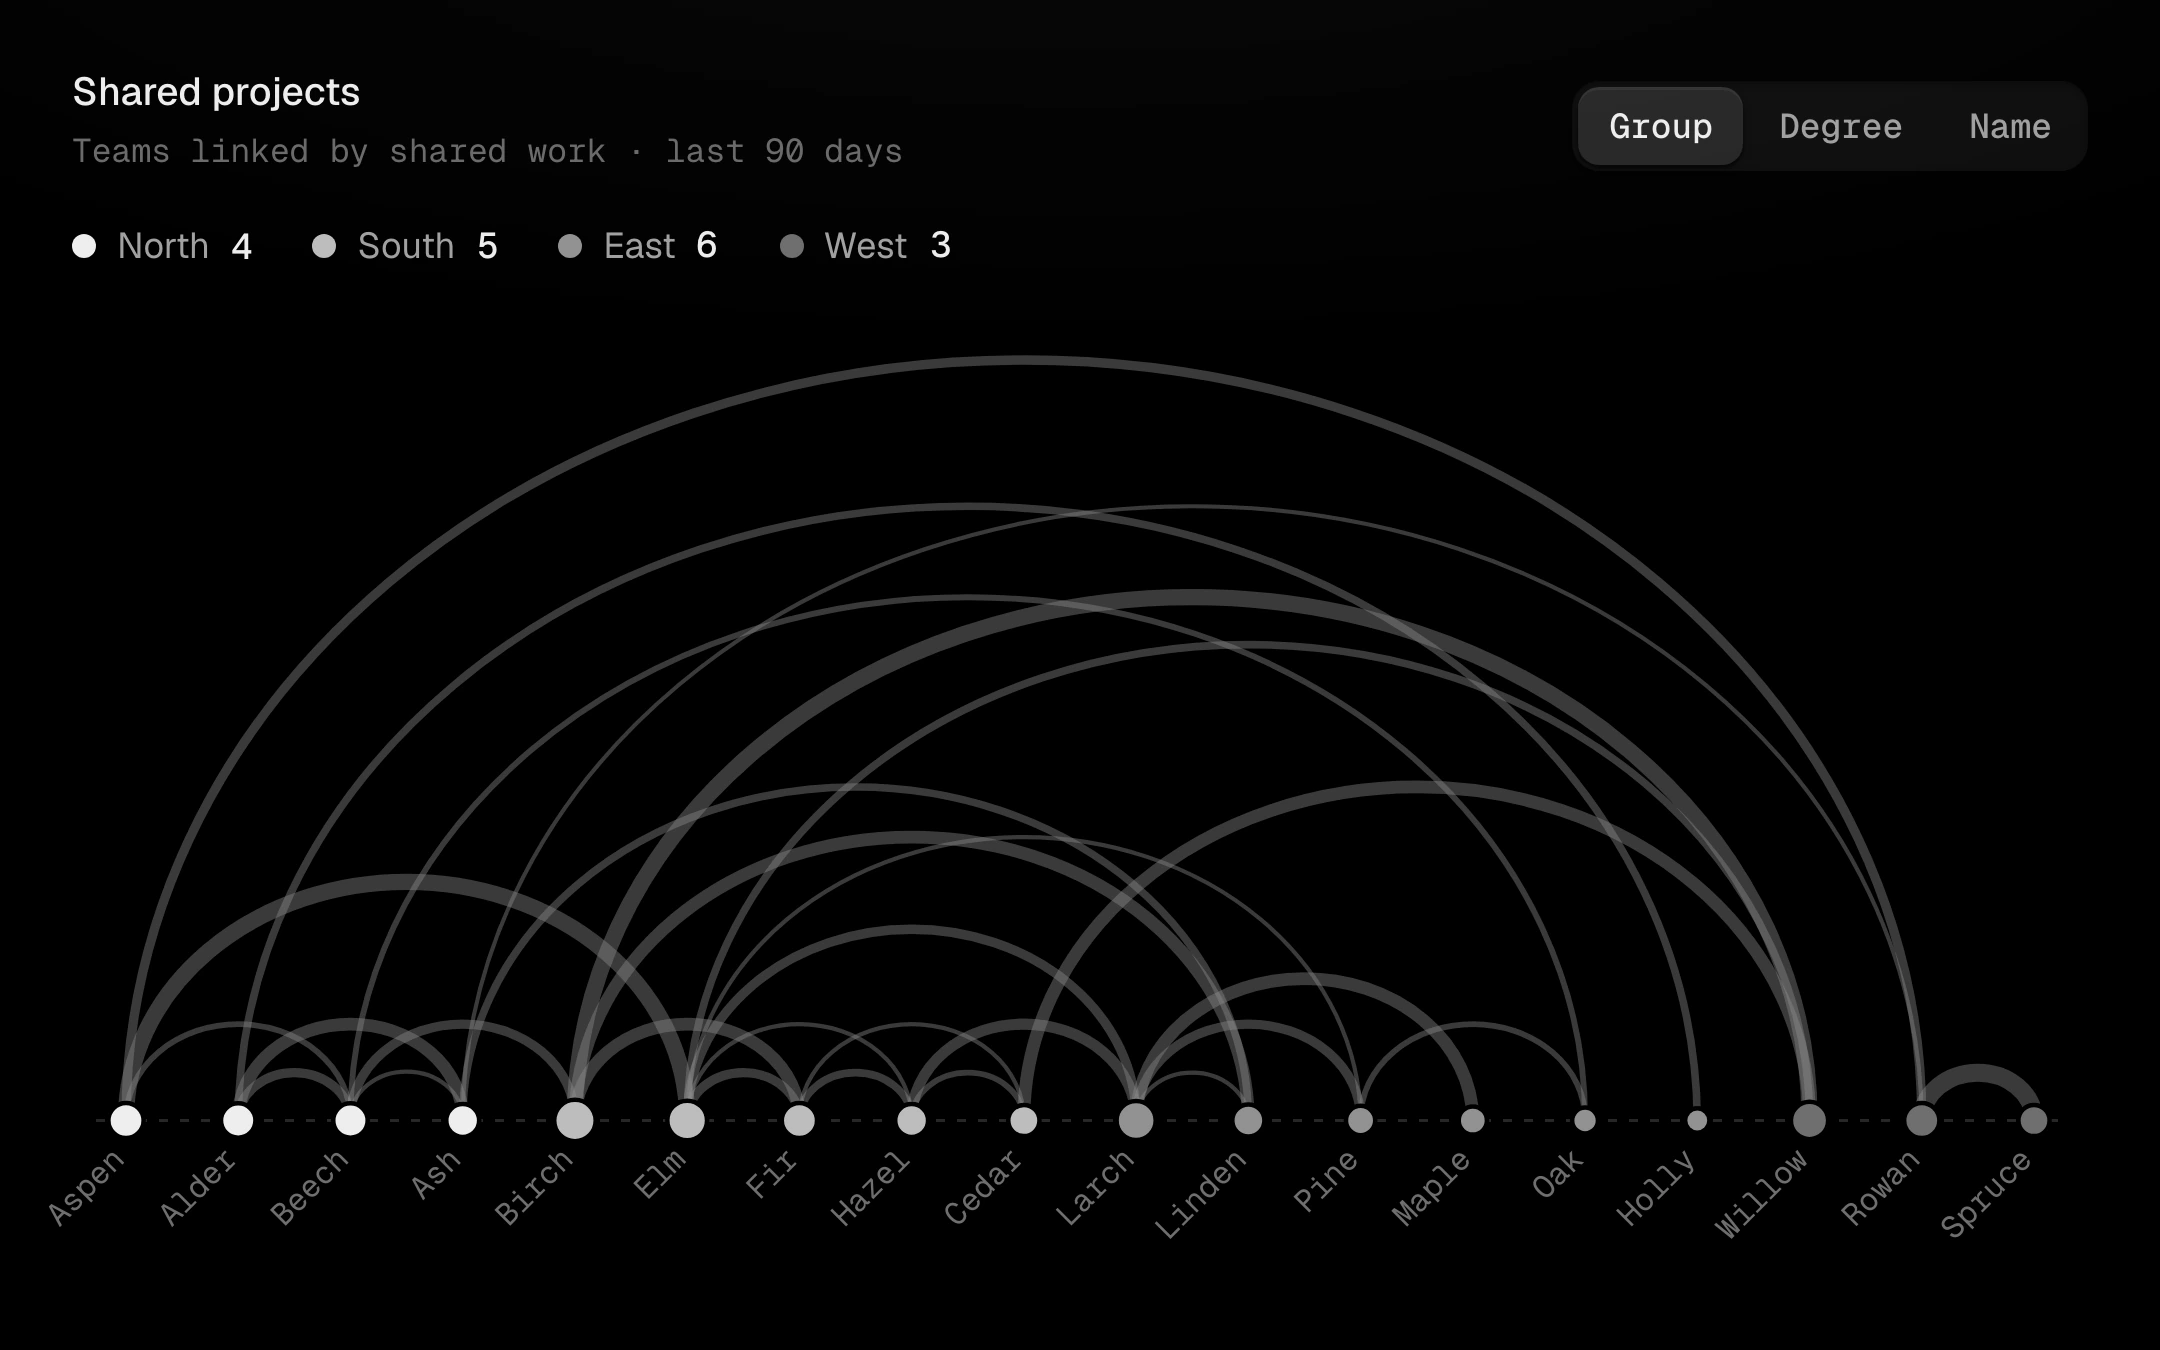
Nodes on one line and their links as arcs above it, each as thick as its weight.
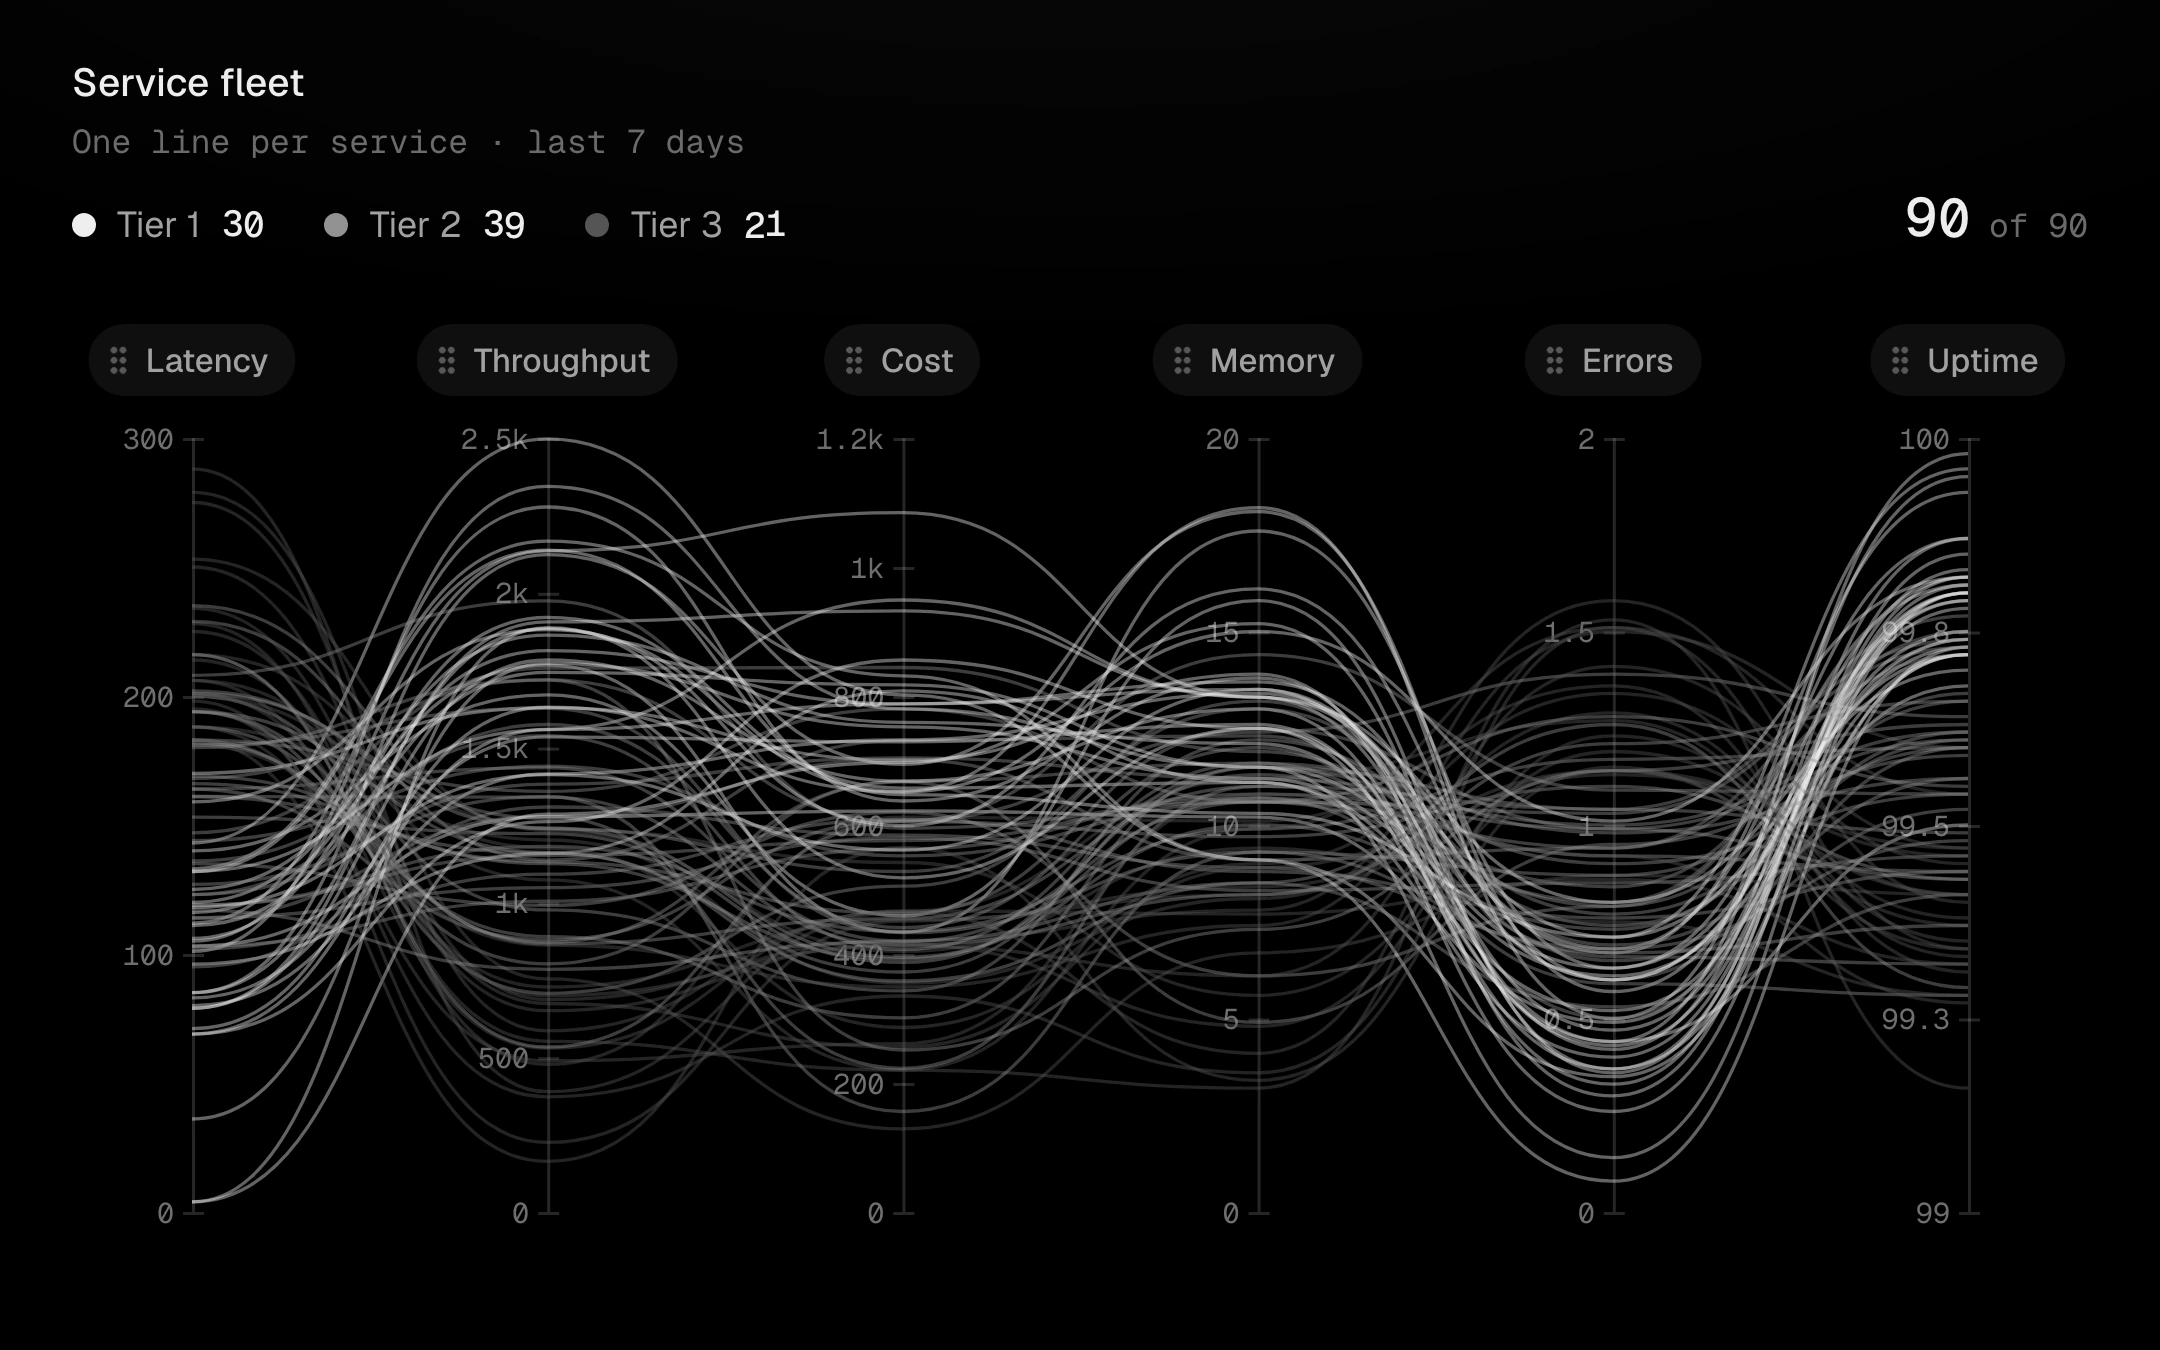
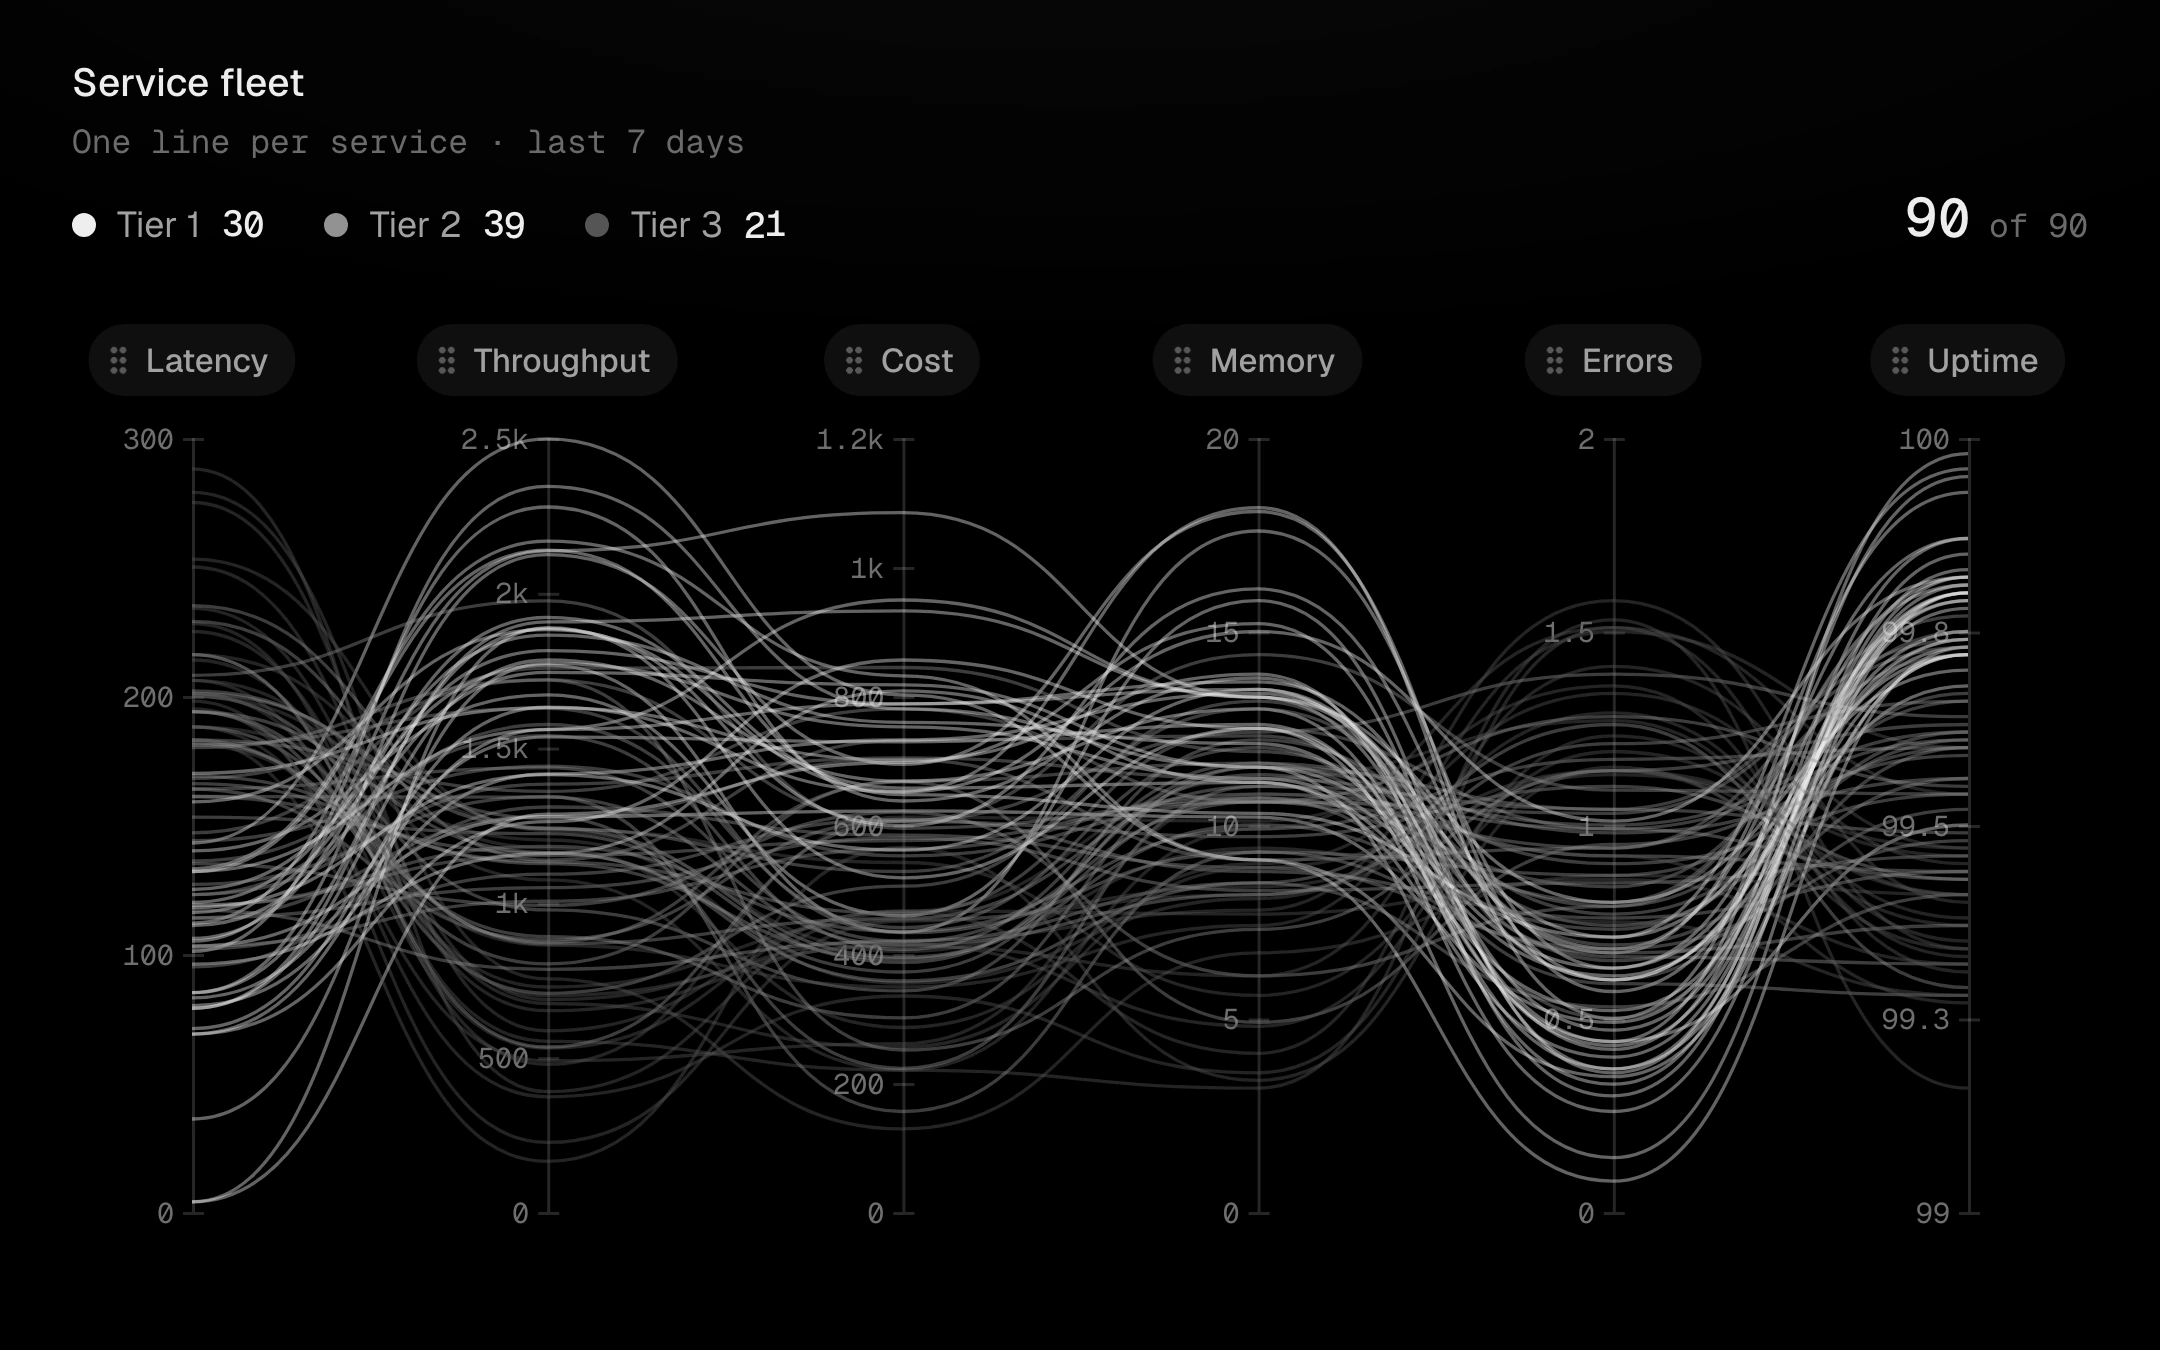
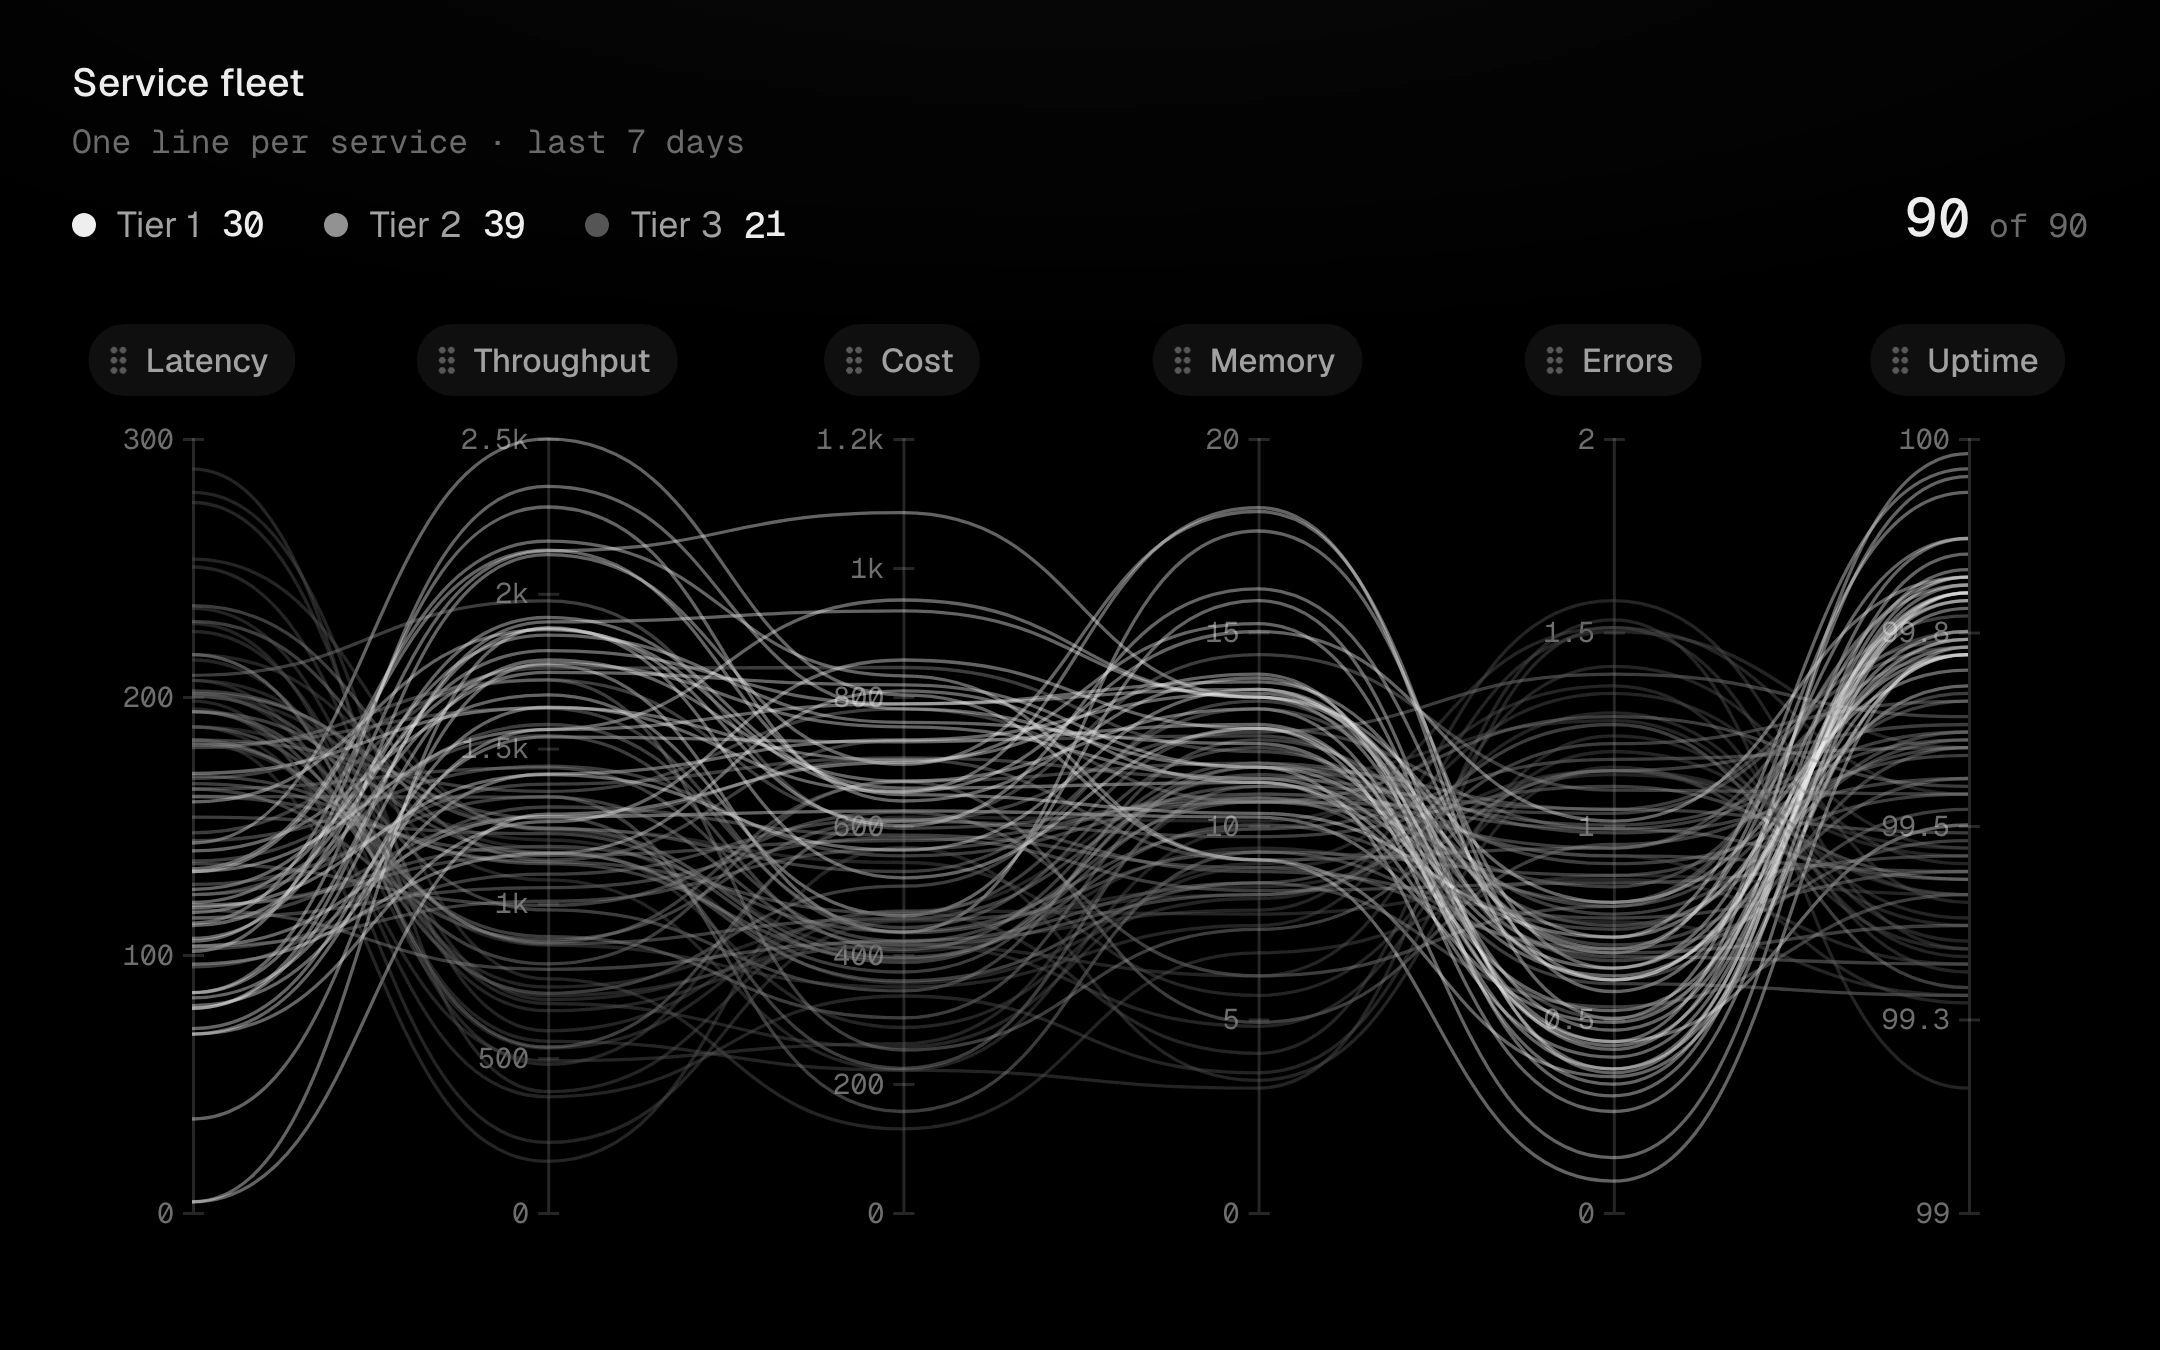
One vertical axis per dimension and one line per record, coloured by class in the grey ladder.
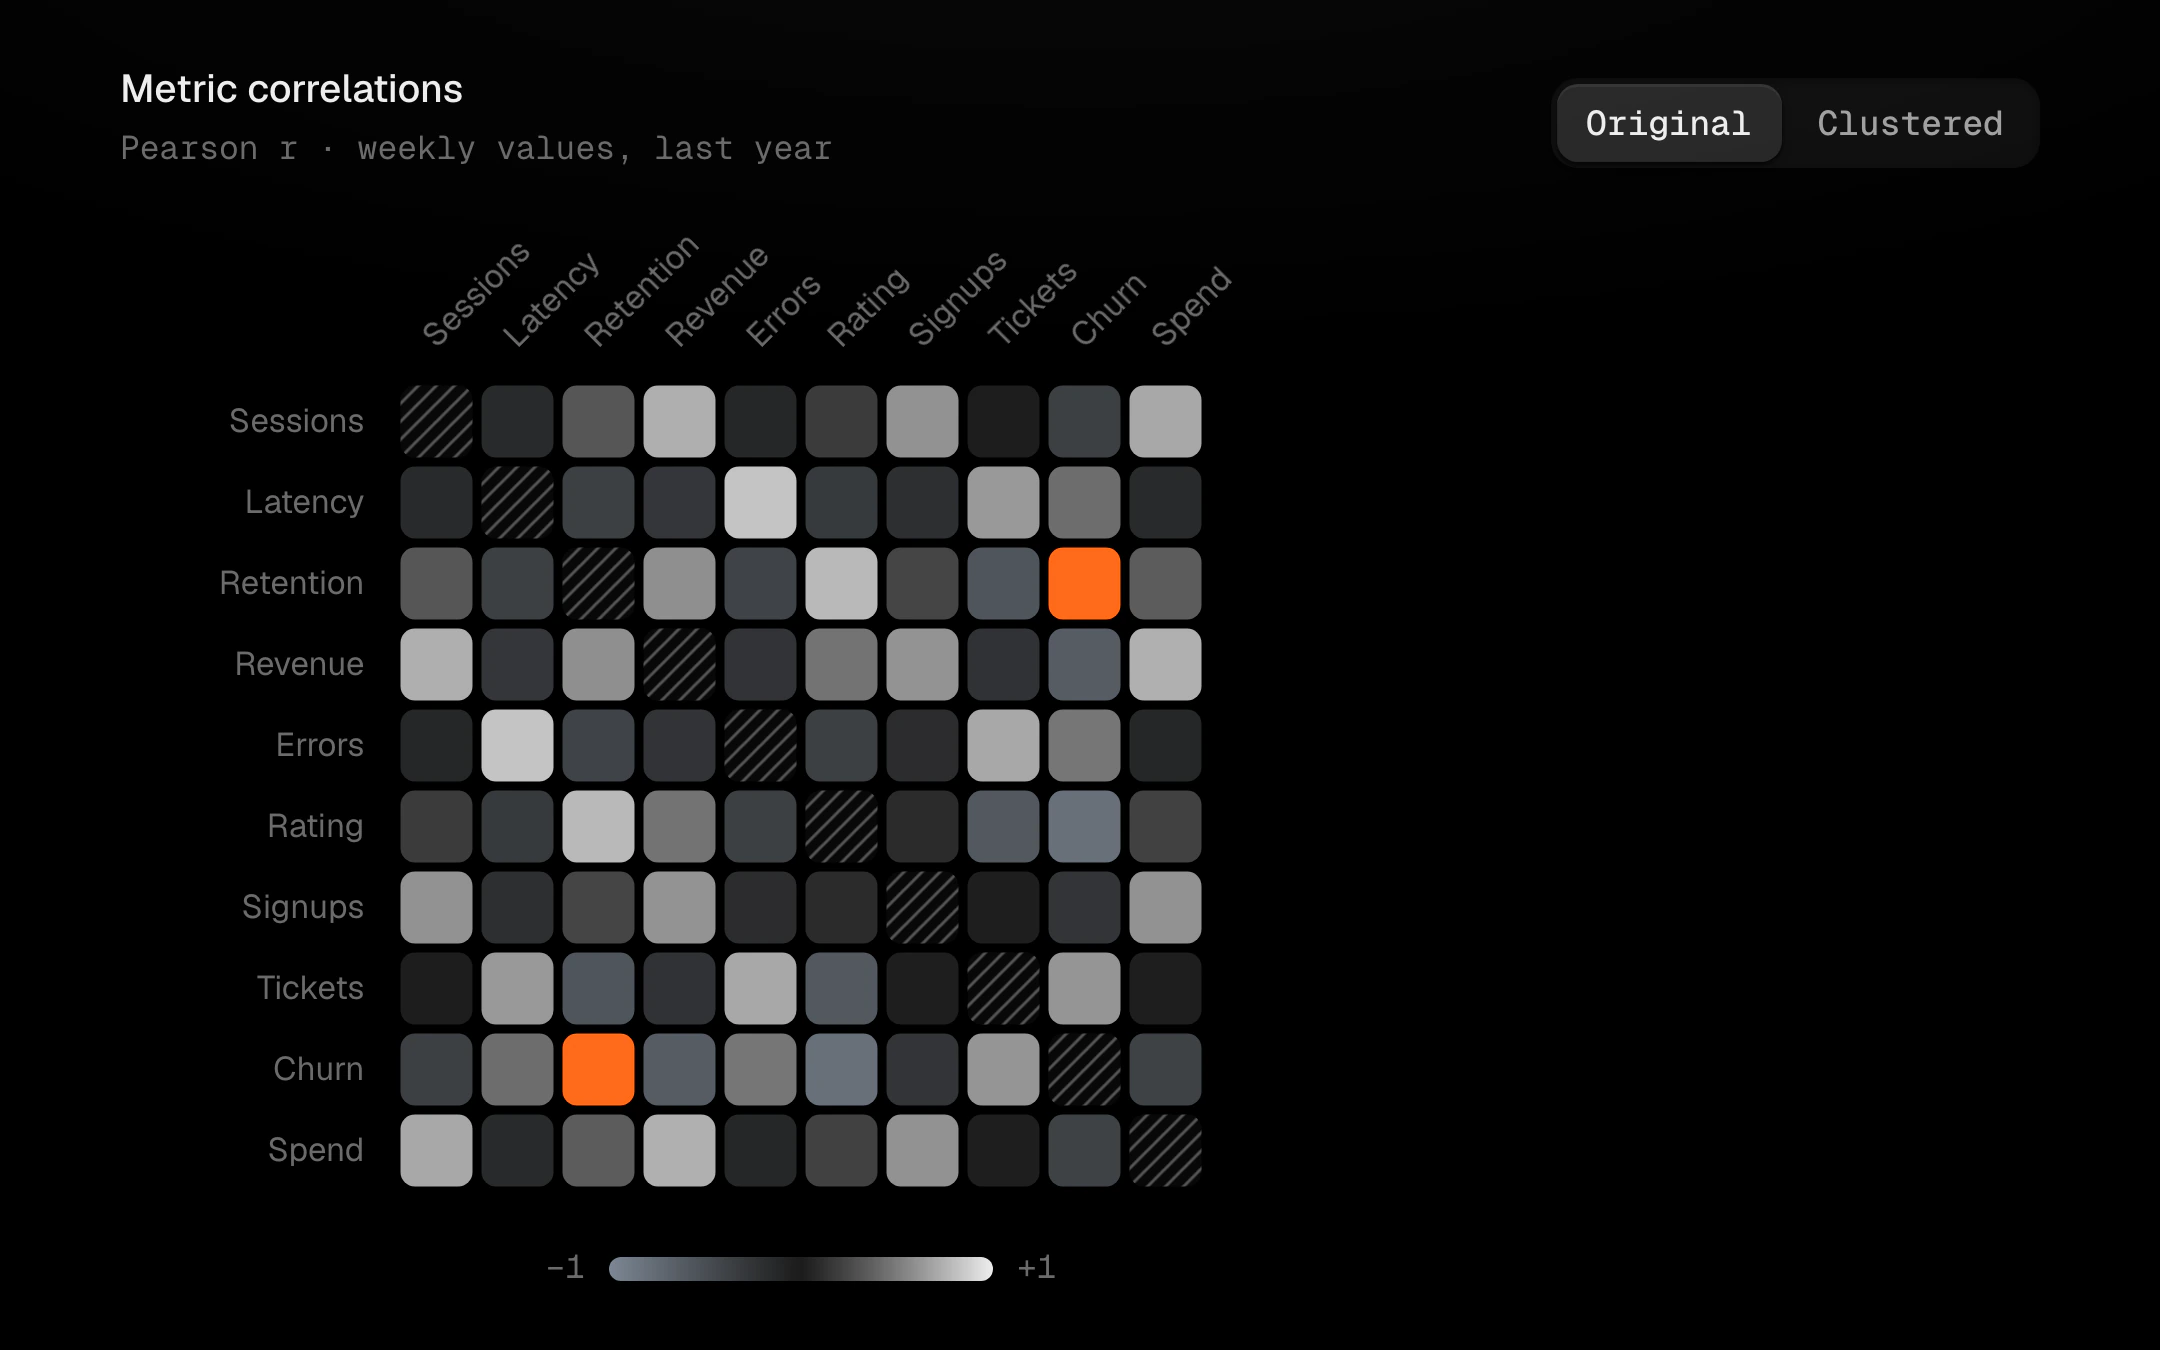
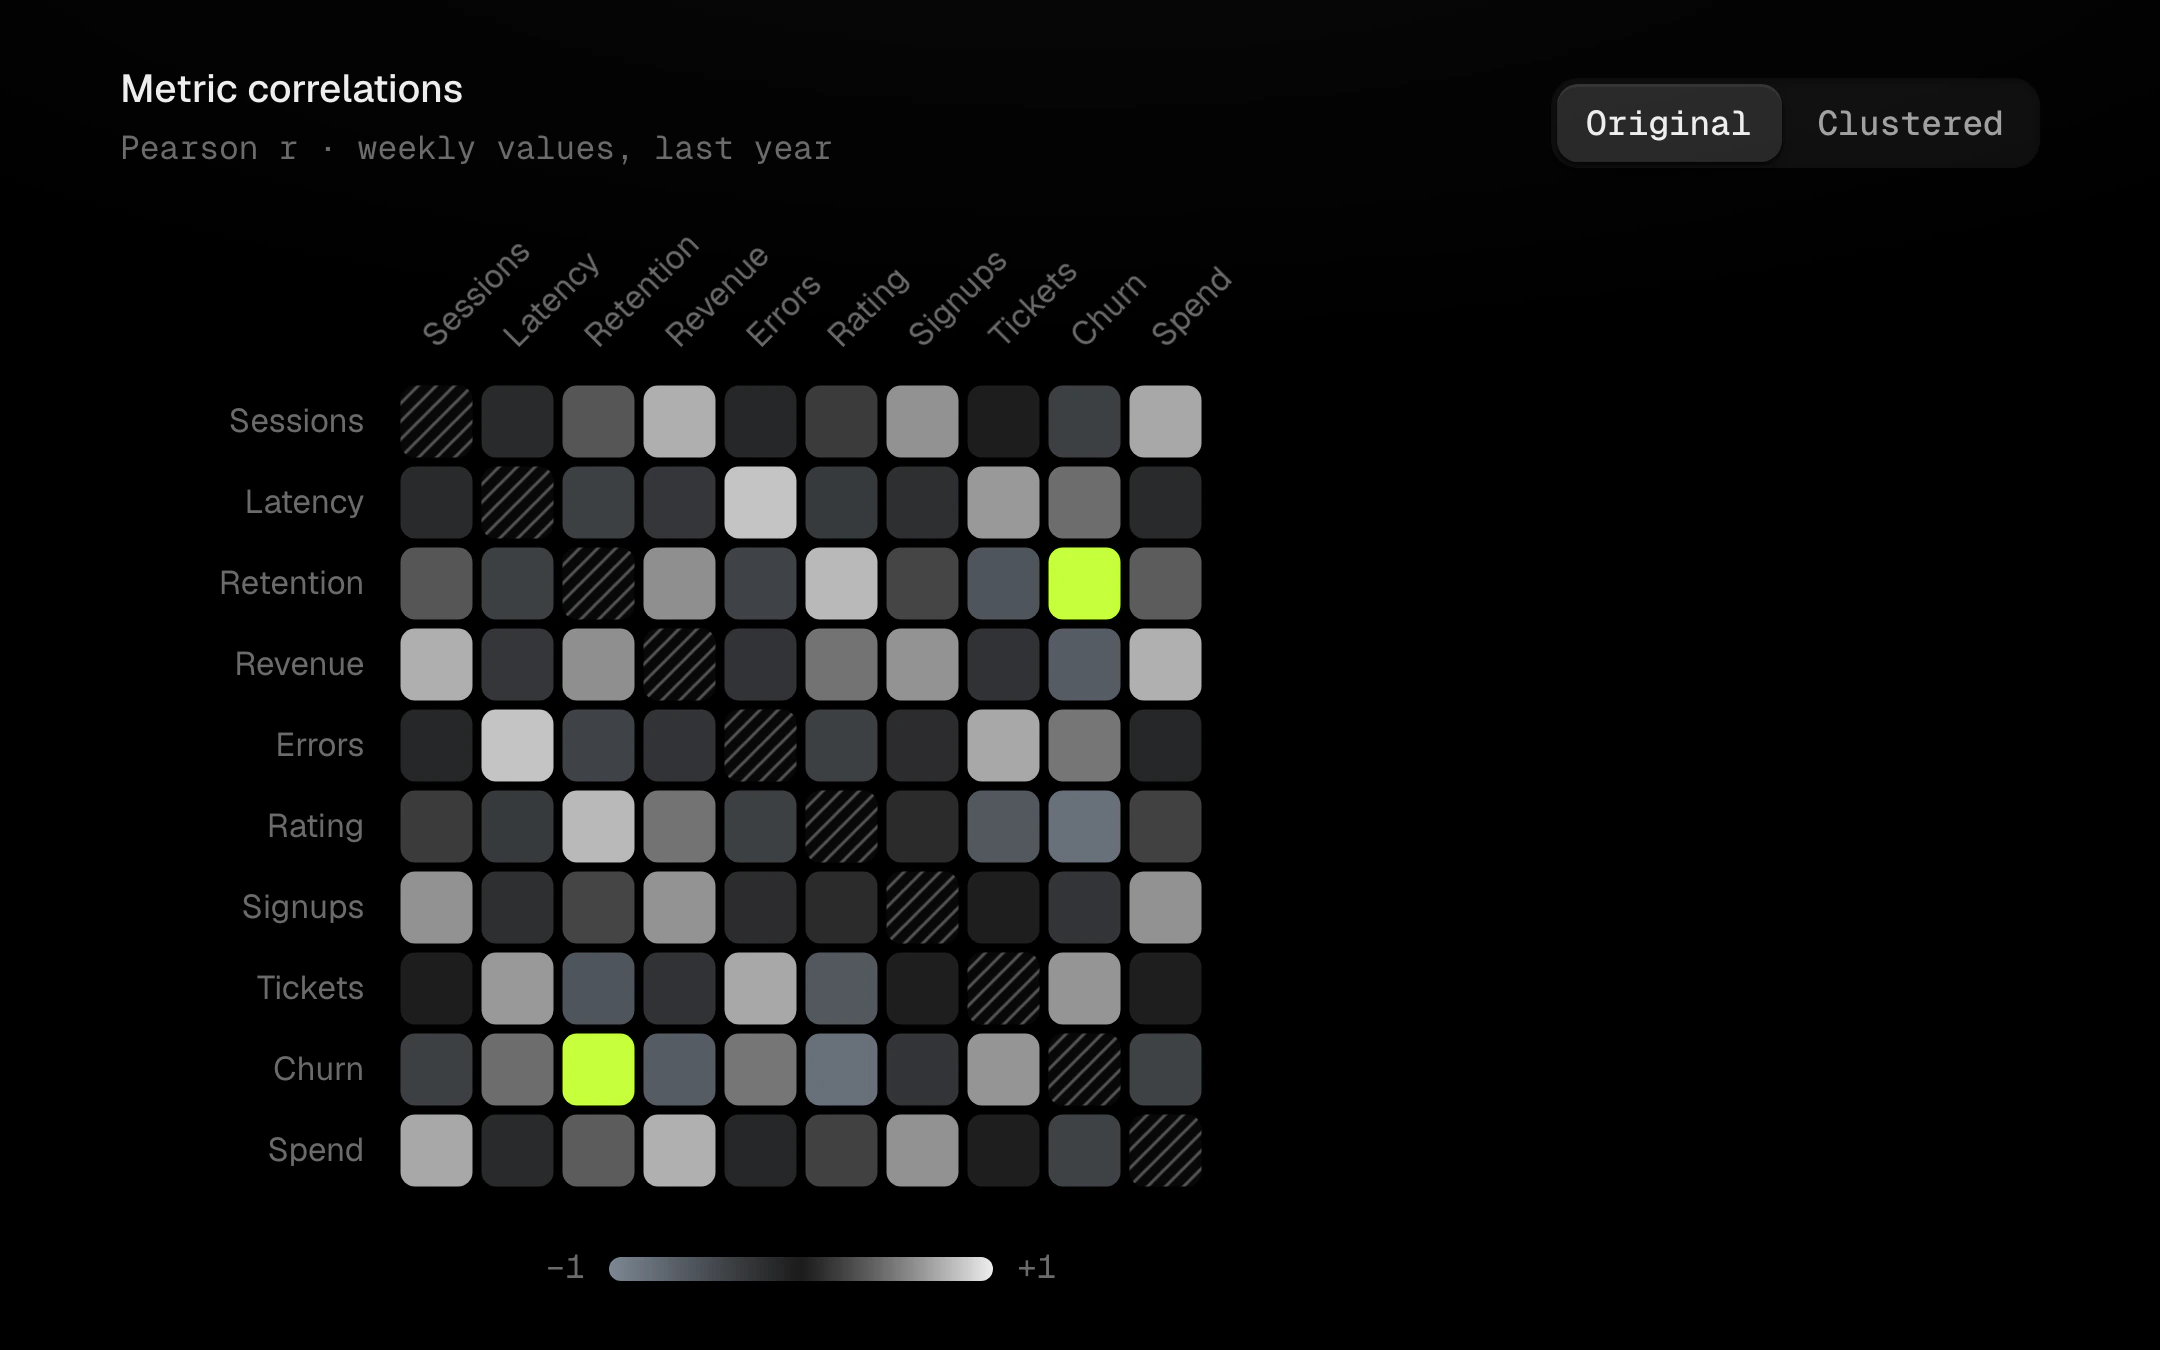
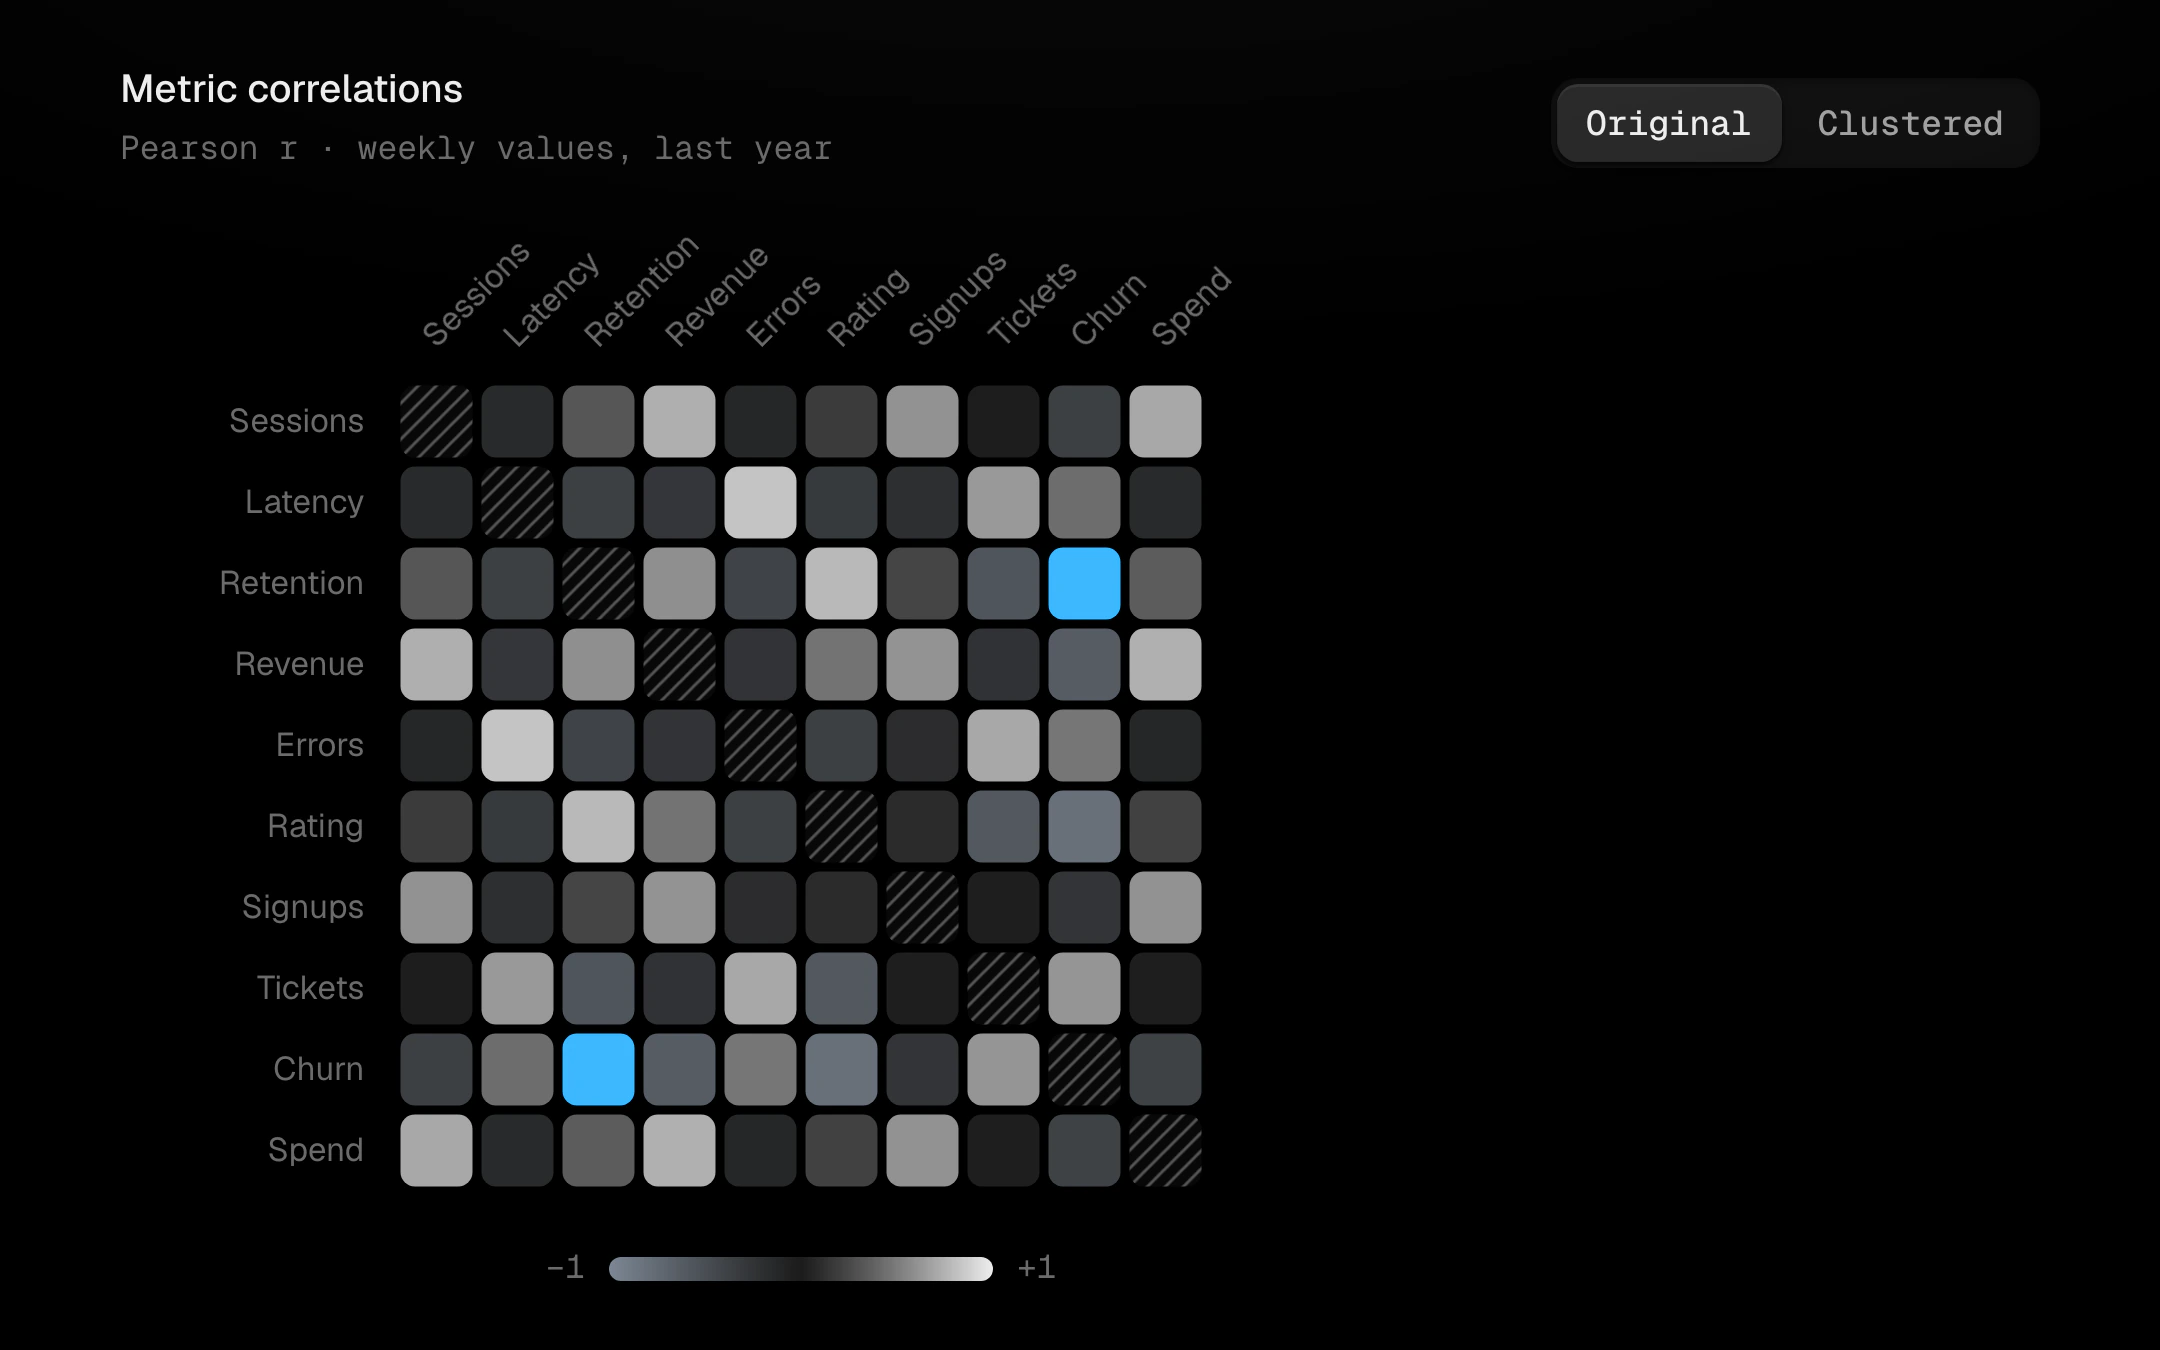
Every pair of variables as a cell on a diverging scale: cool grey for negative, near-black at zero and bone for positive, with only the strongest pair in the accent (the heat ramp for positives is opt-in).
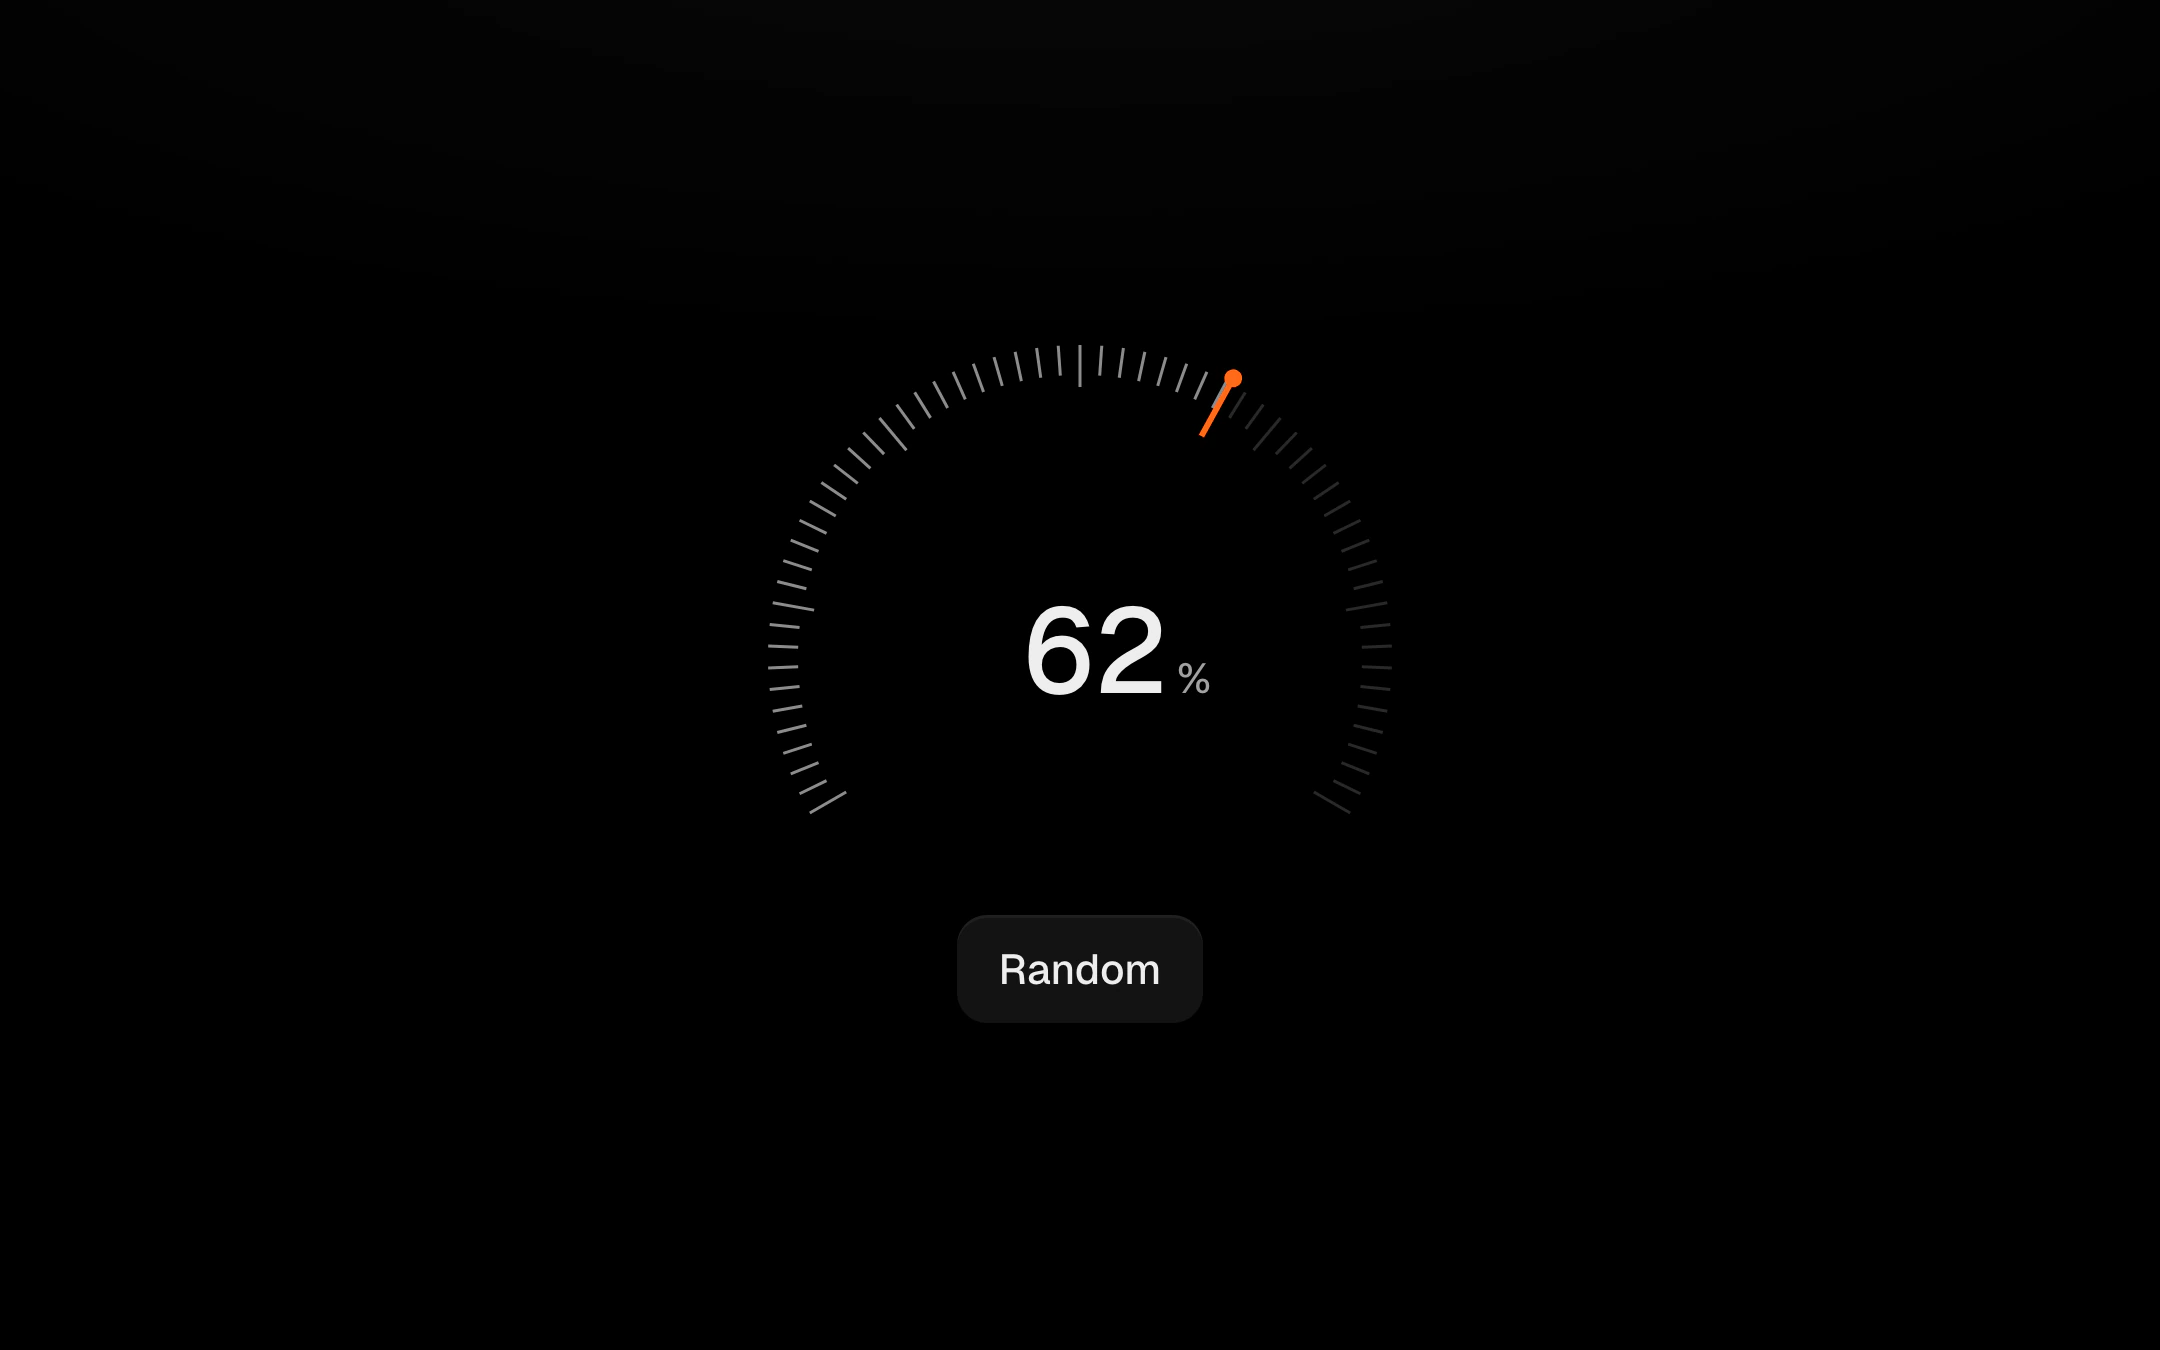
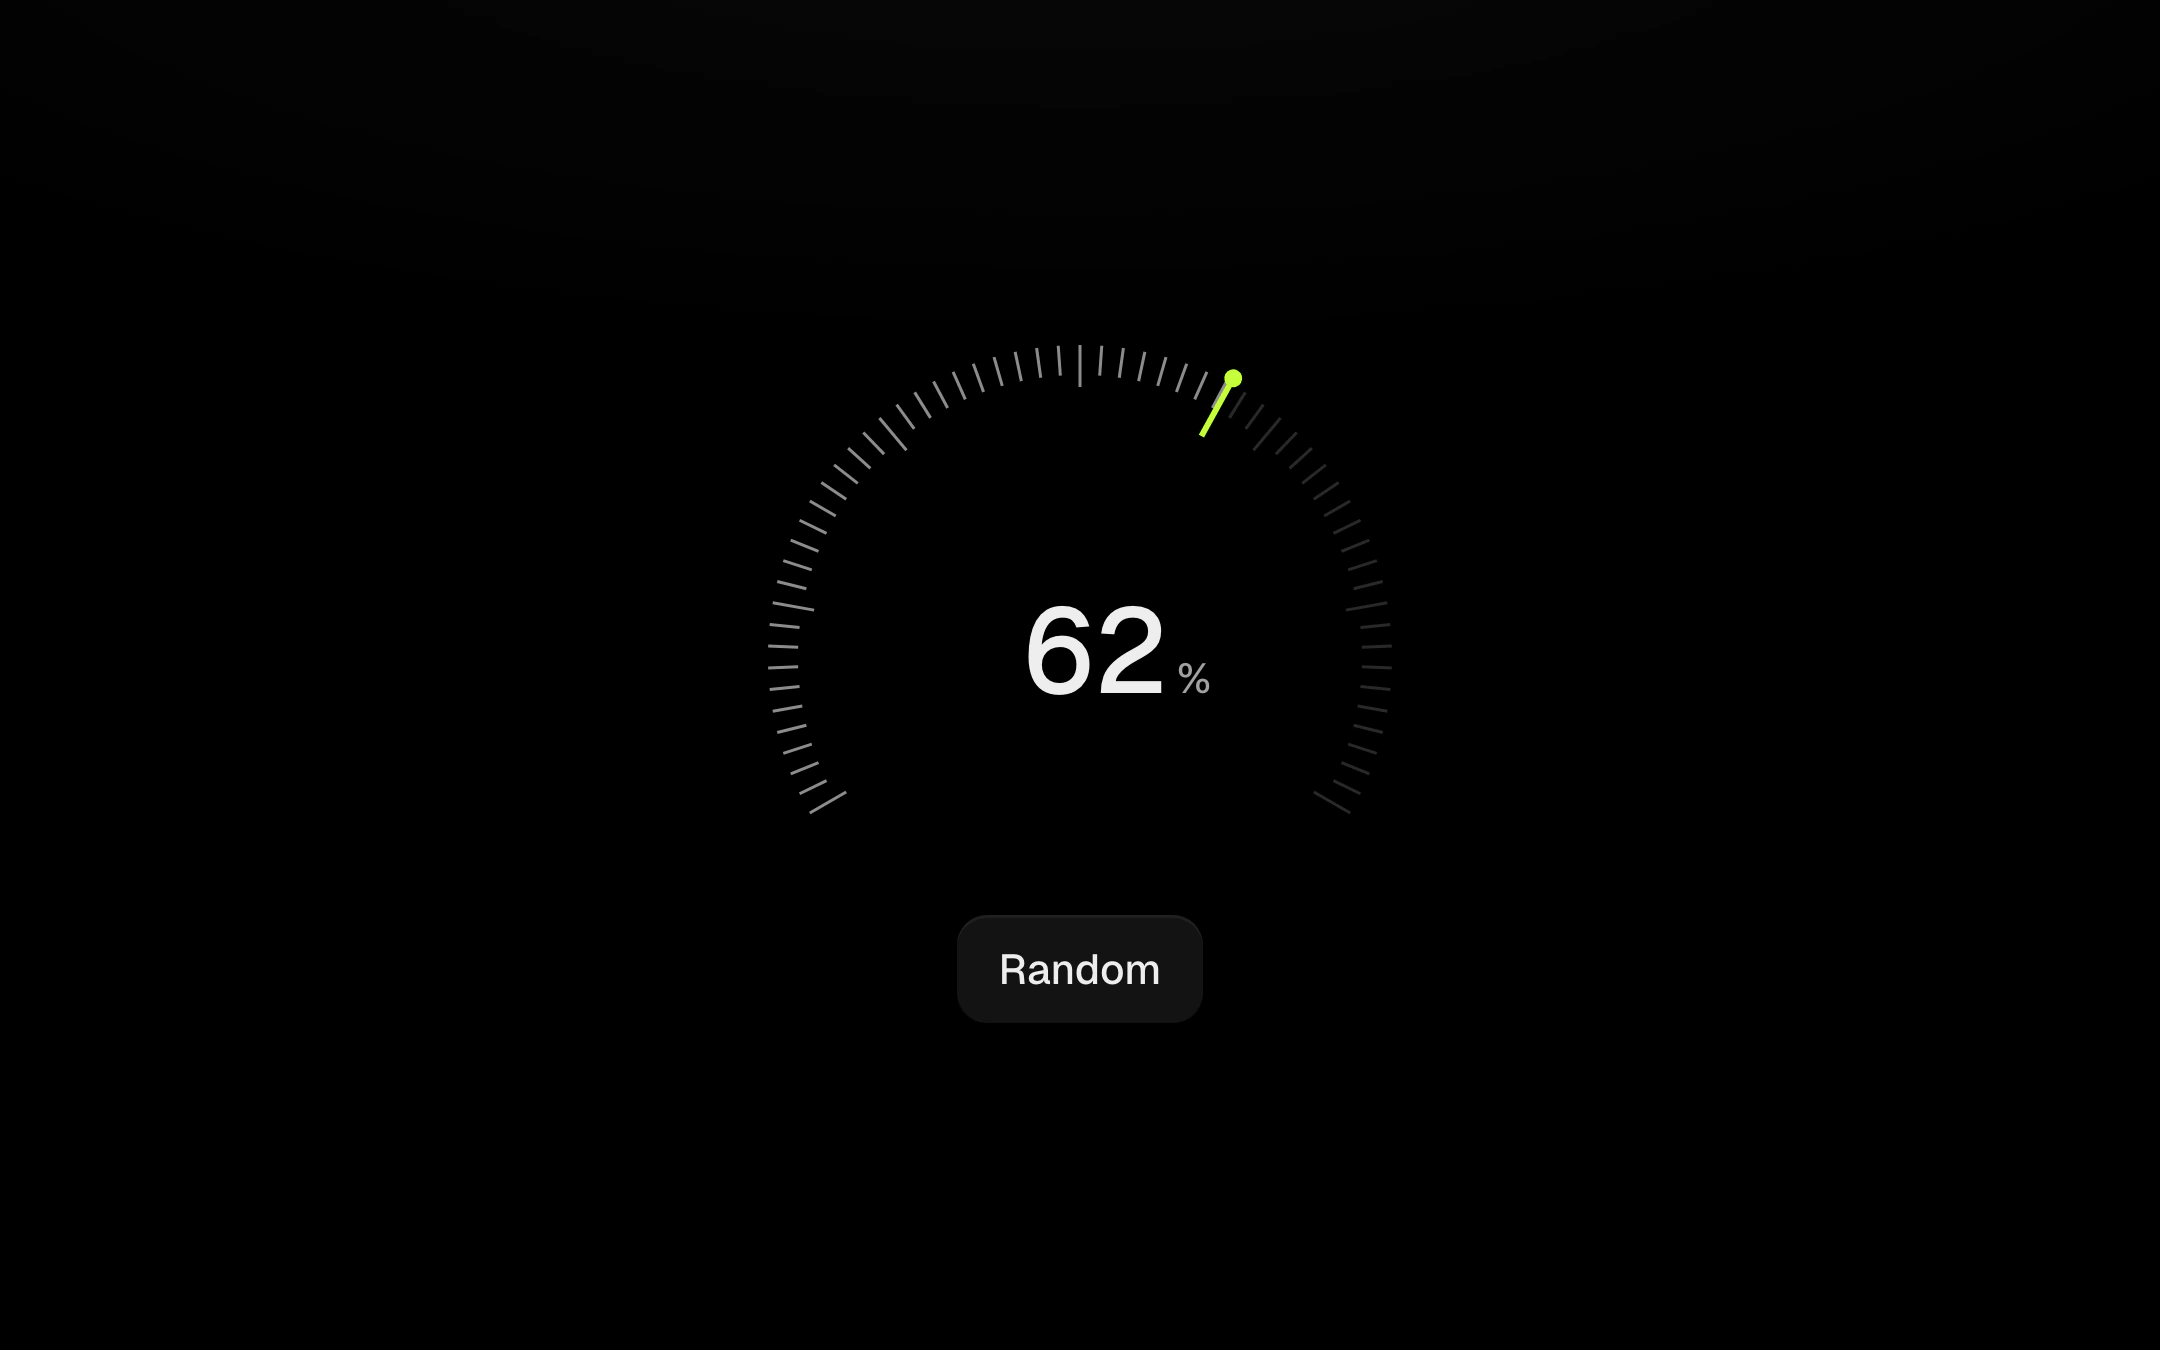
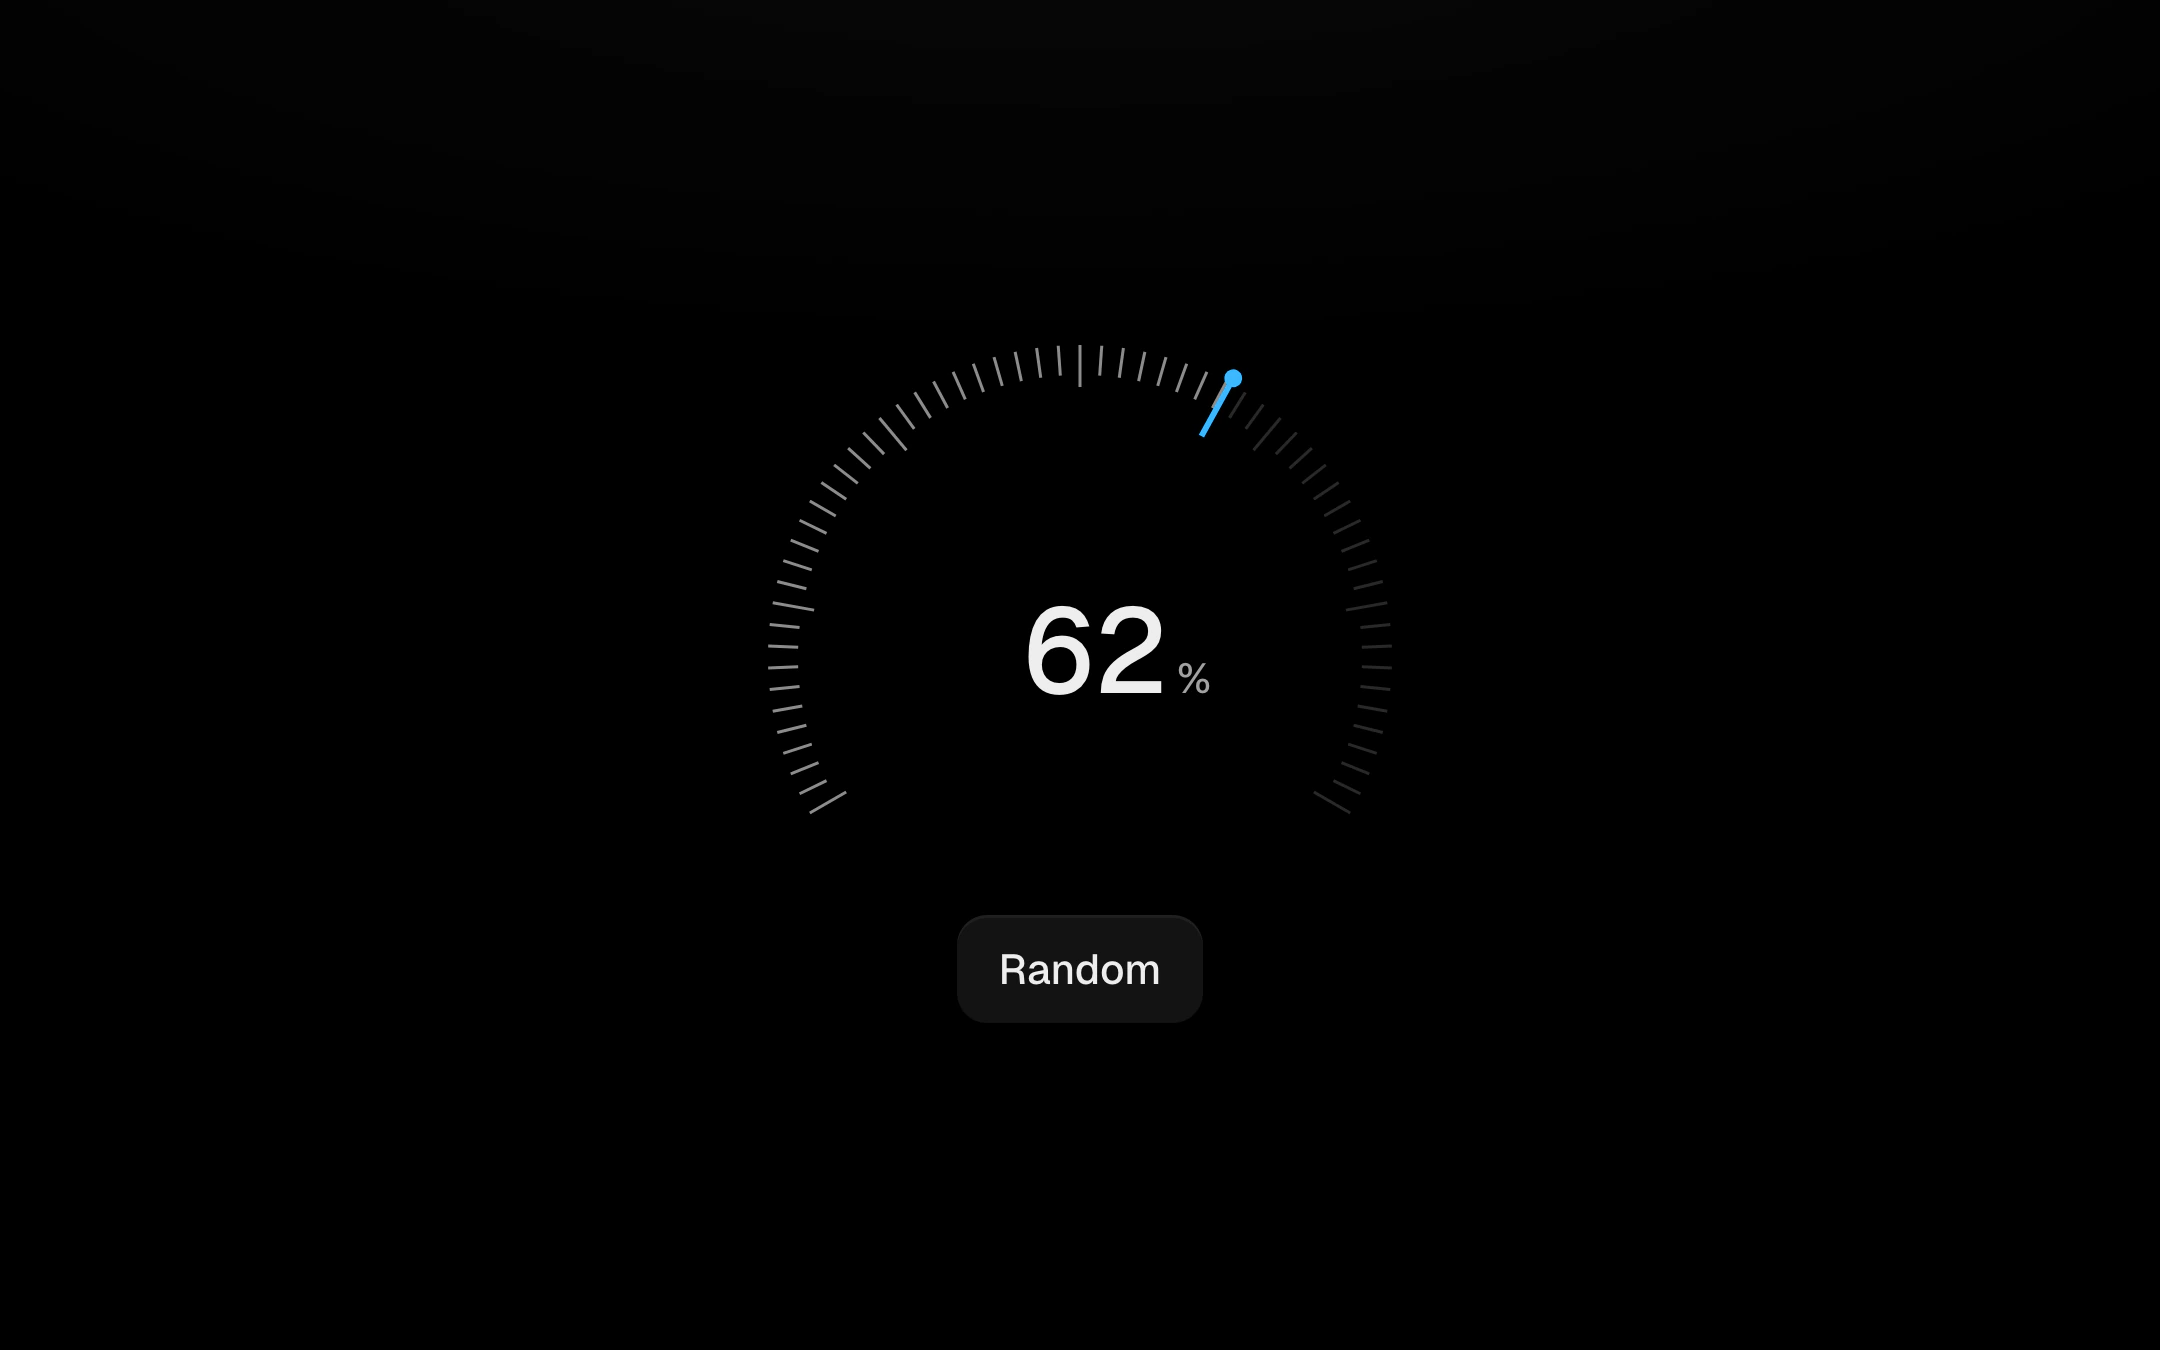
A dial of 61 notches with a needle that has mass: it sweeps up from the minimum on a loose spring, overshoots and settles, lighting notches as it passes and flashing the one it just crossed.
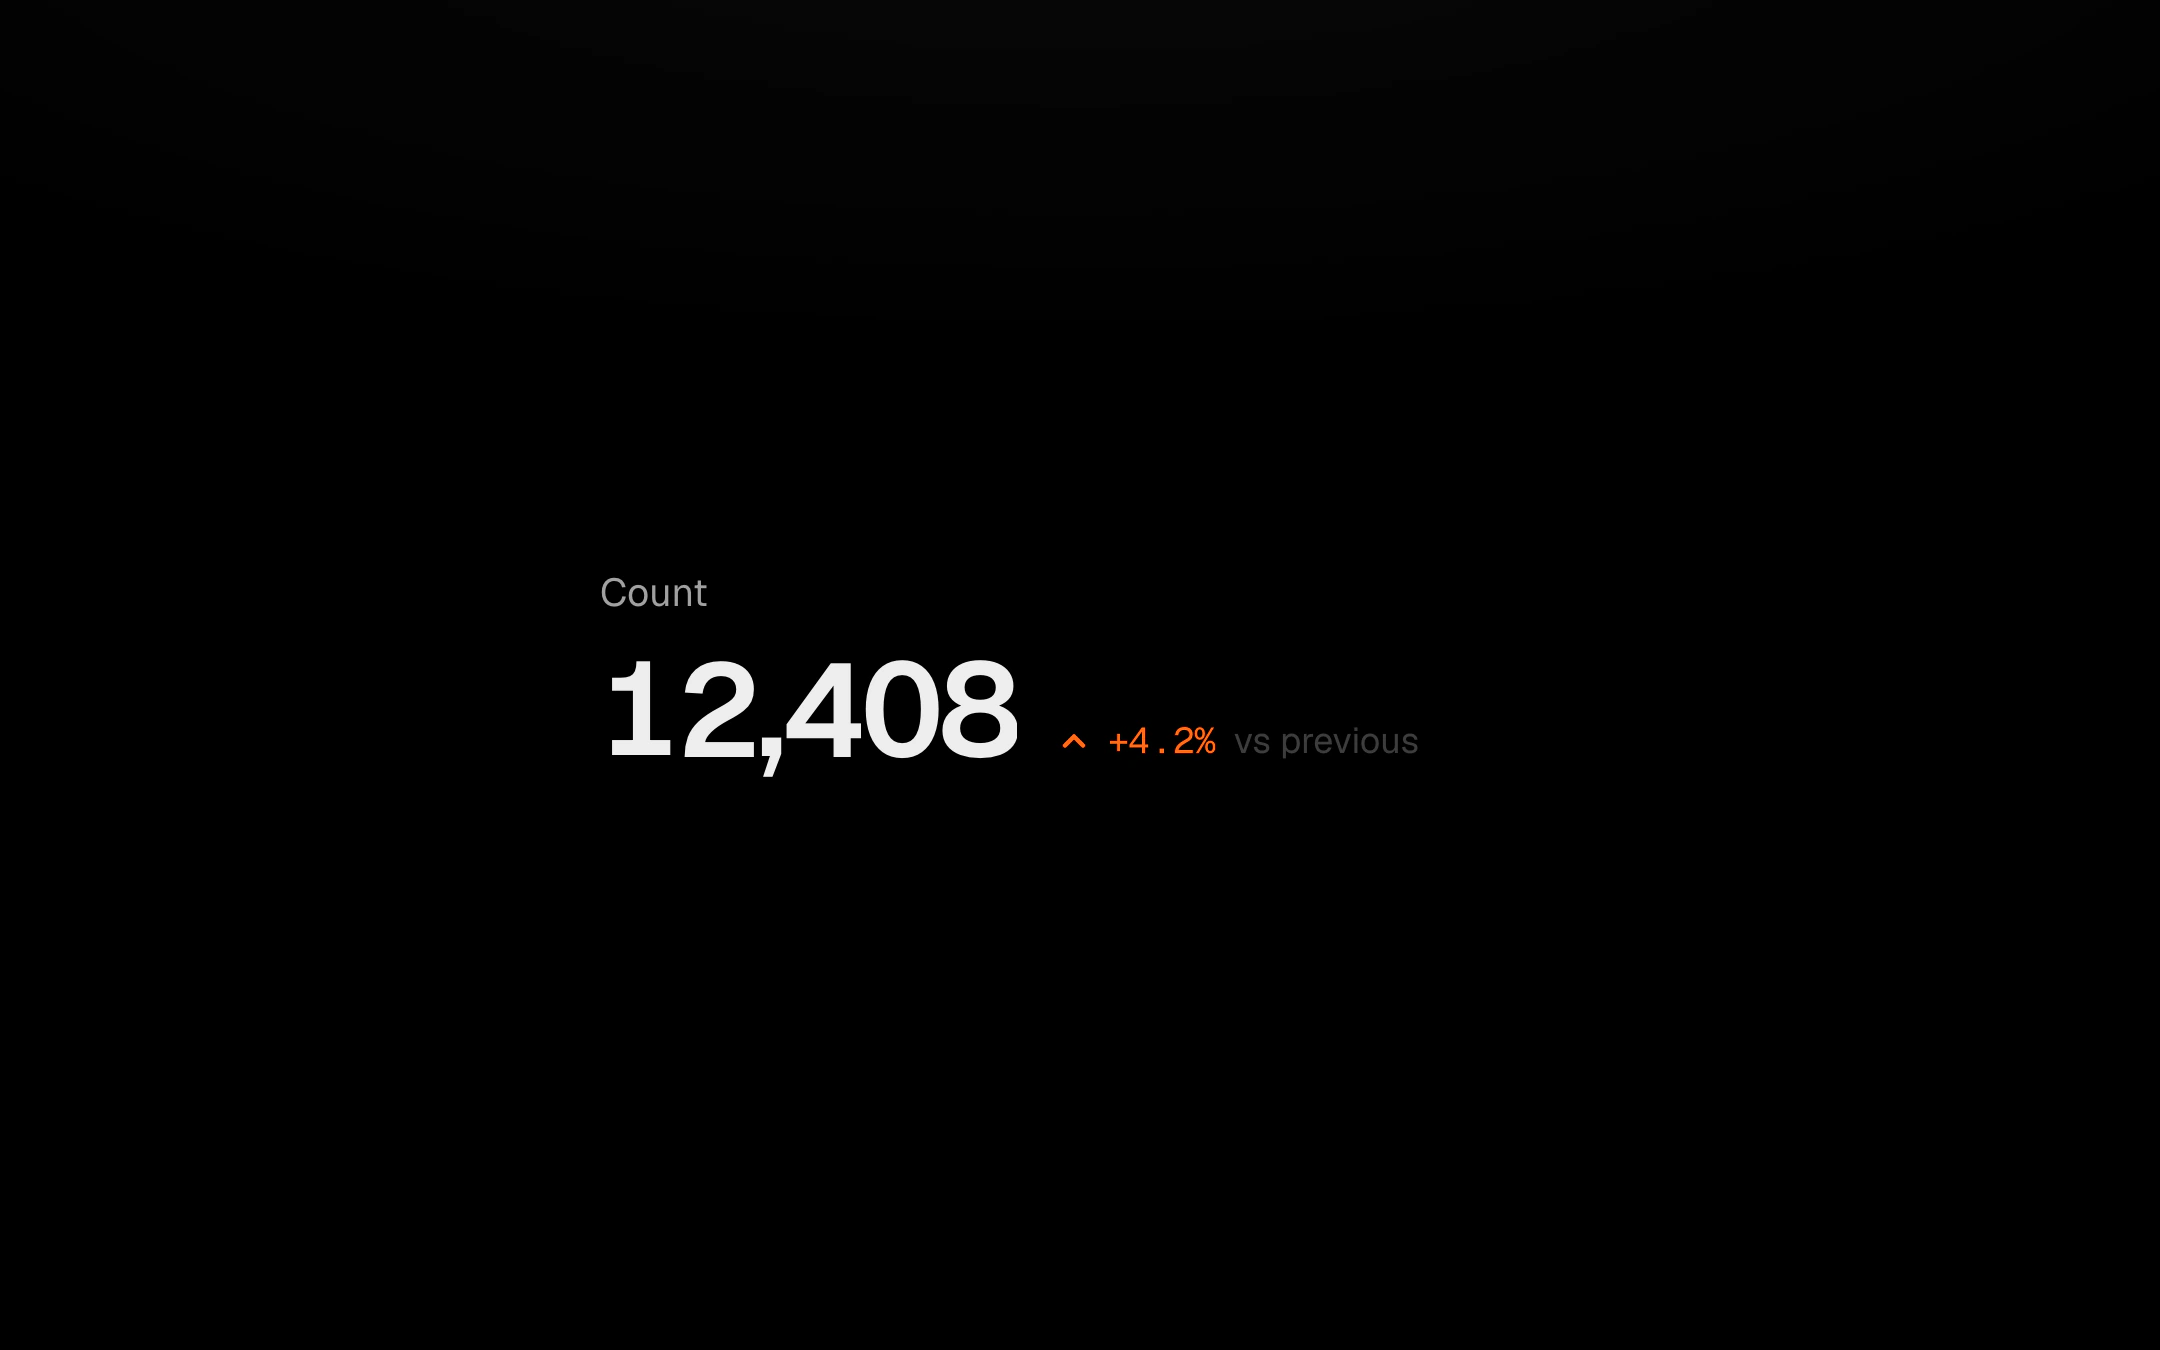
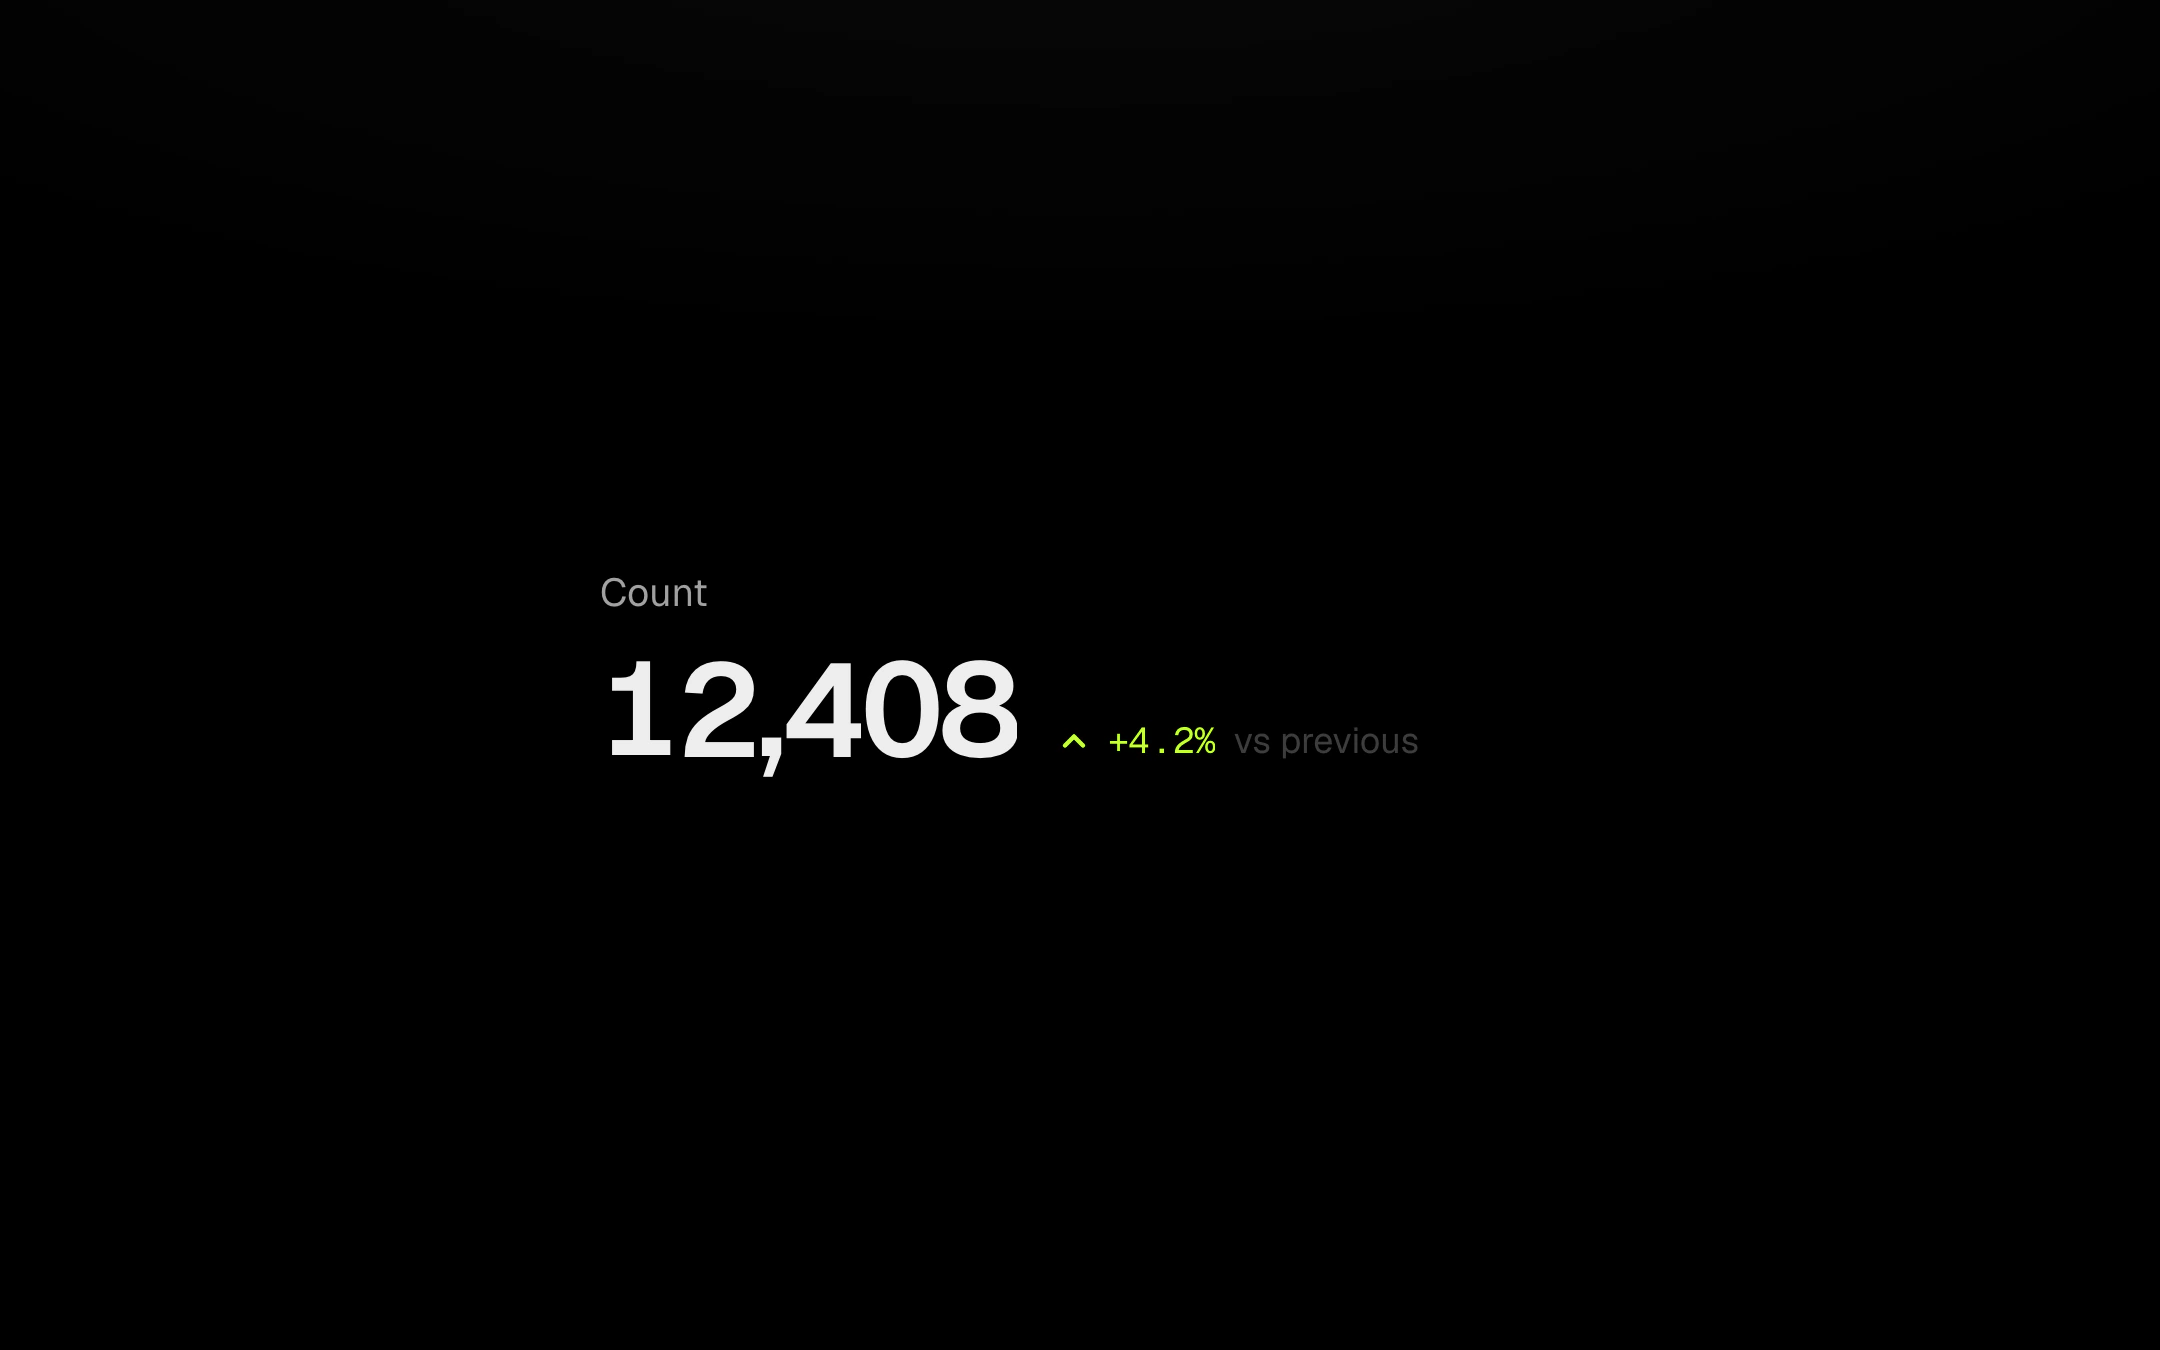
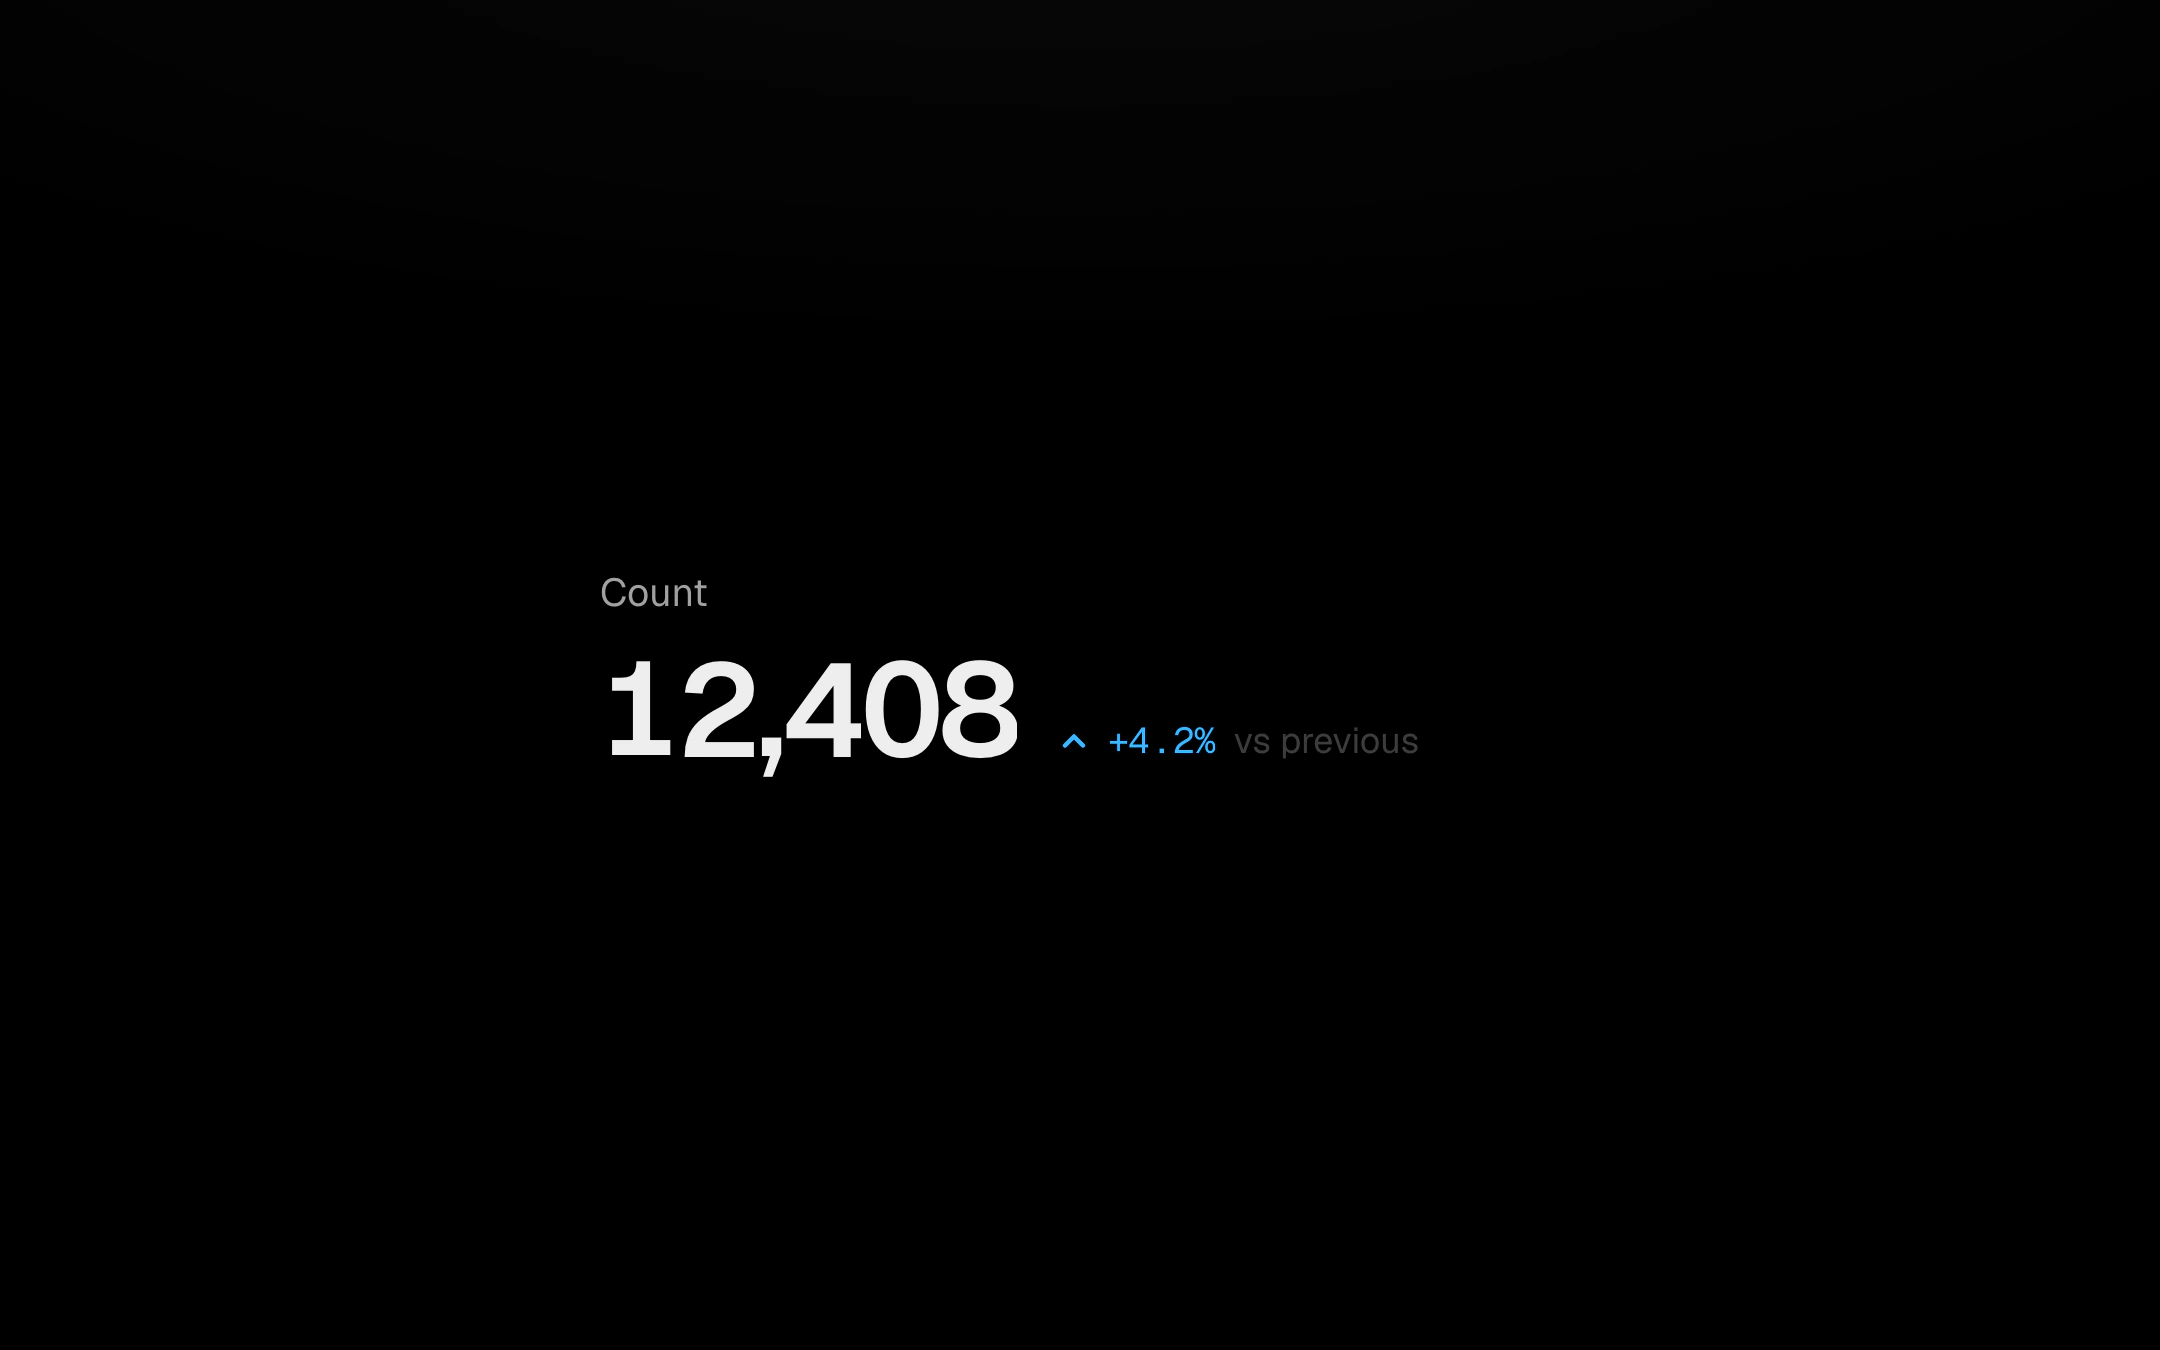
A label, one big number and its change.
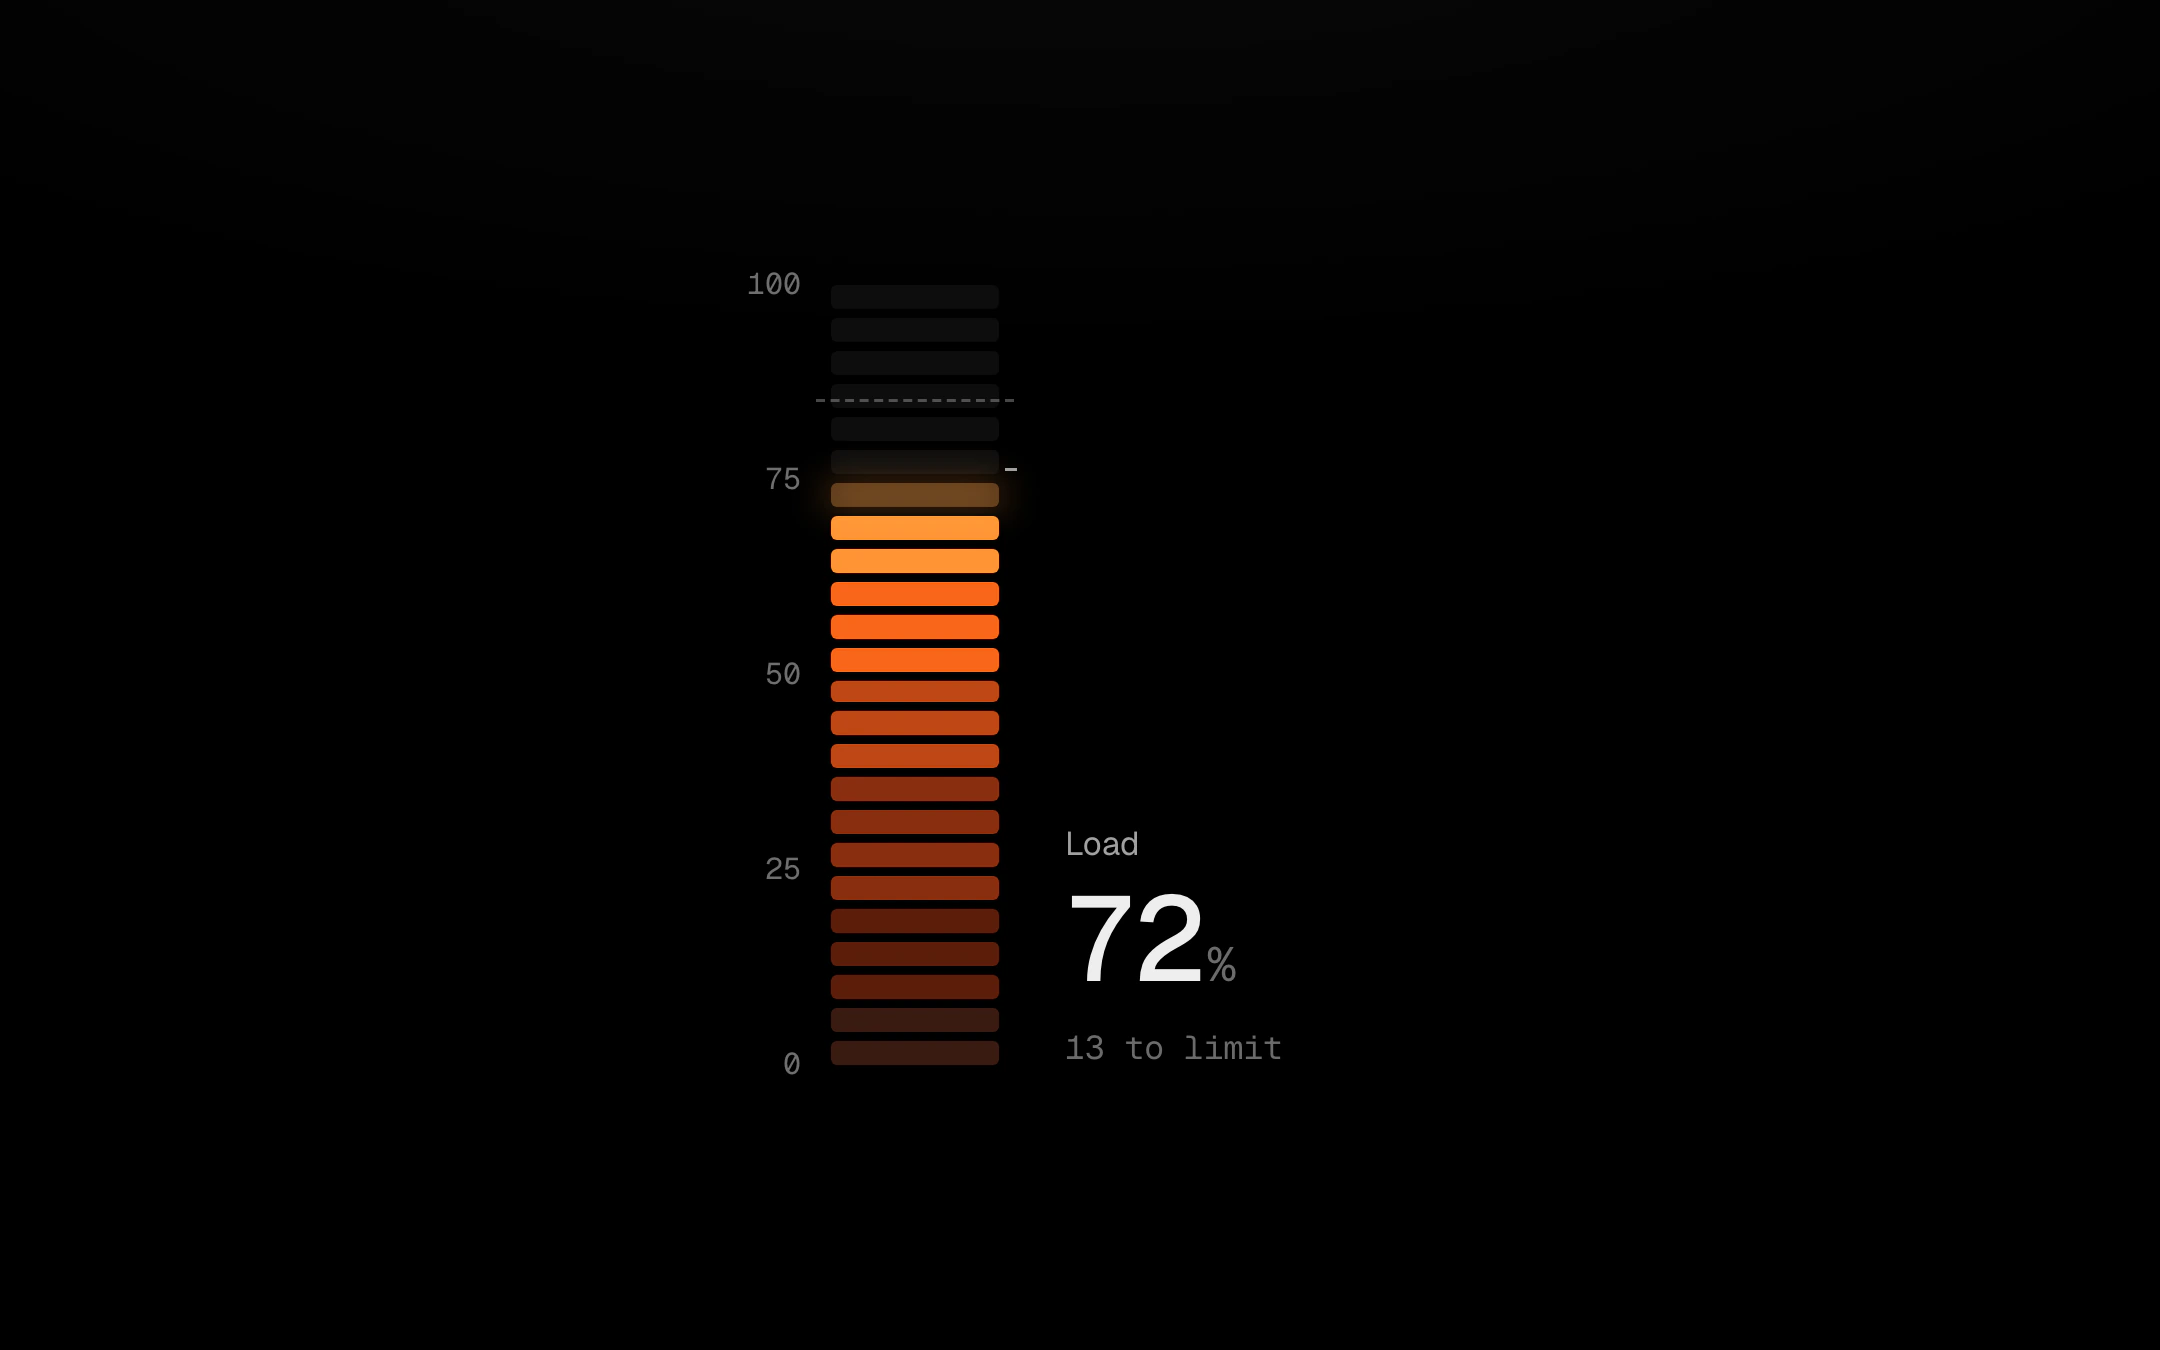
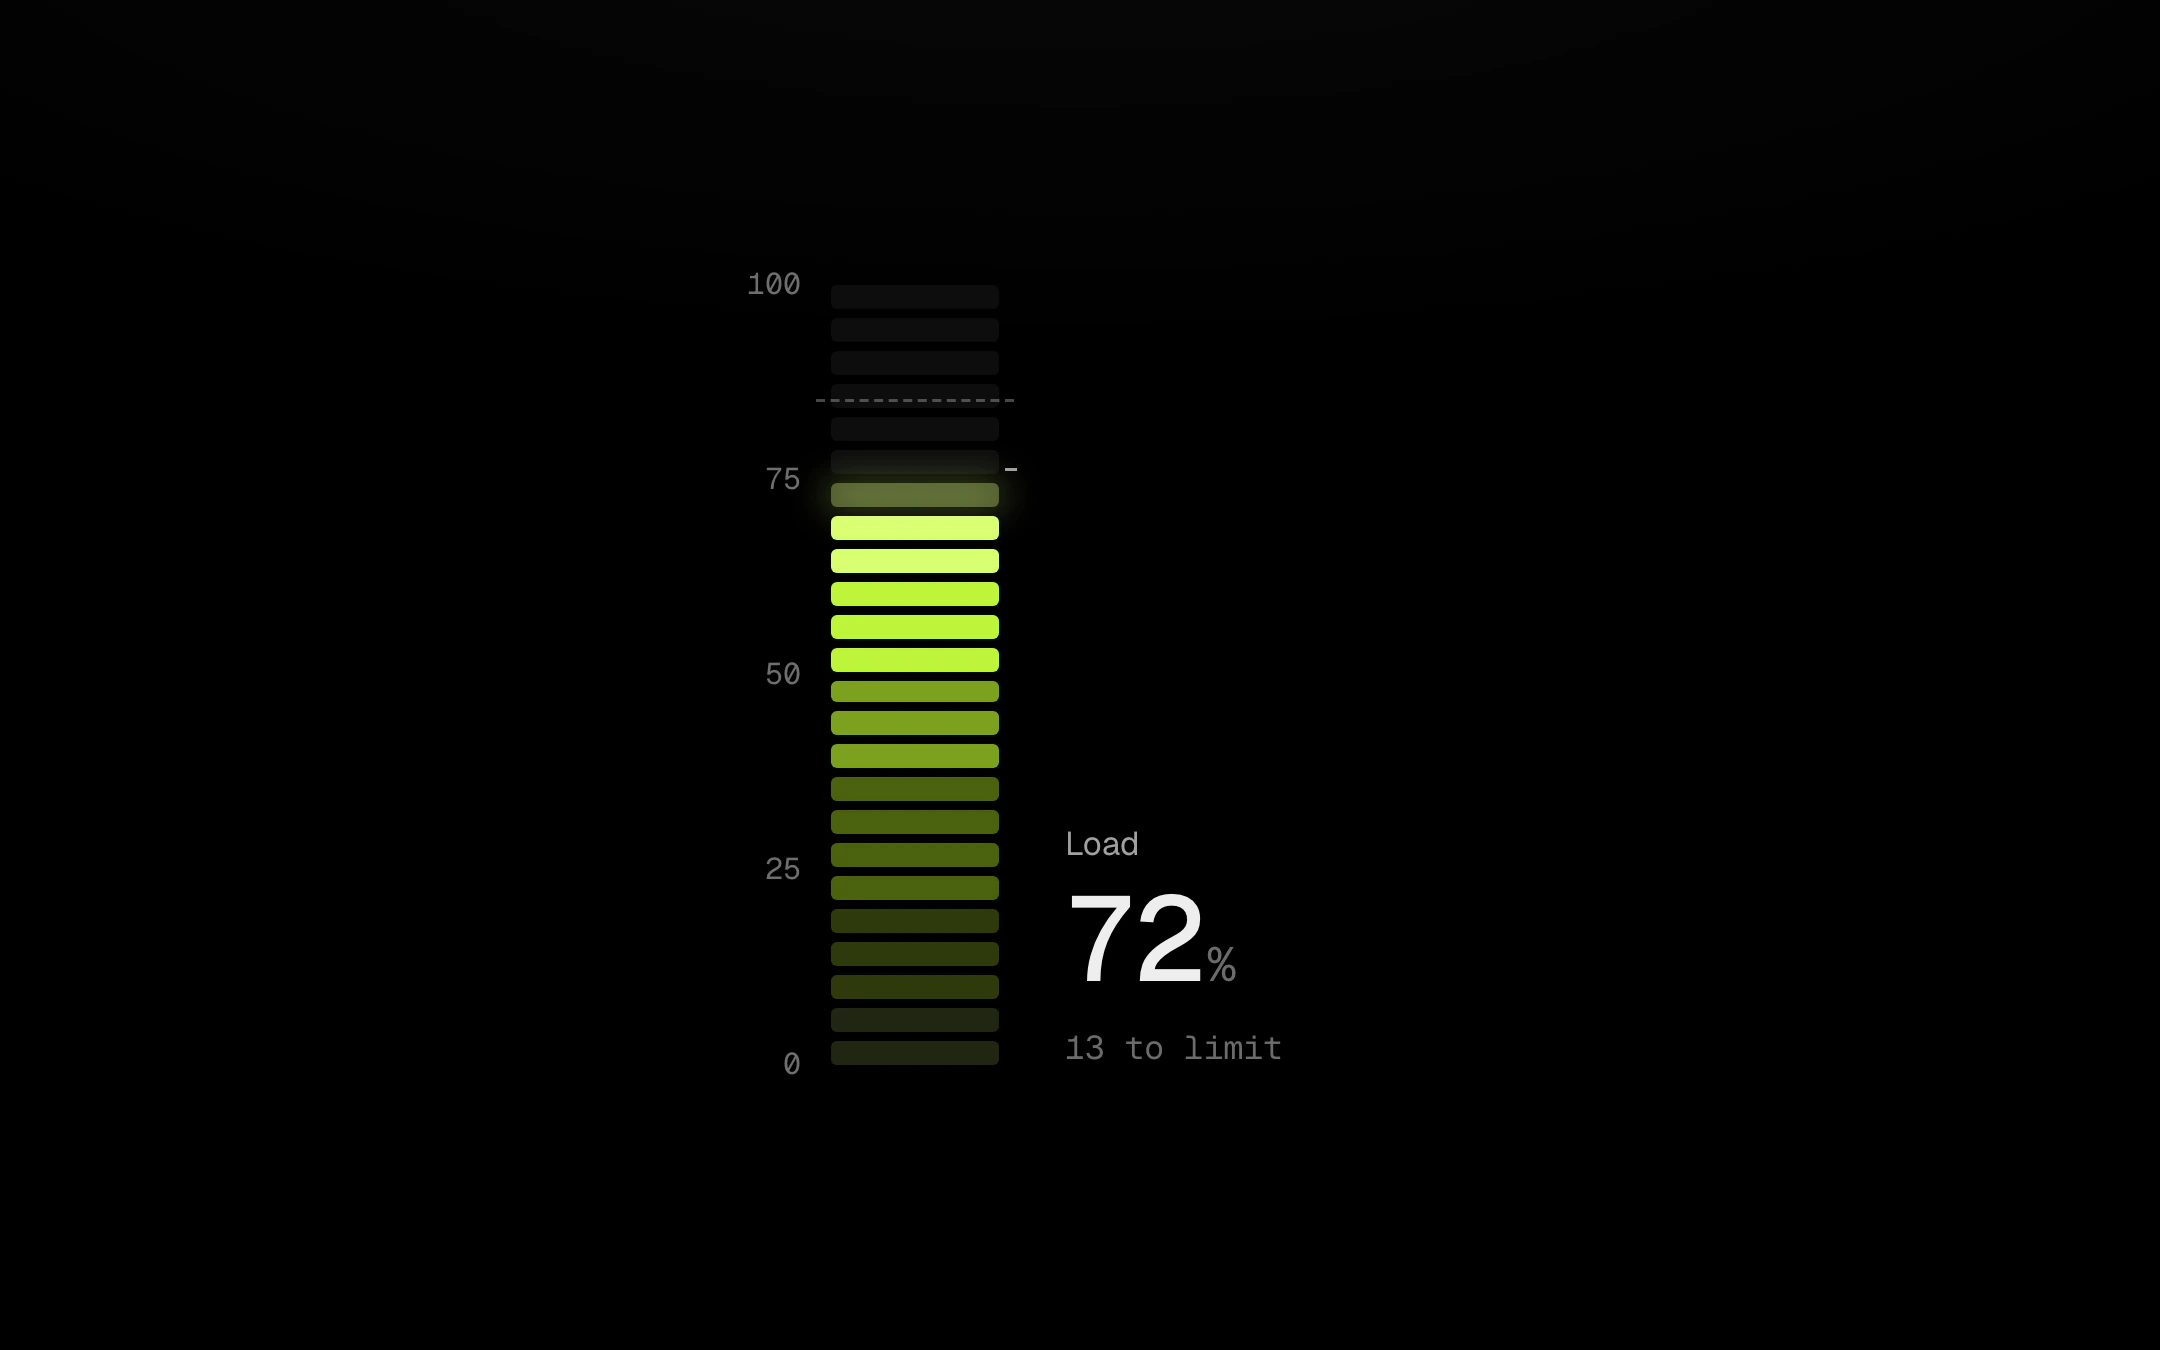
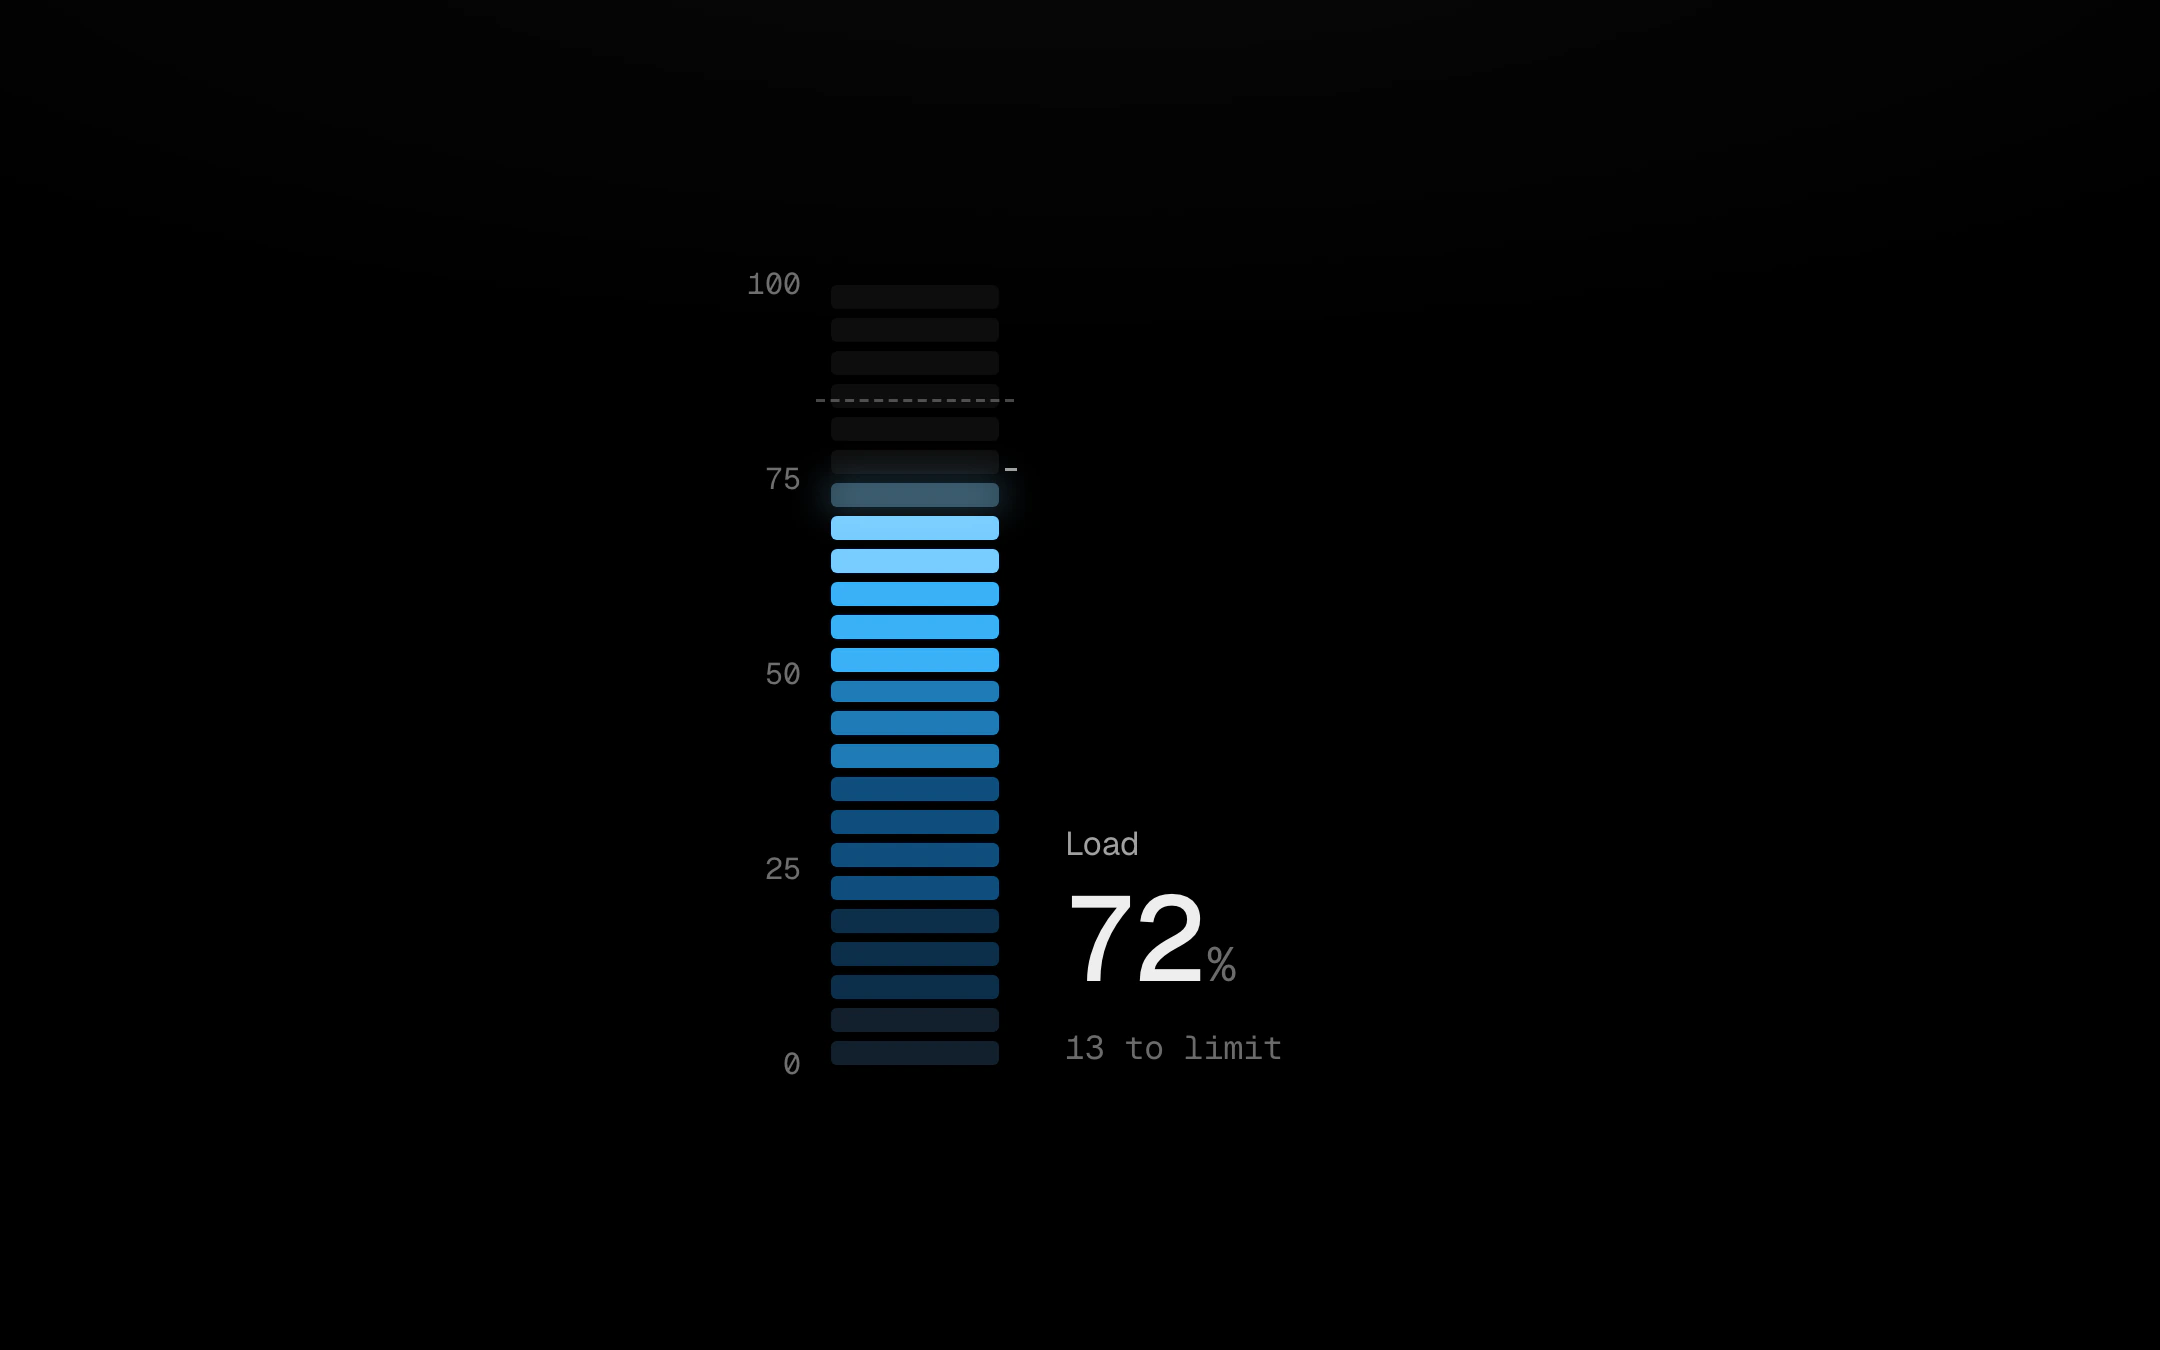
A vertical segmented gauge lit like a kiln.
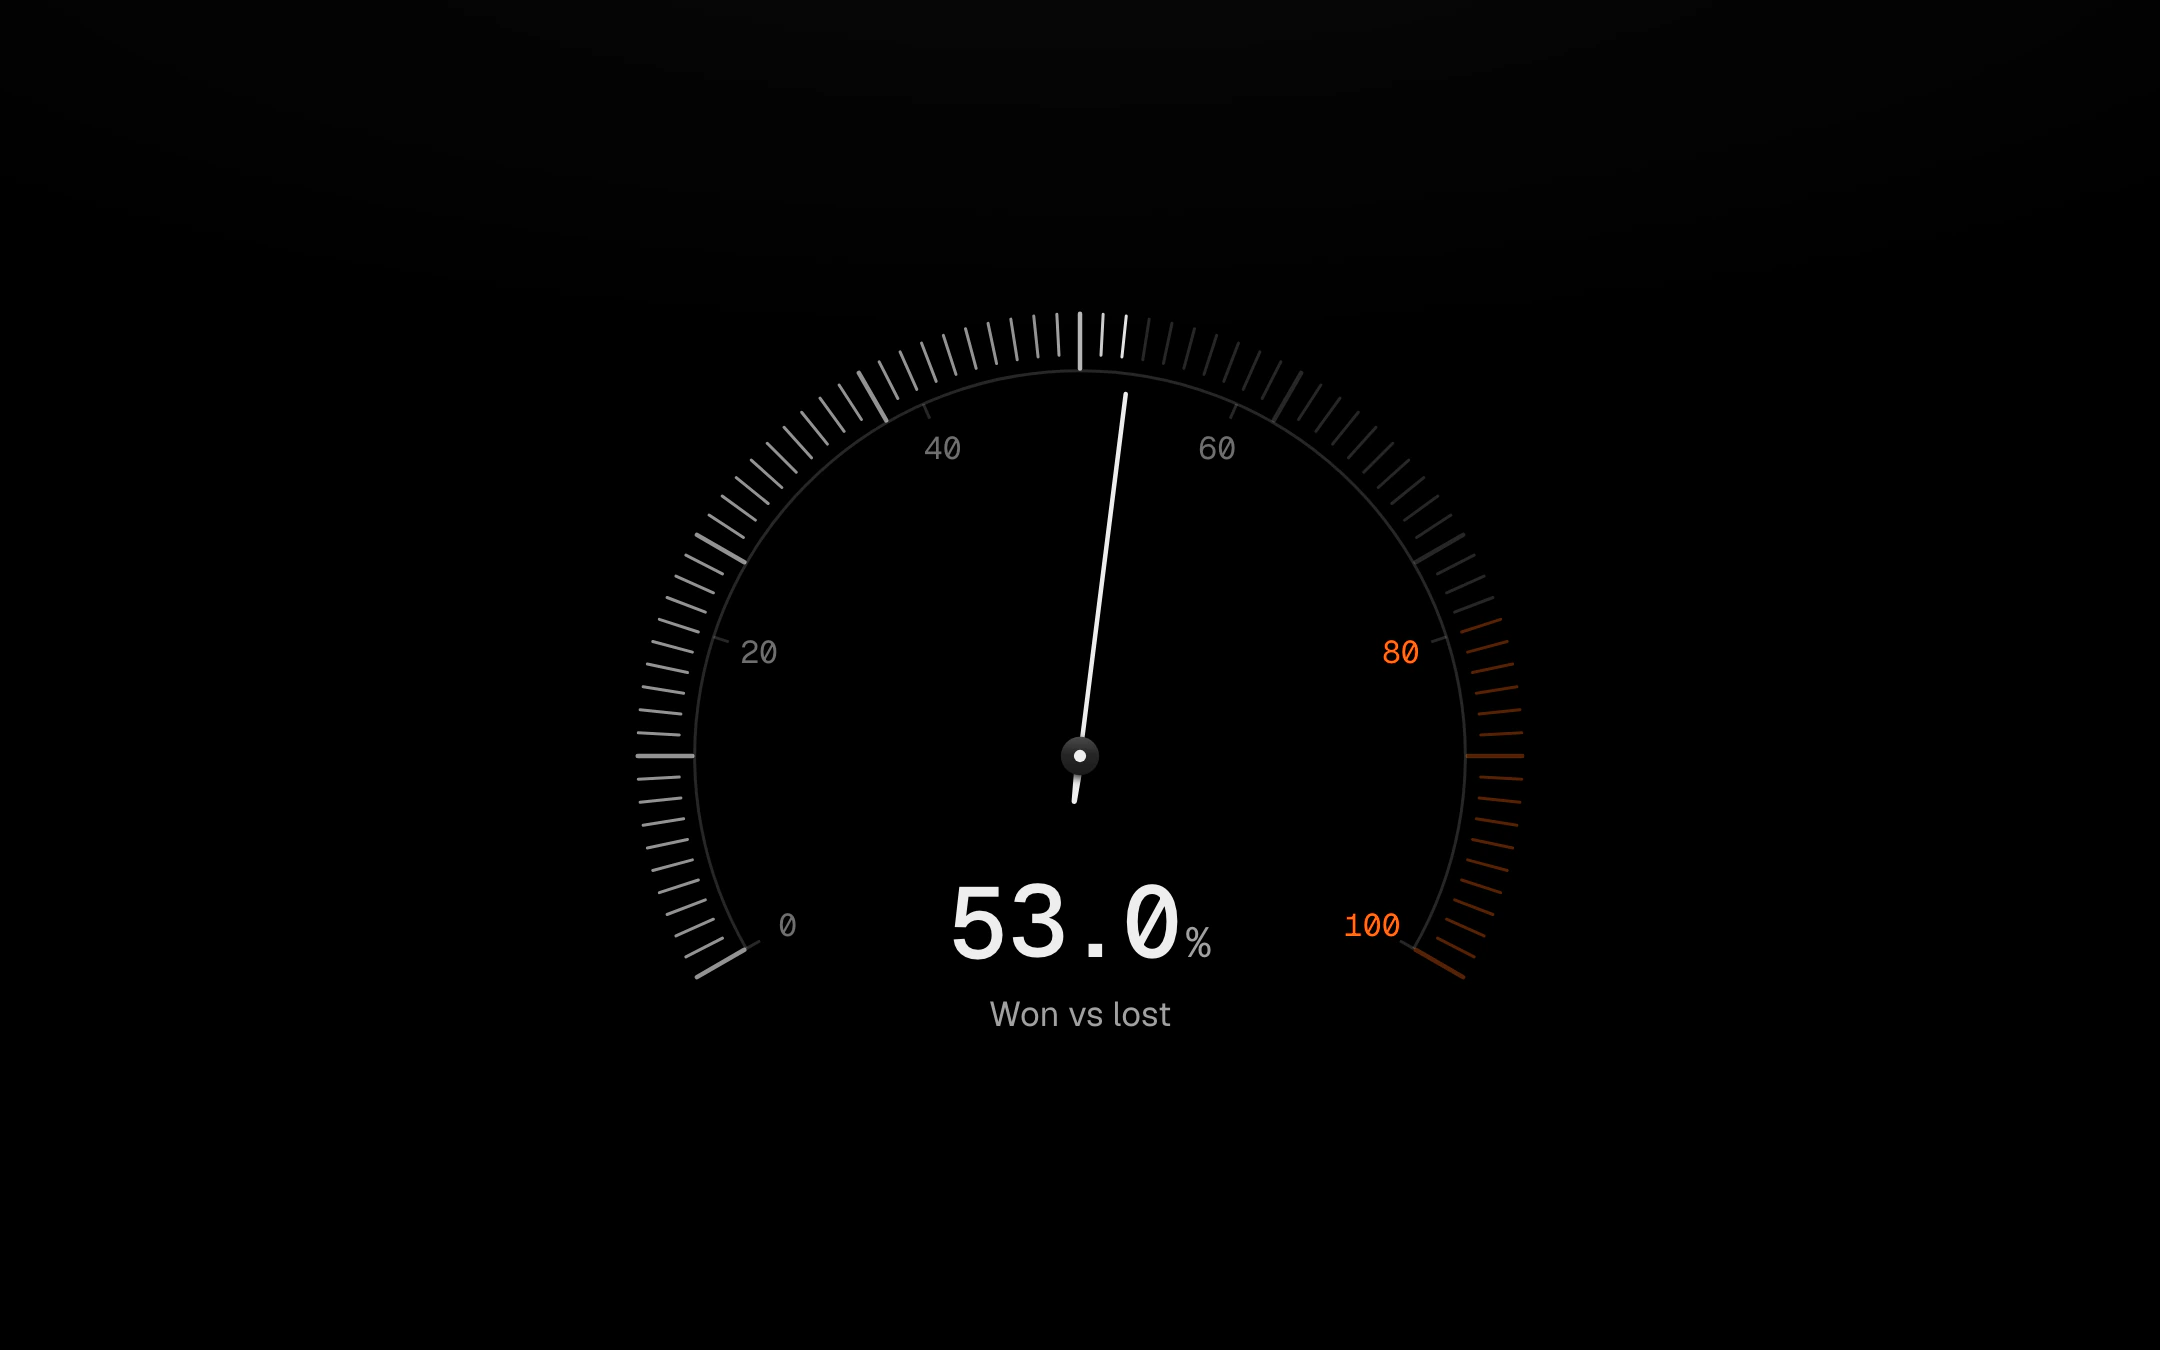
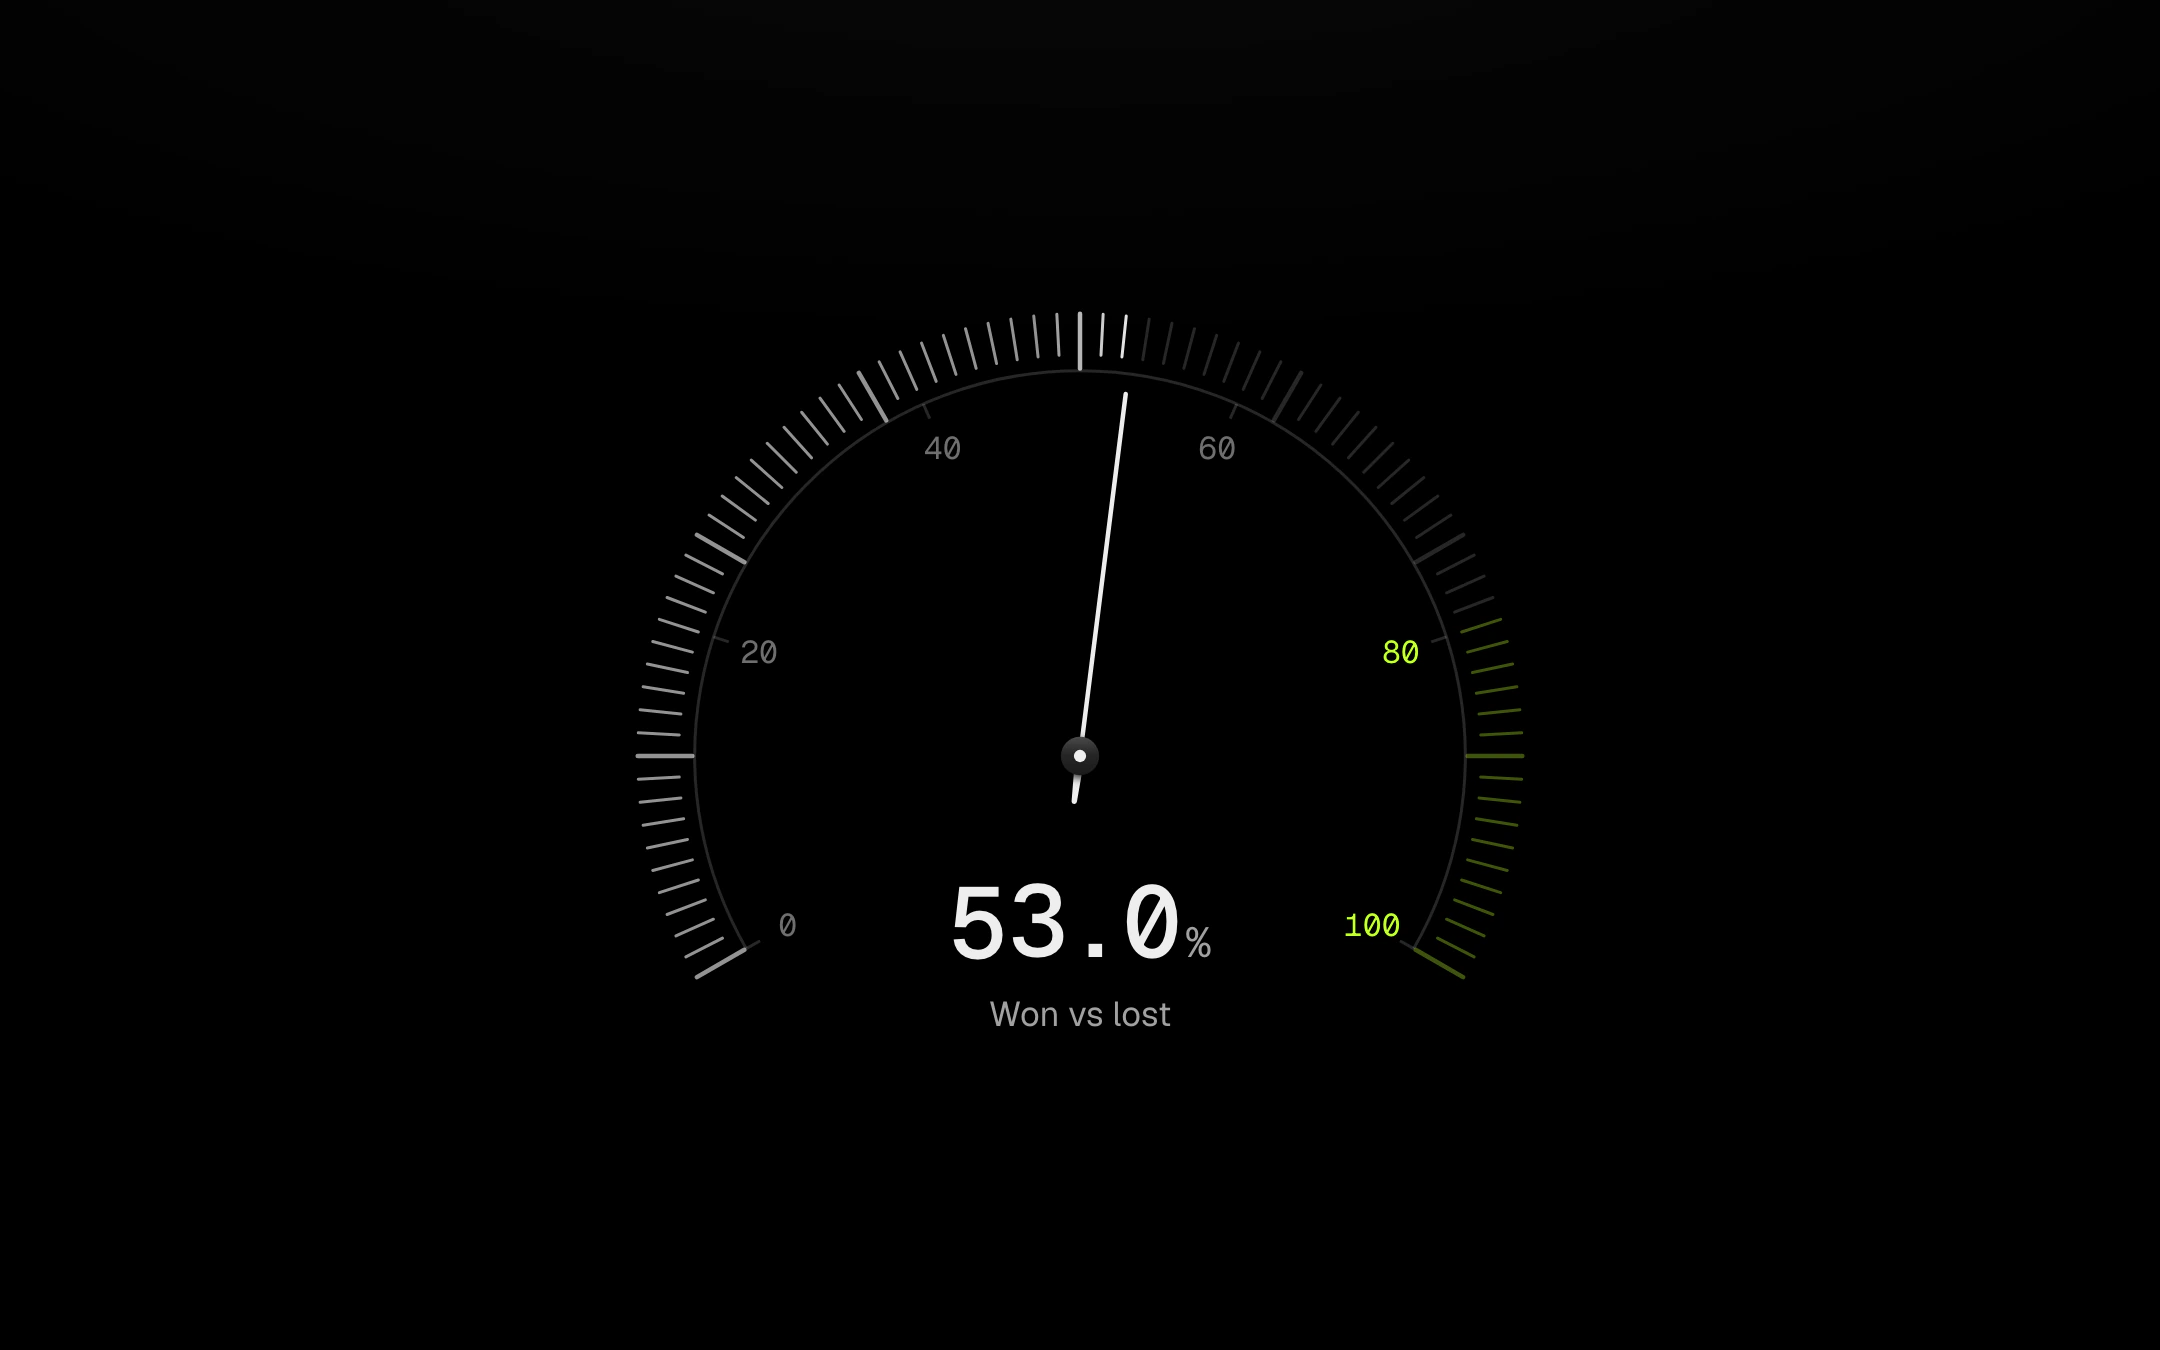
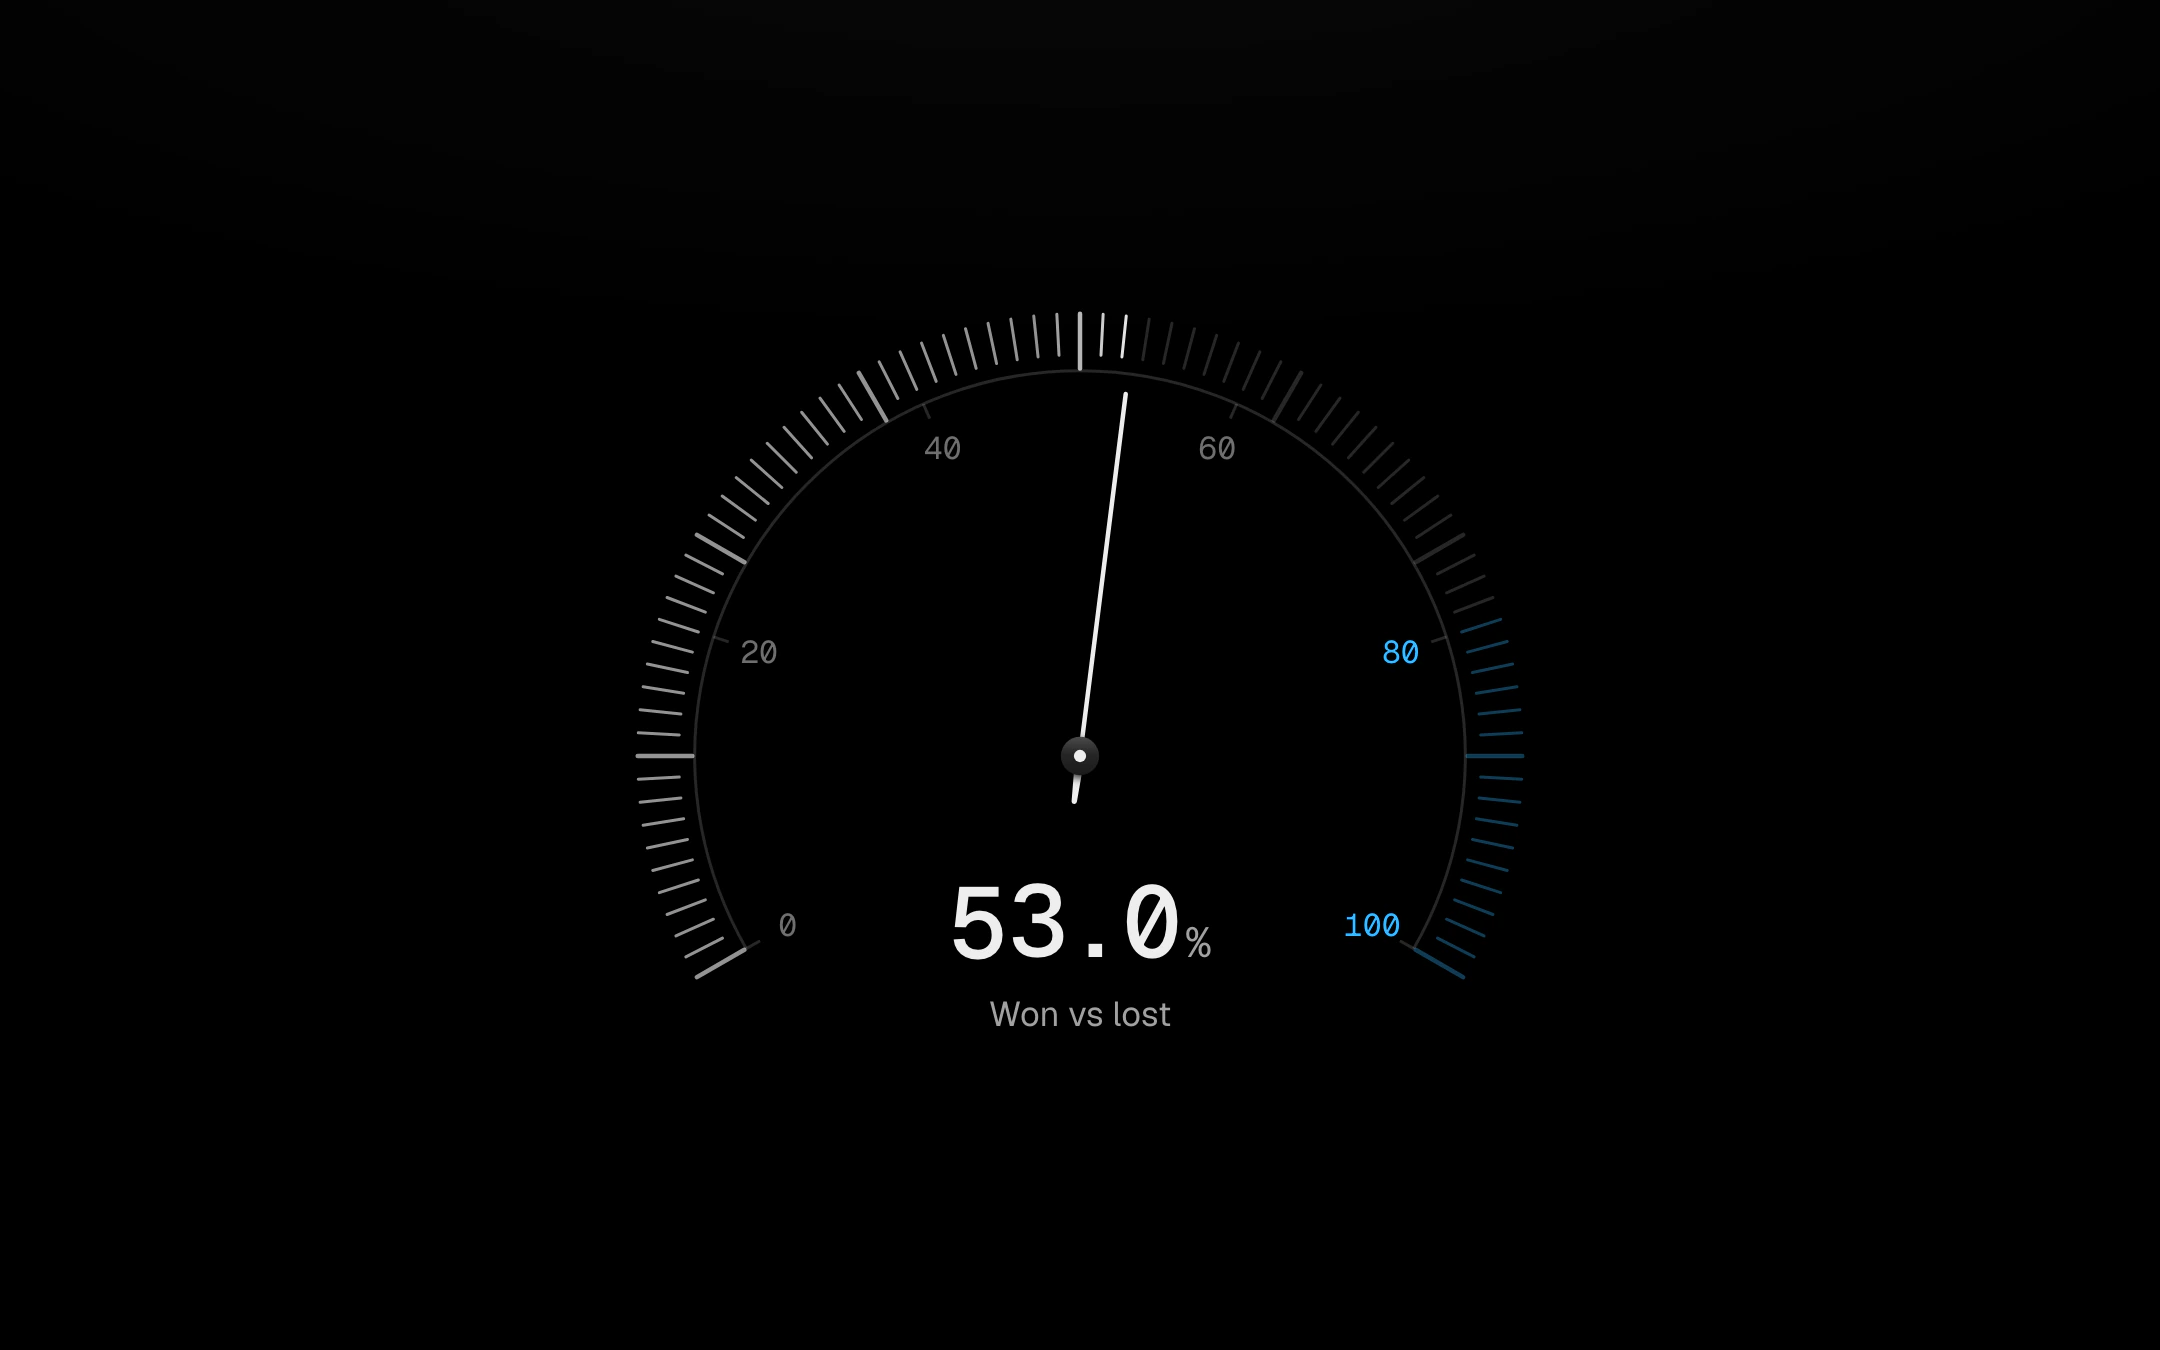
One dial, four faces.
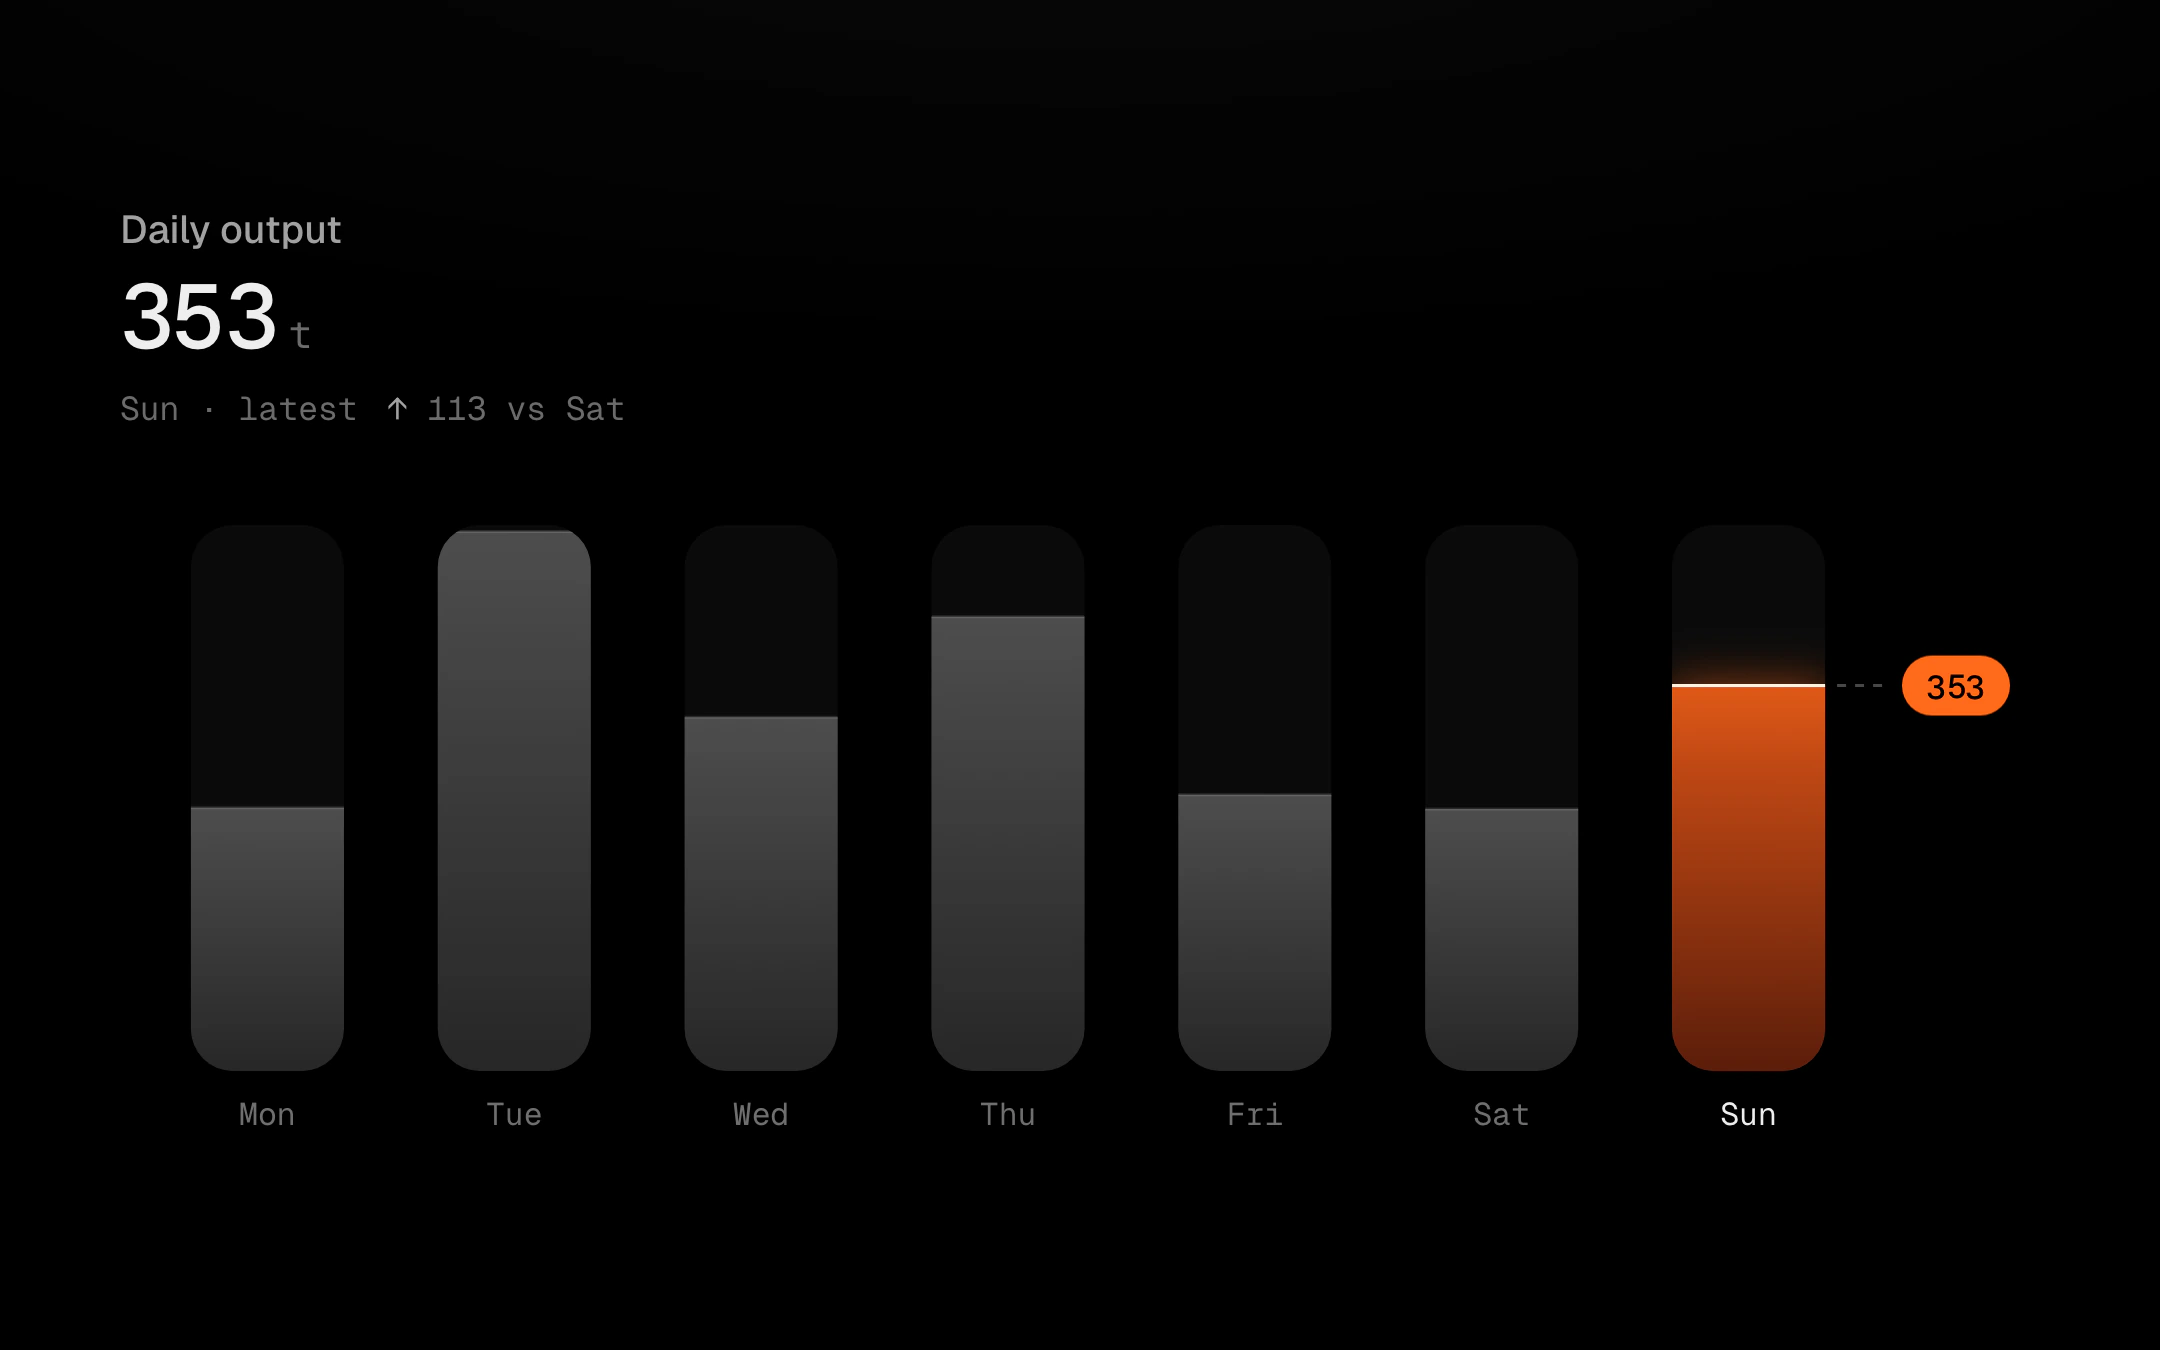
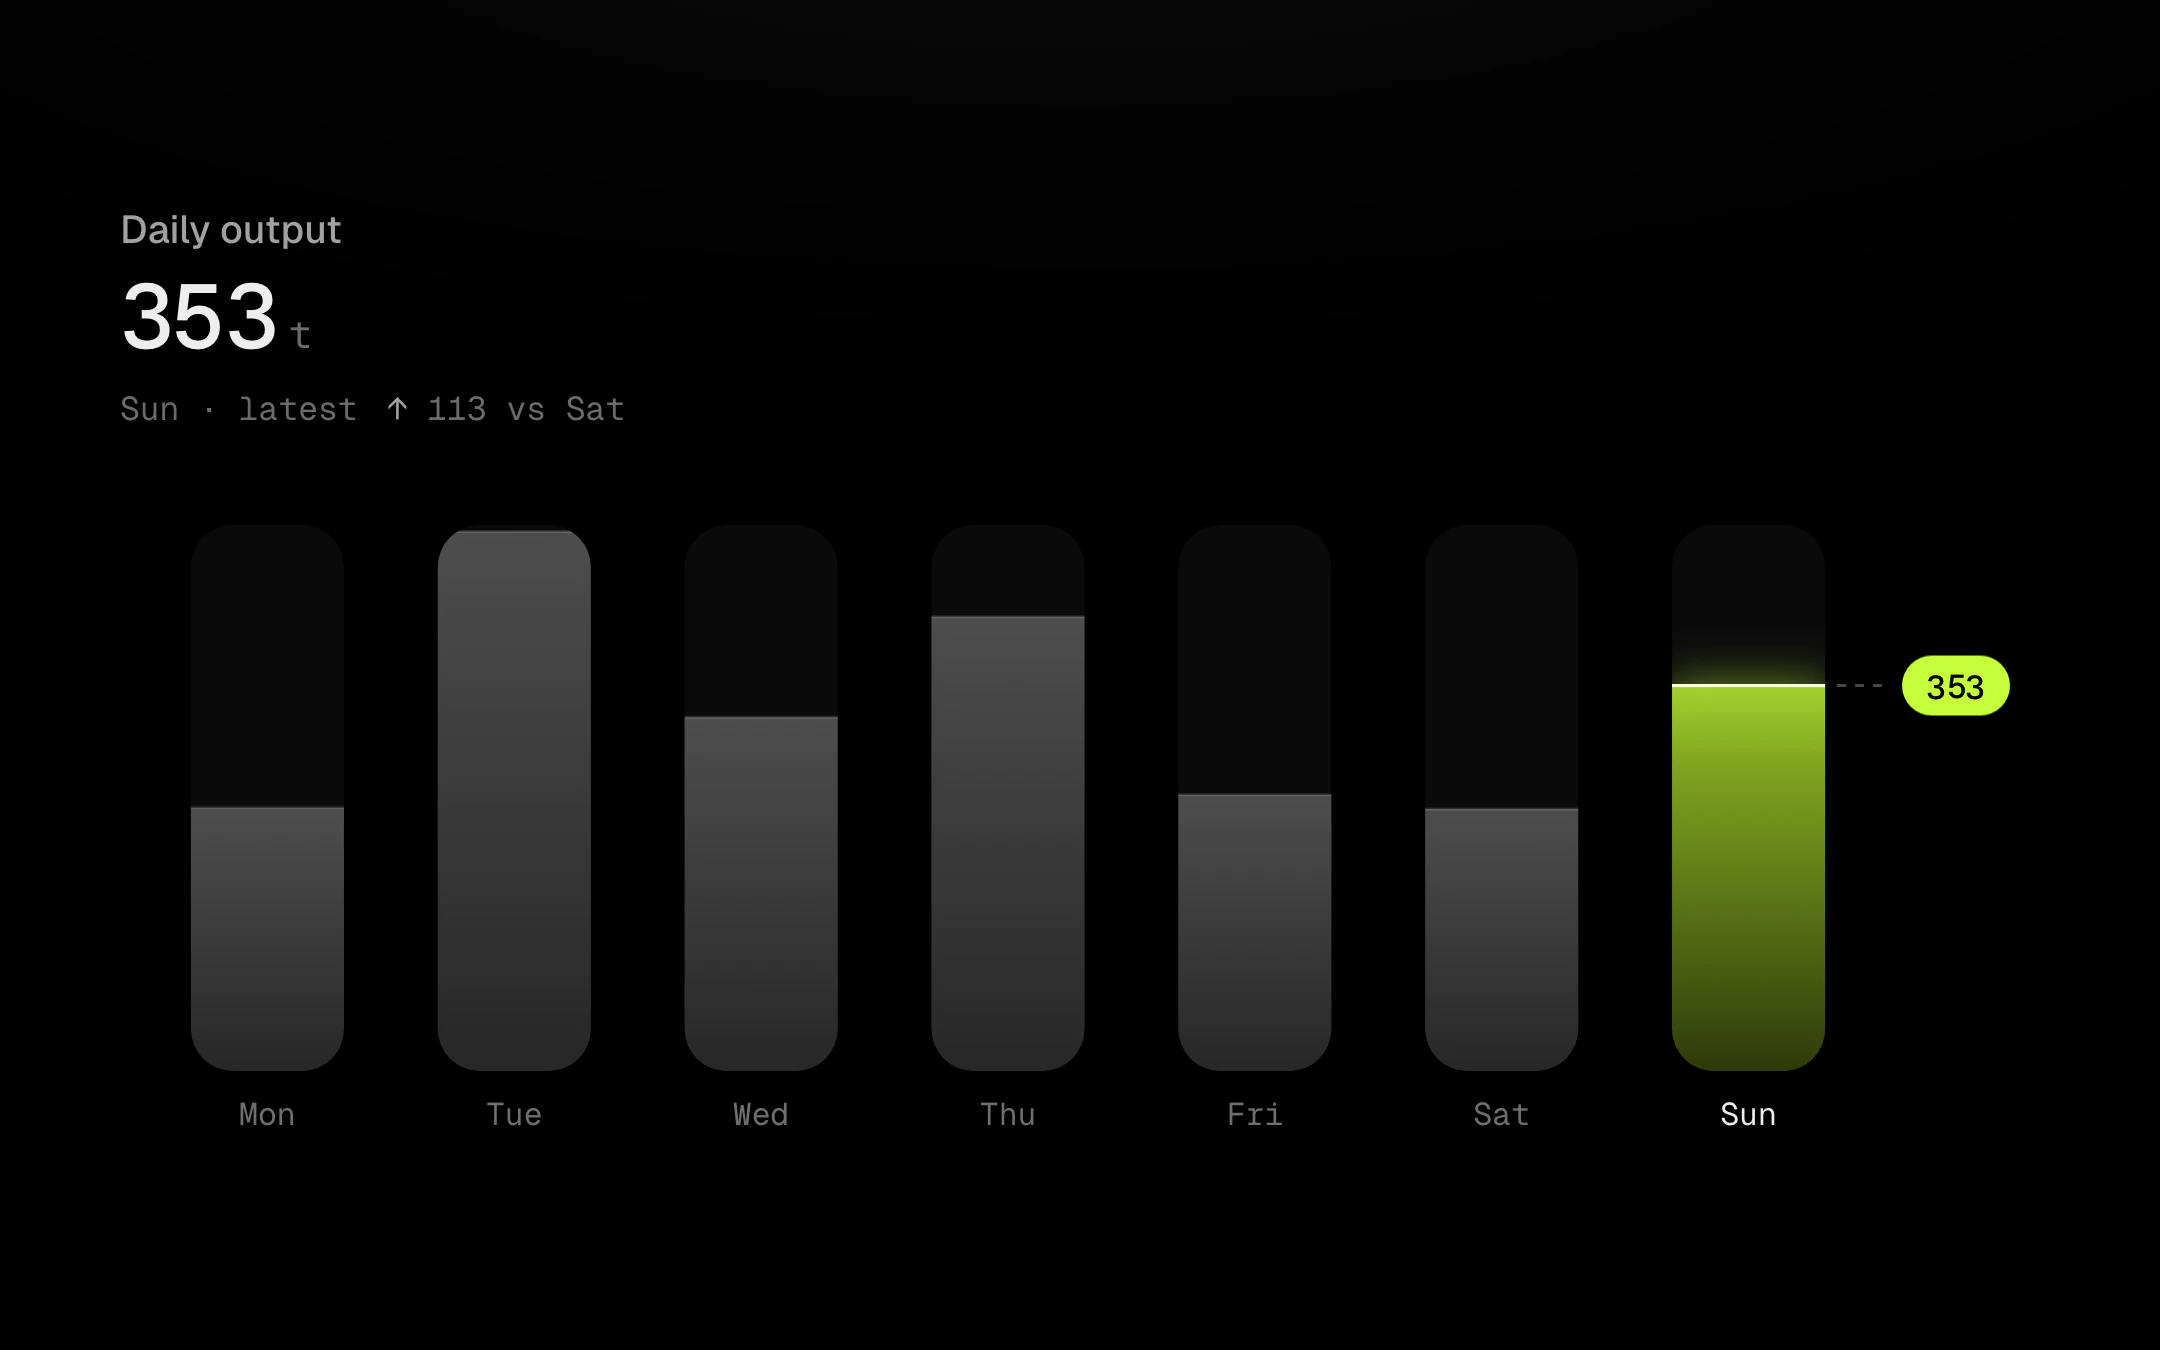
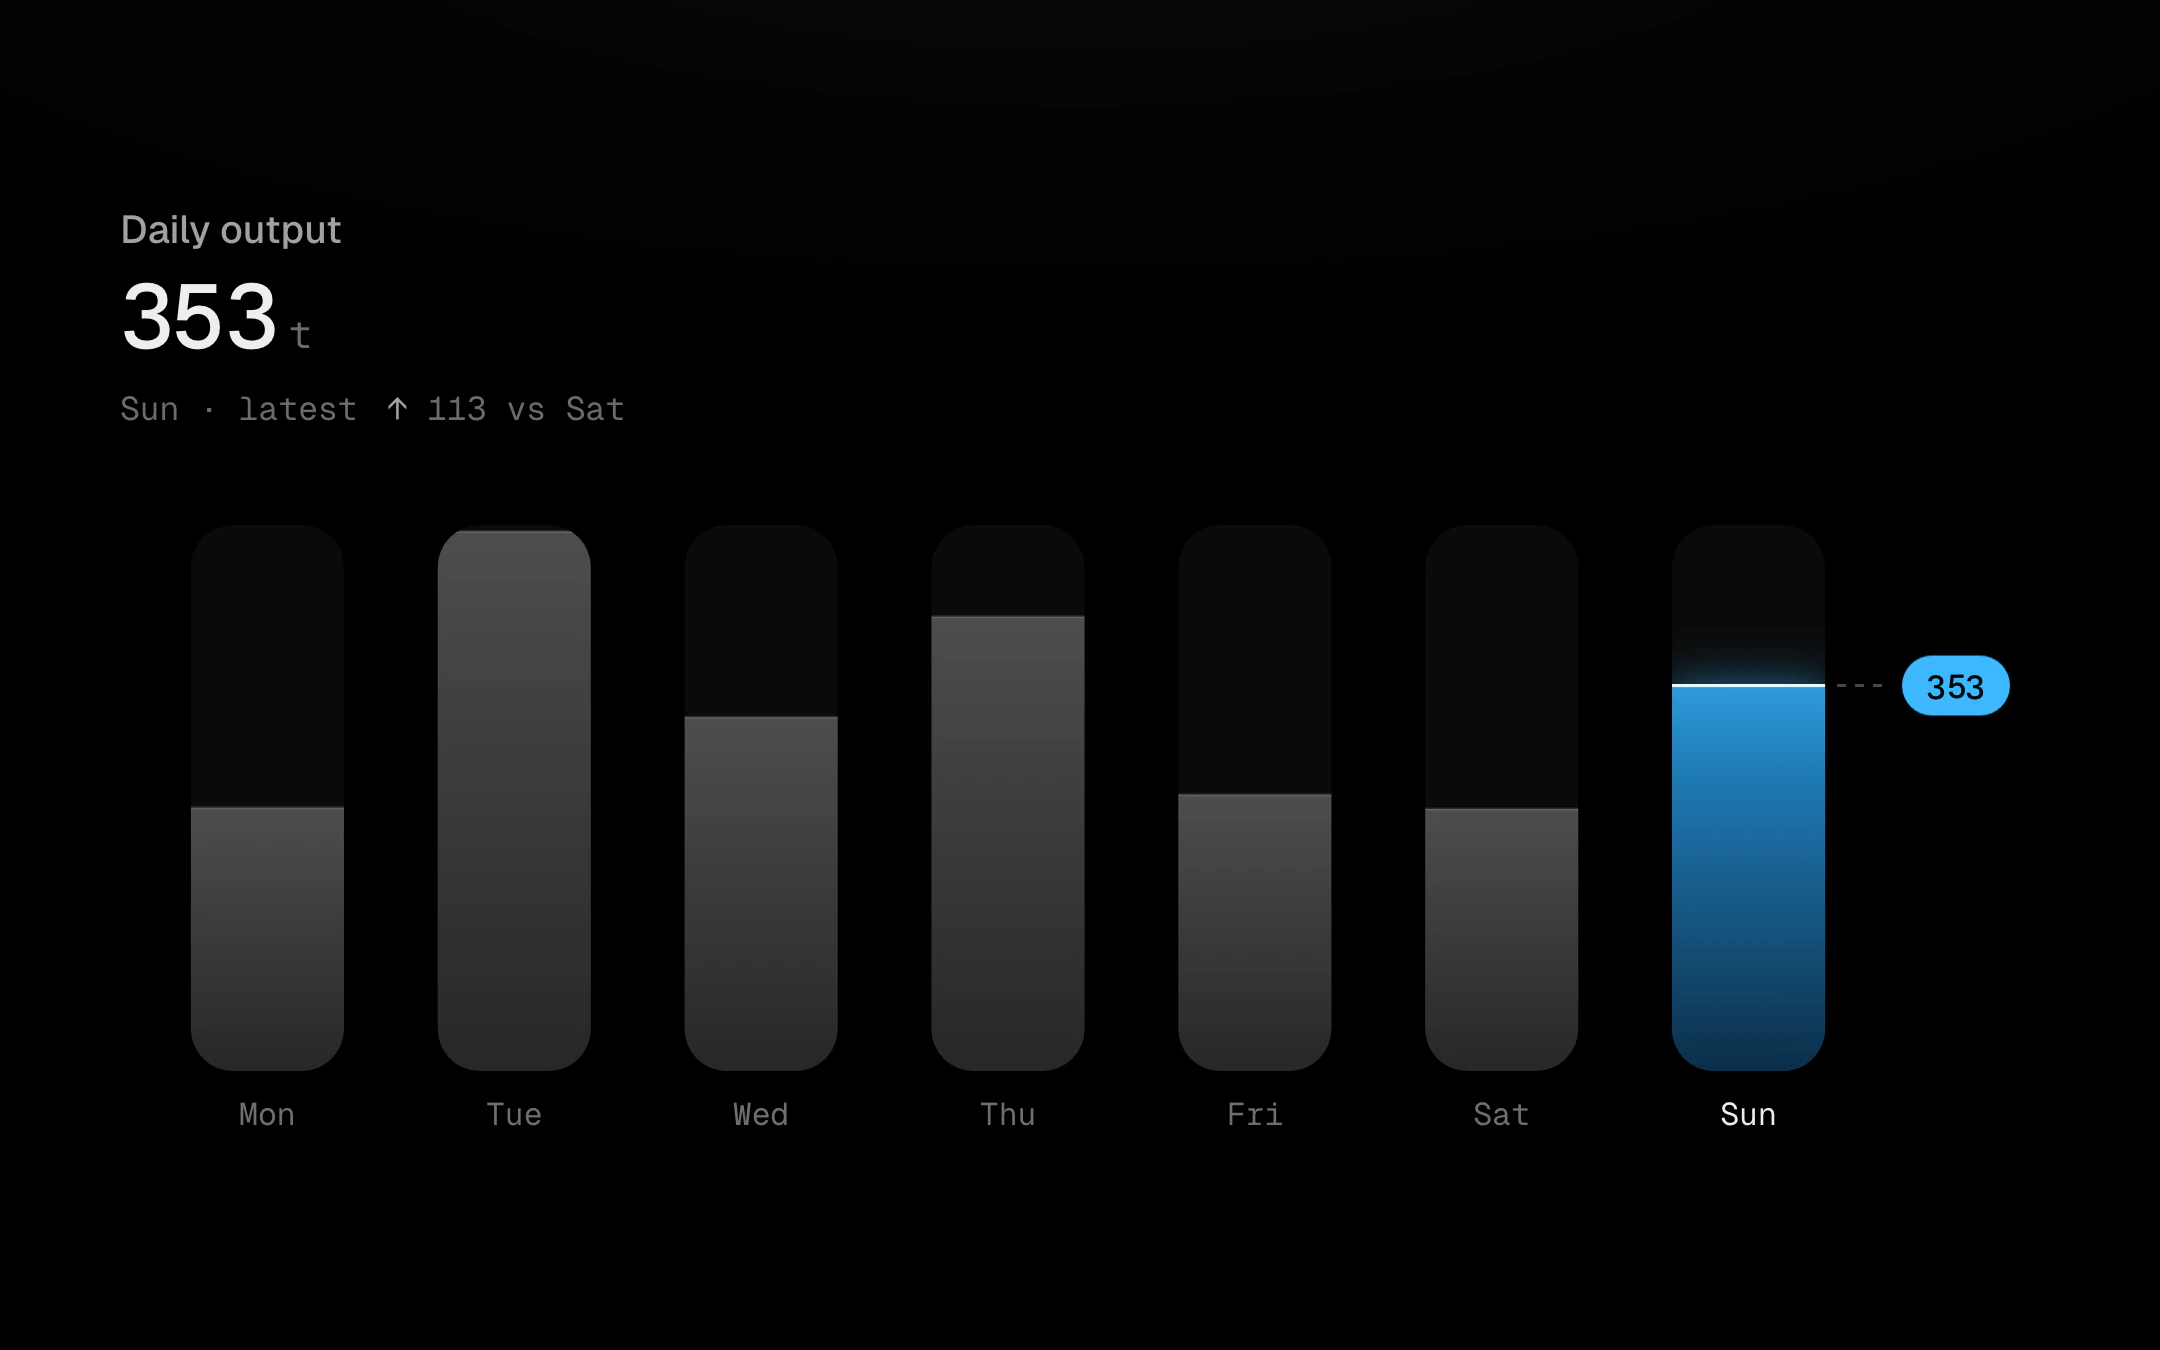
One vessel per day, each filled to its value with molten metal.
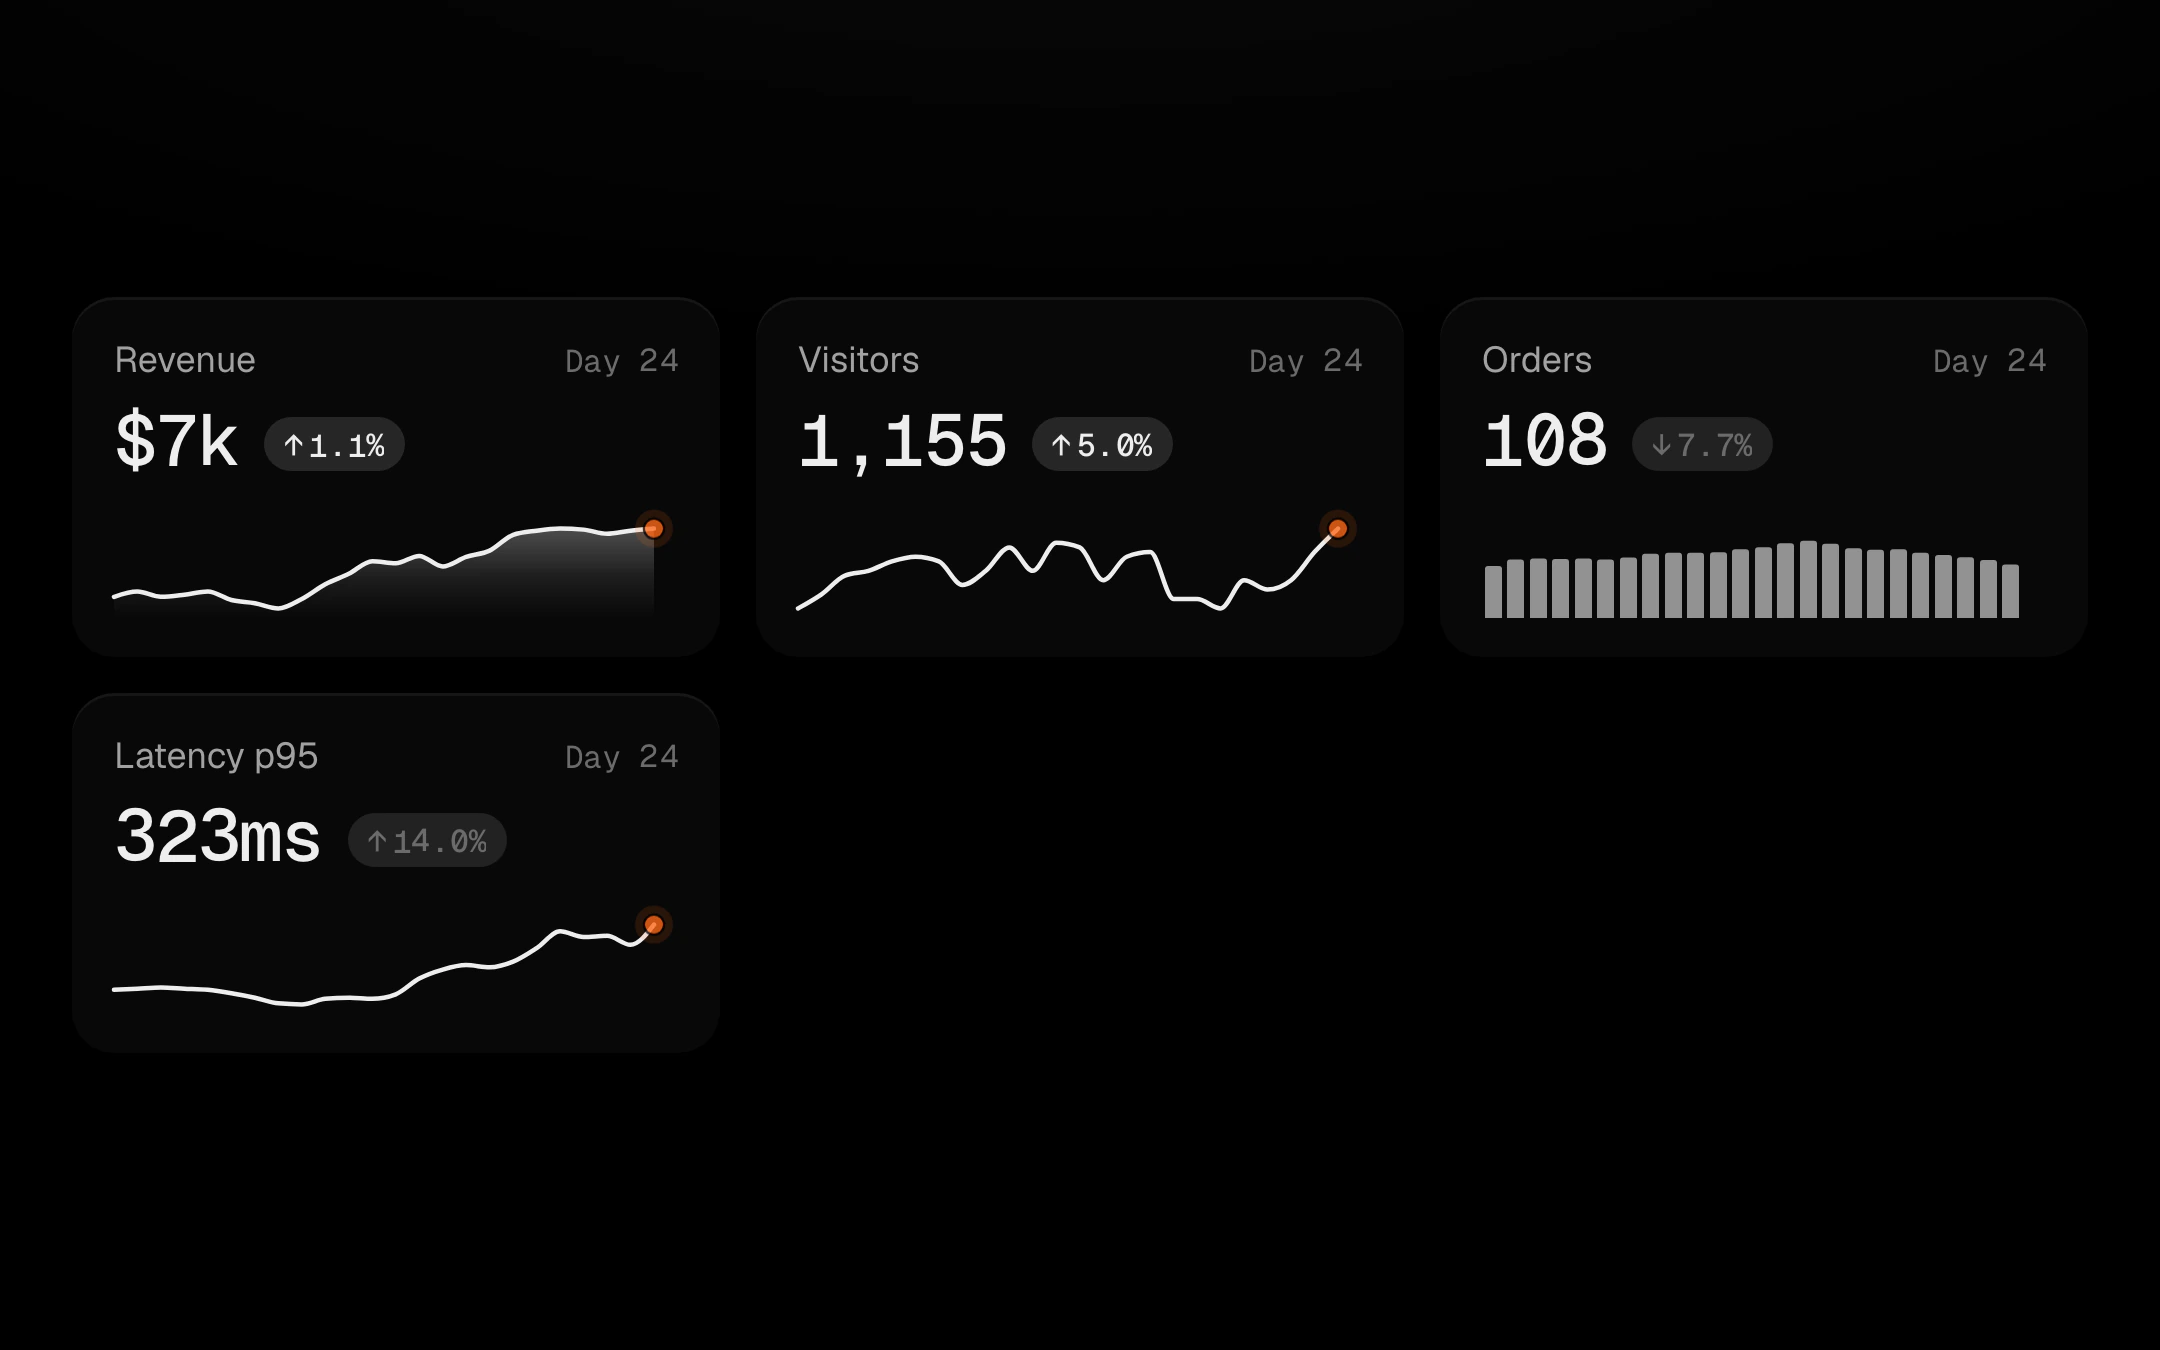
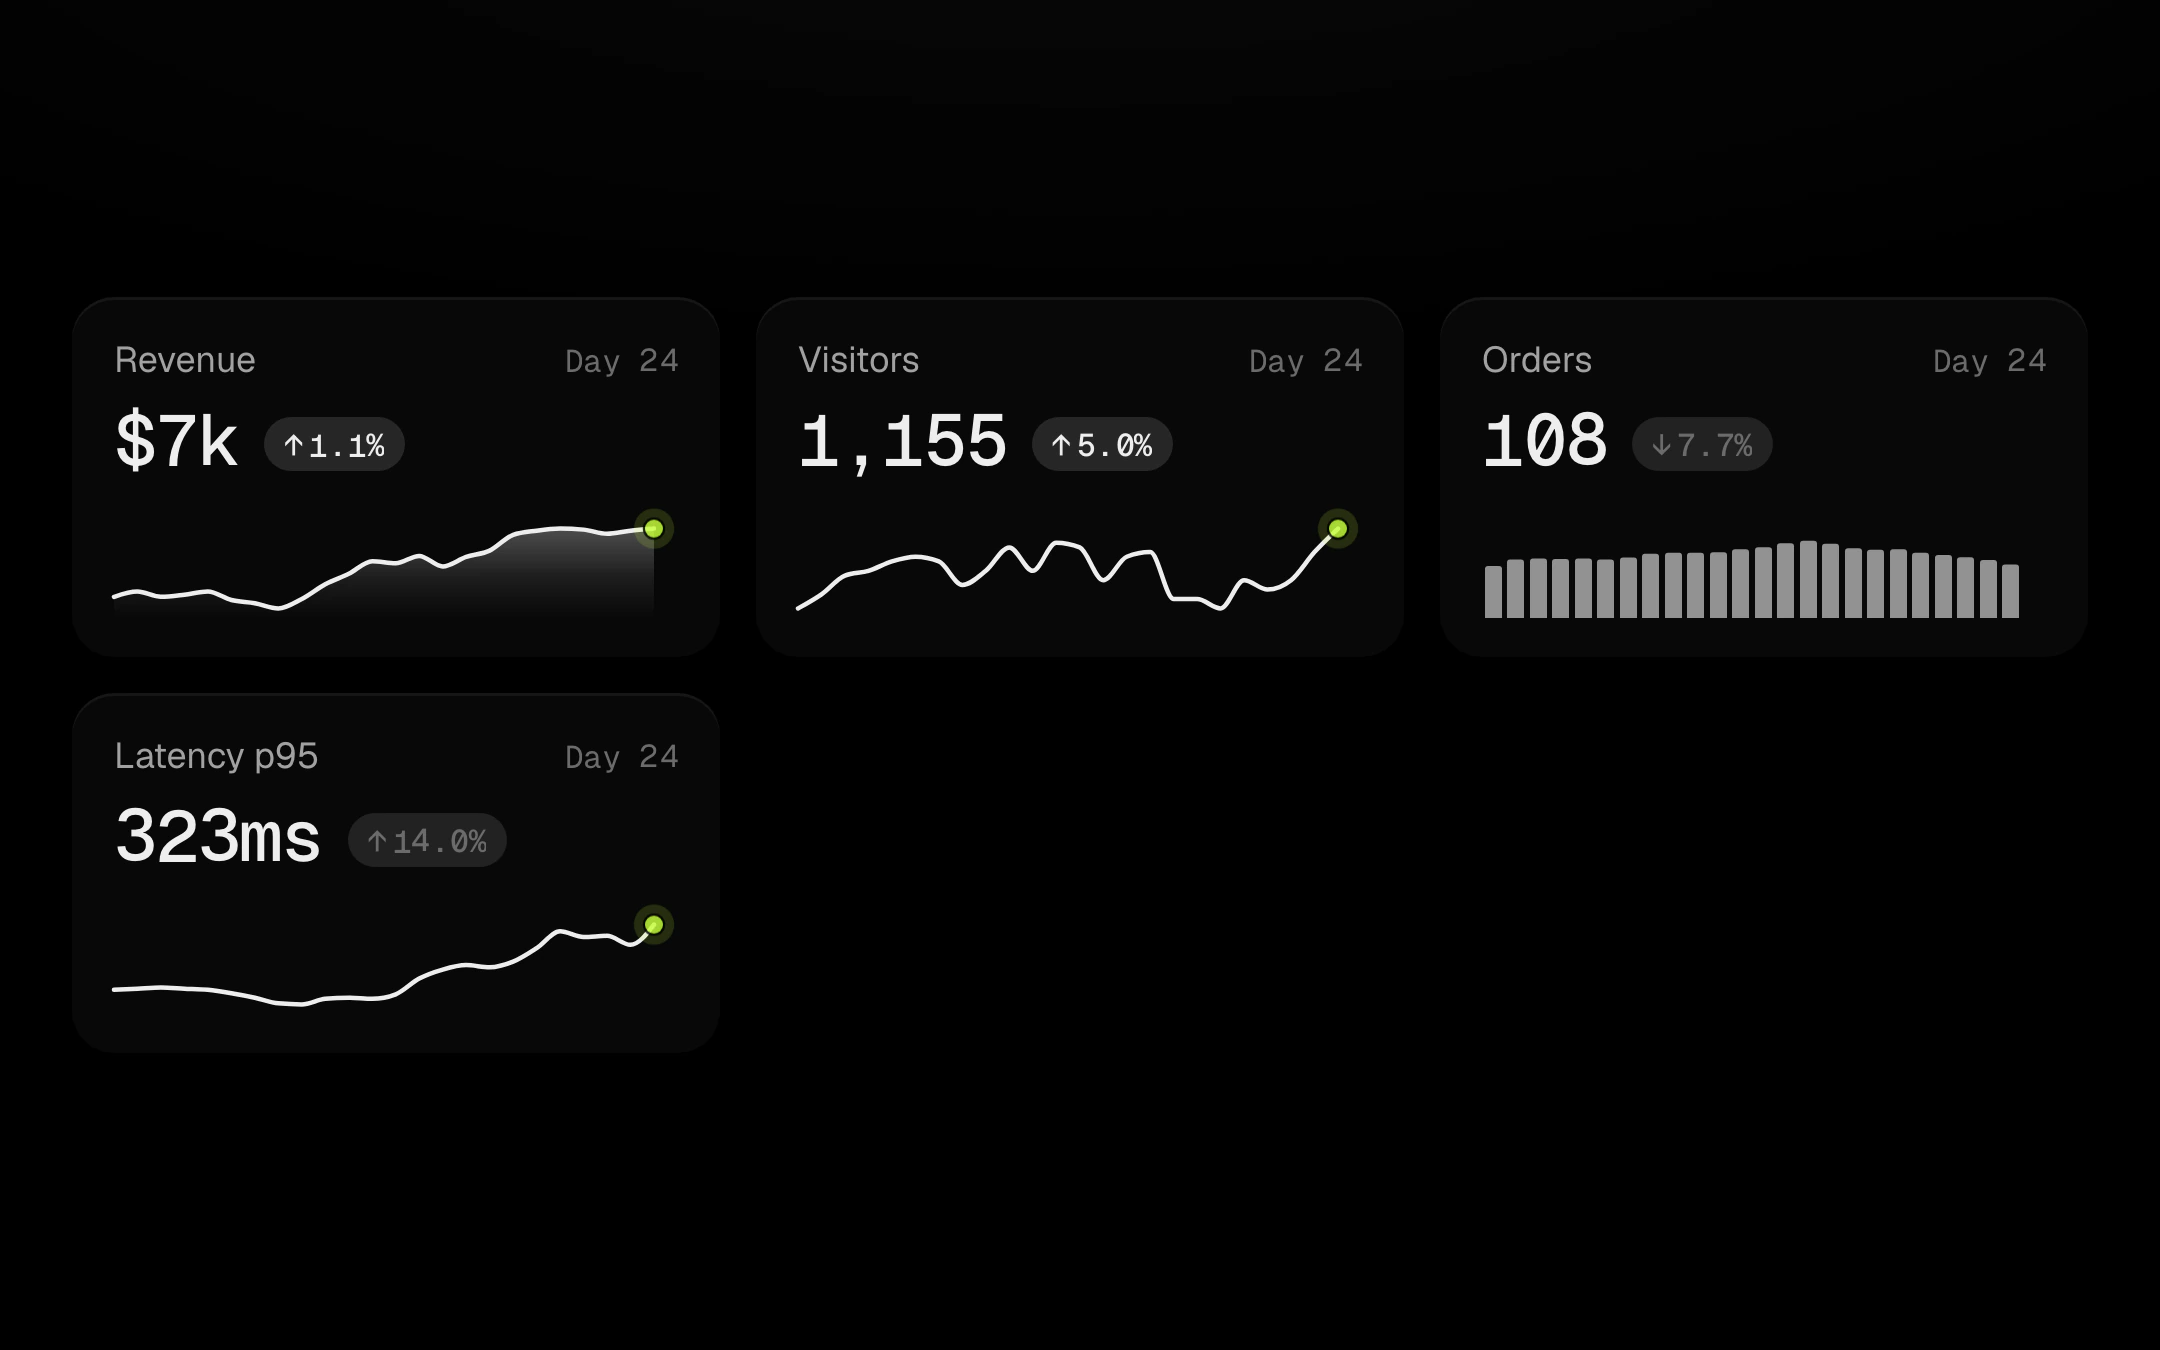
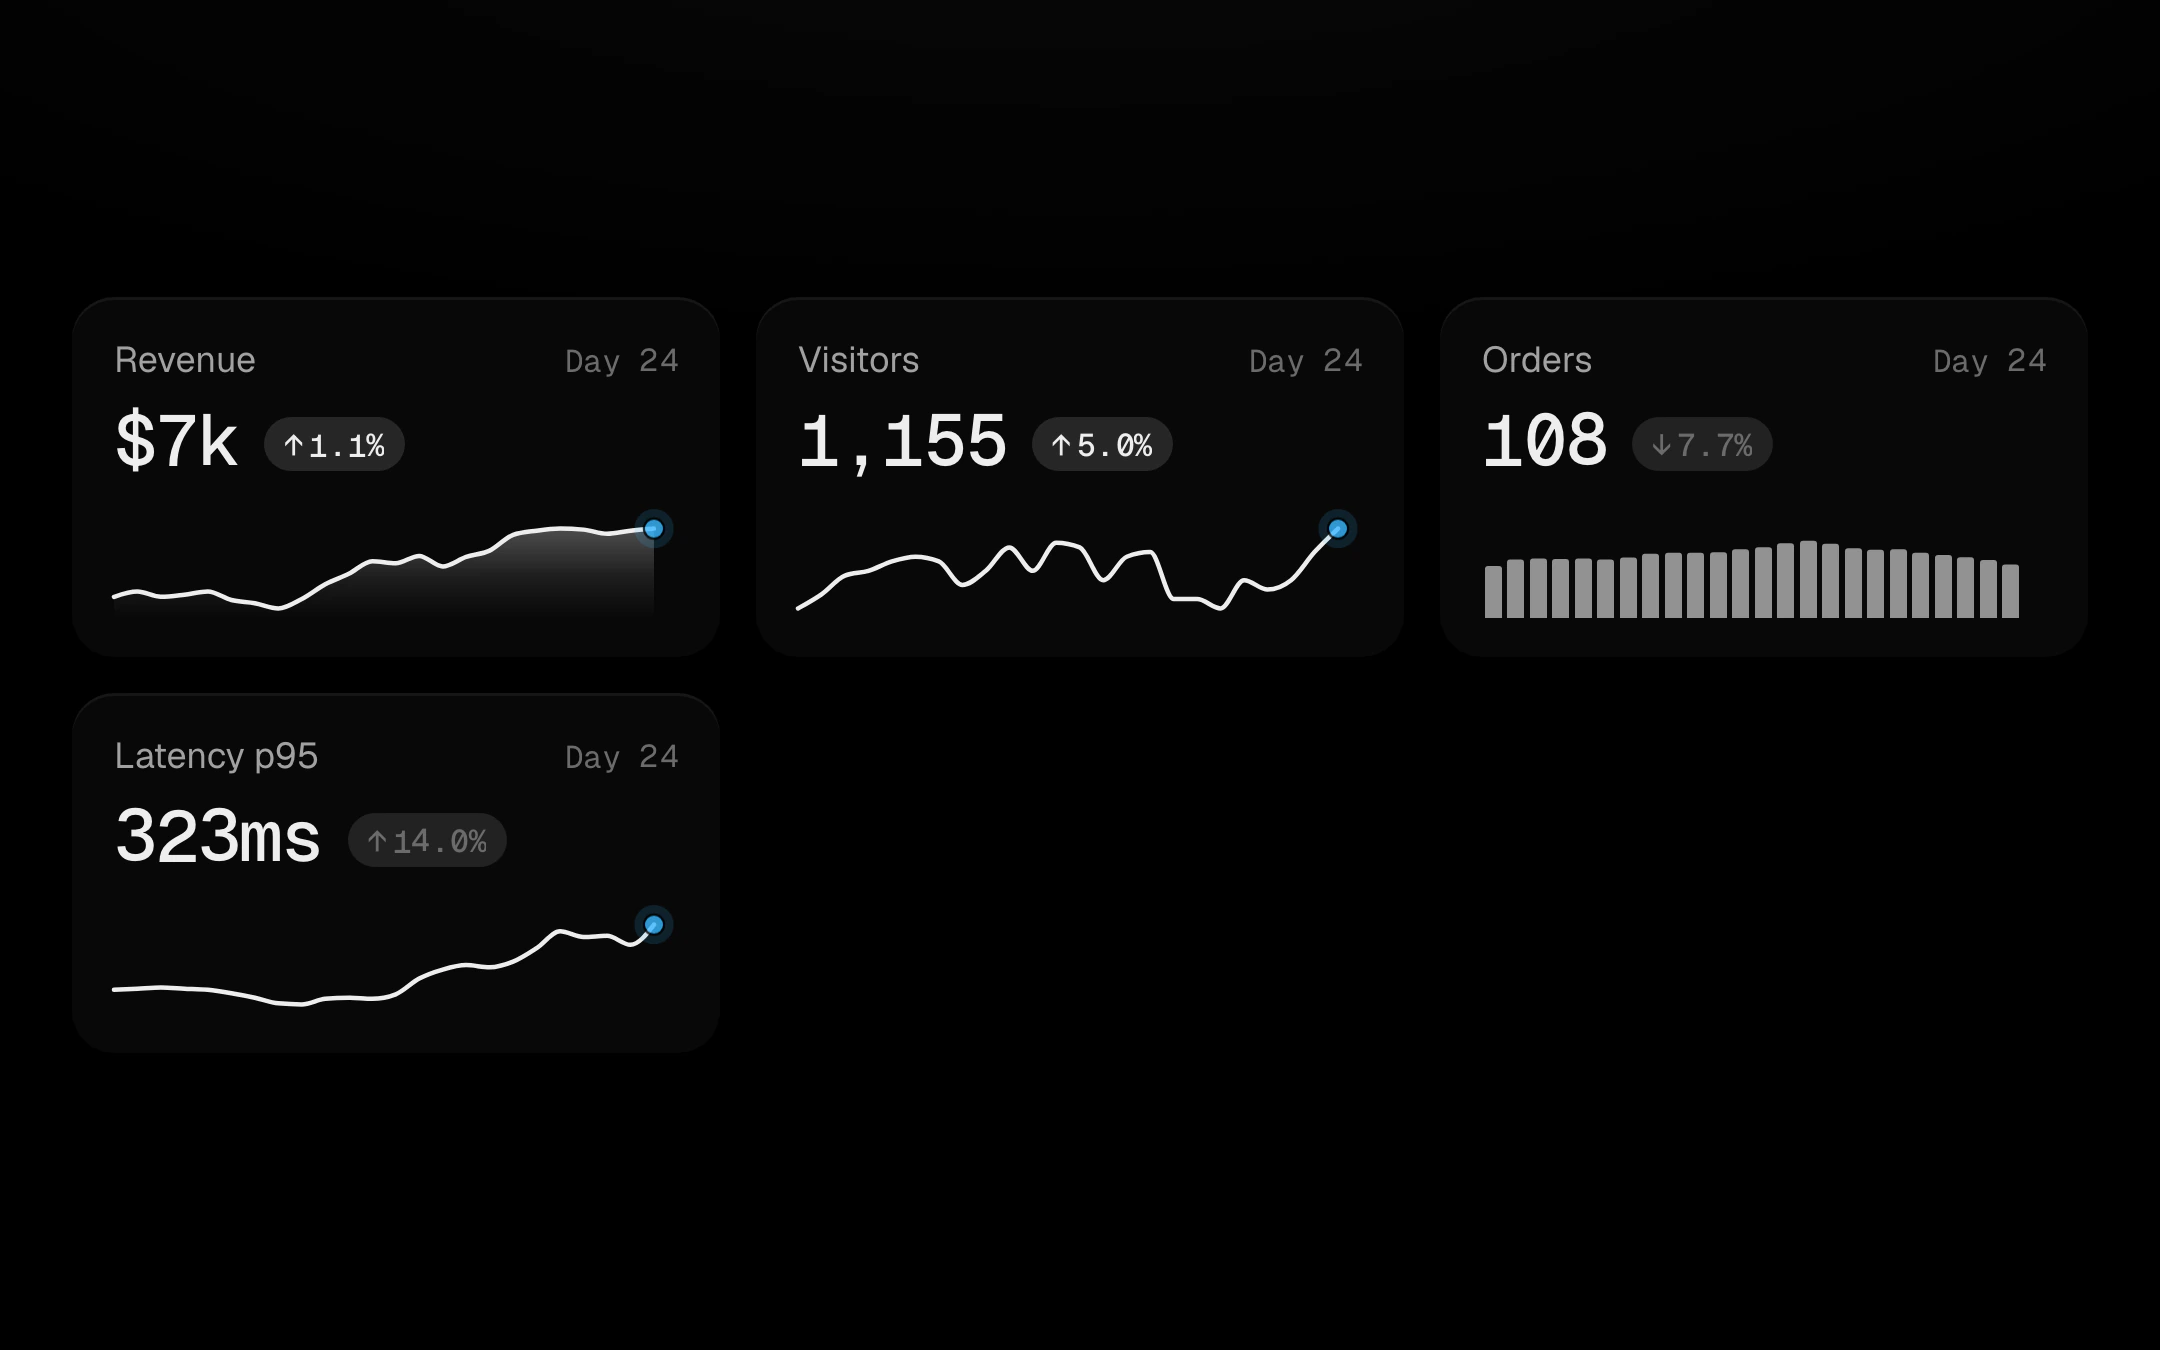
Stat cards whose sparkline is a scrubber for the number above it.
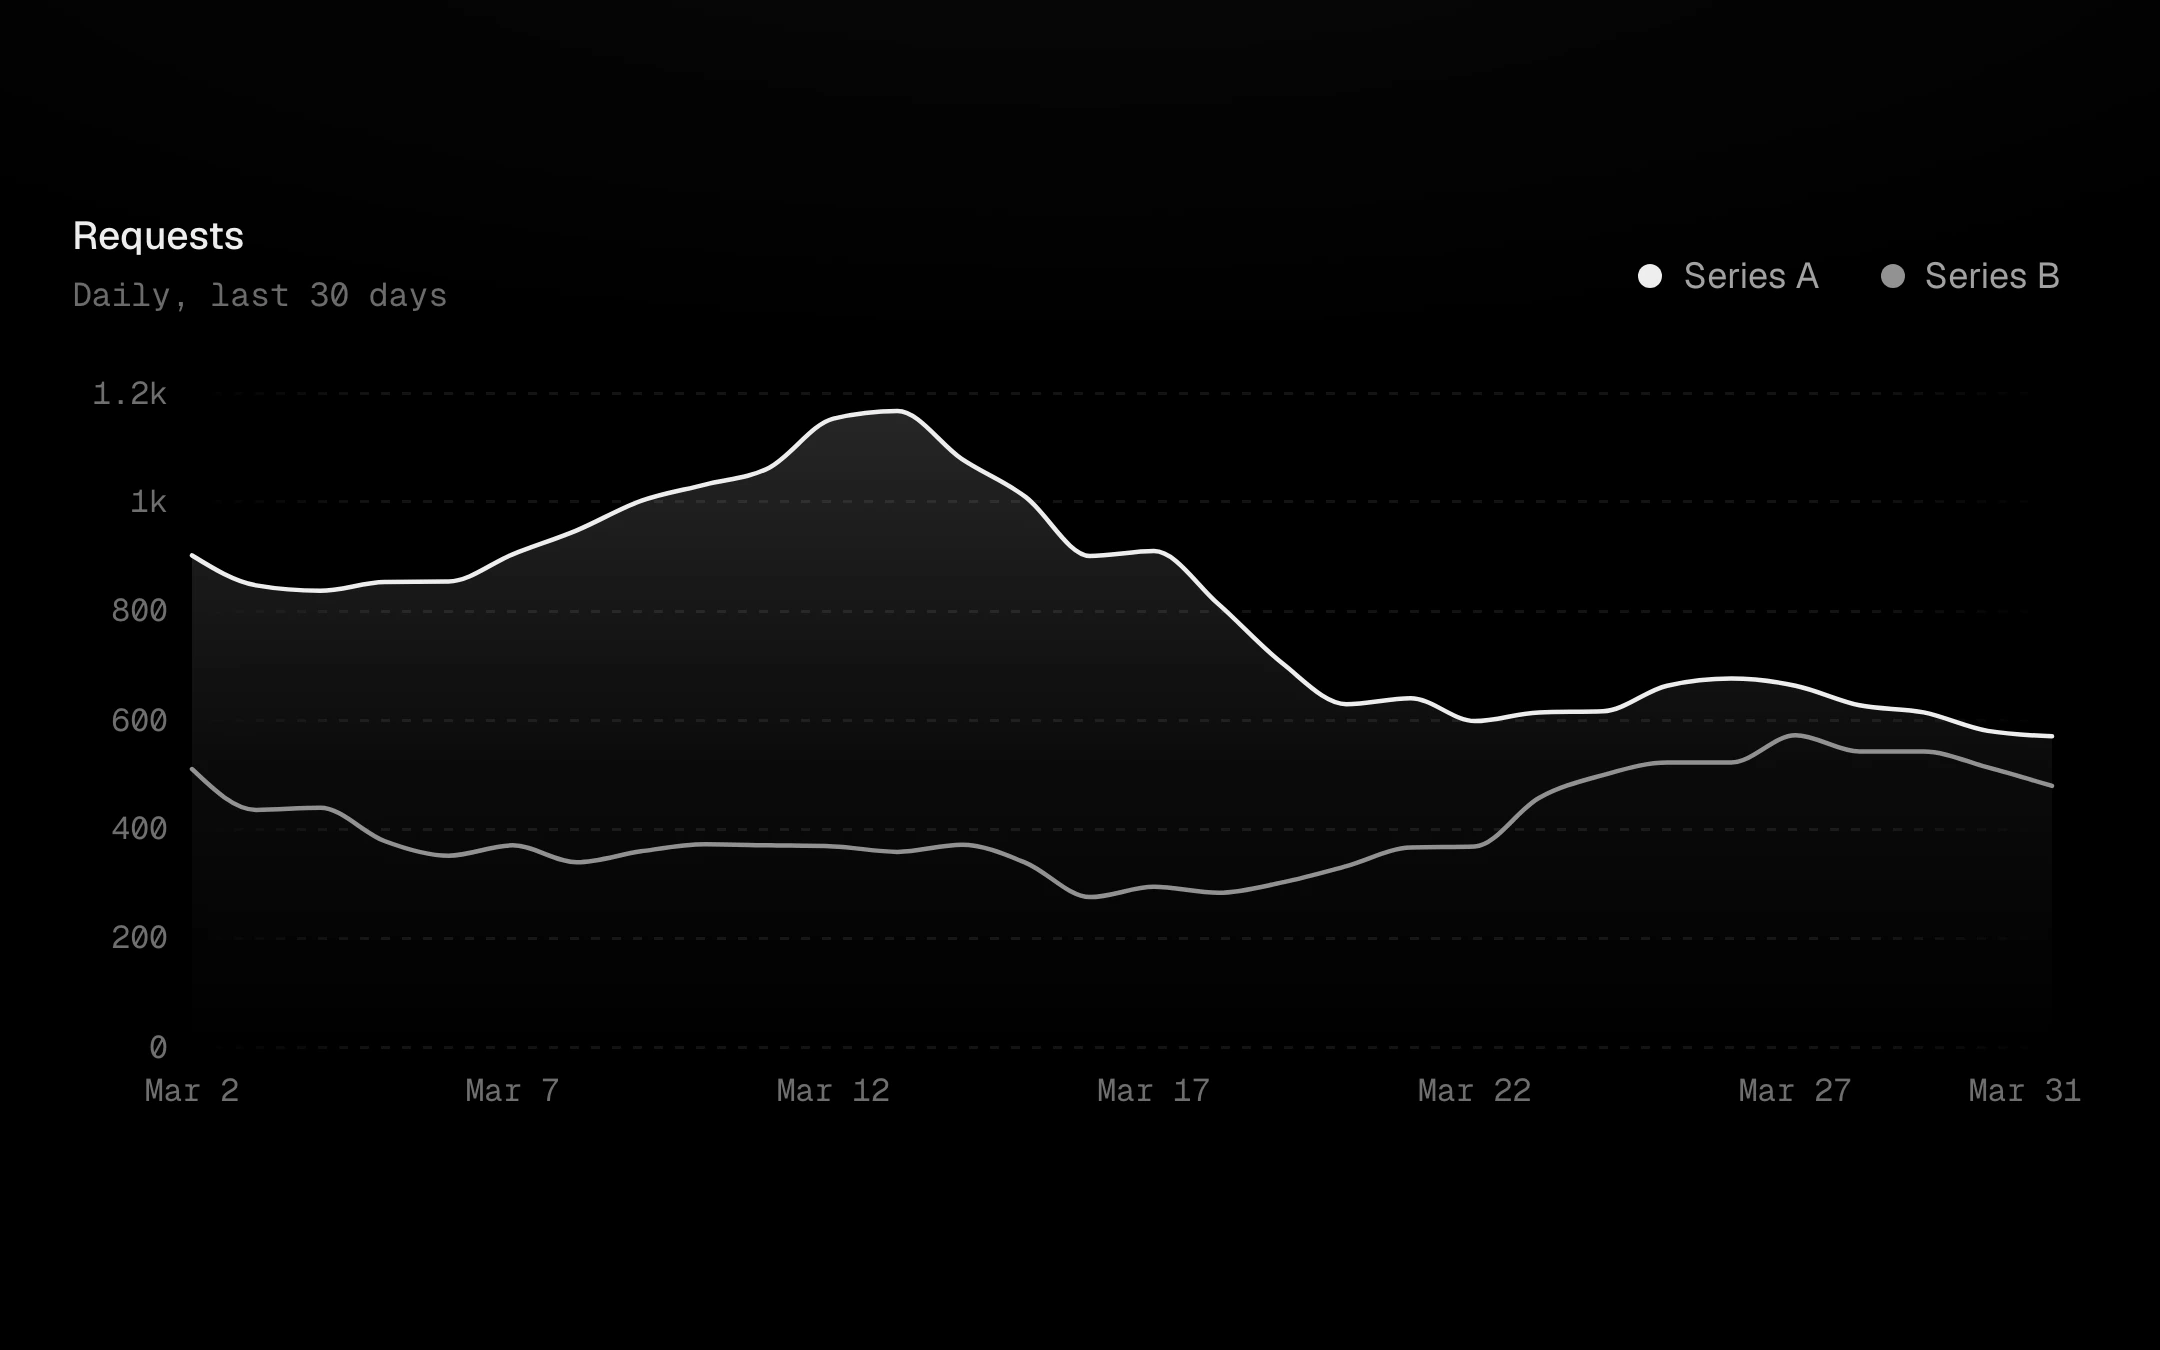
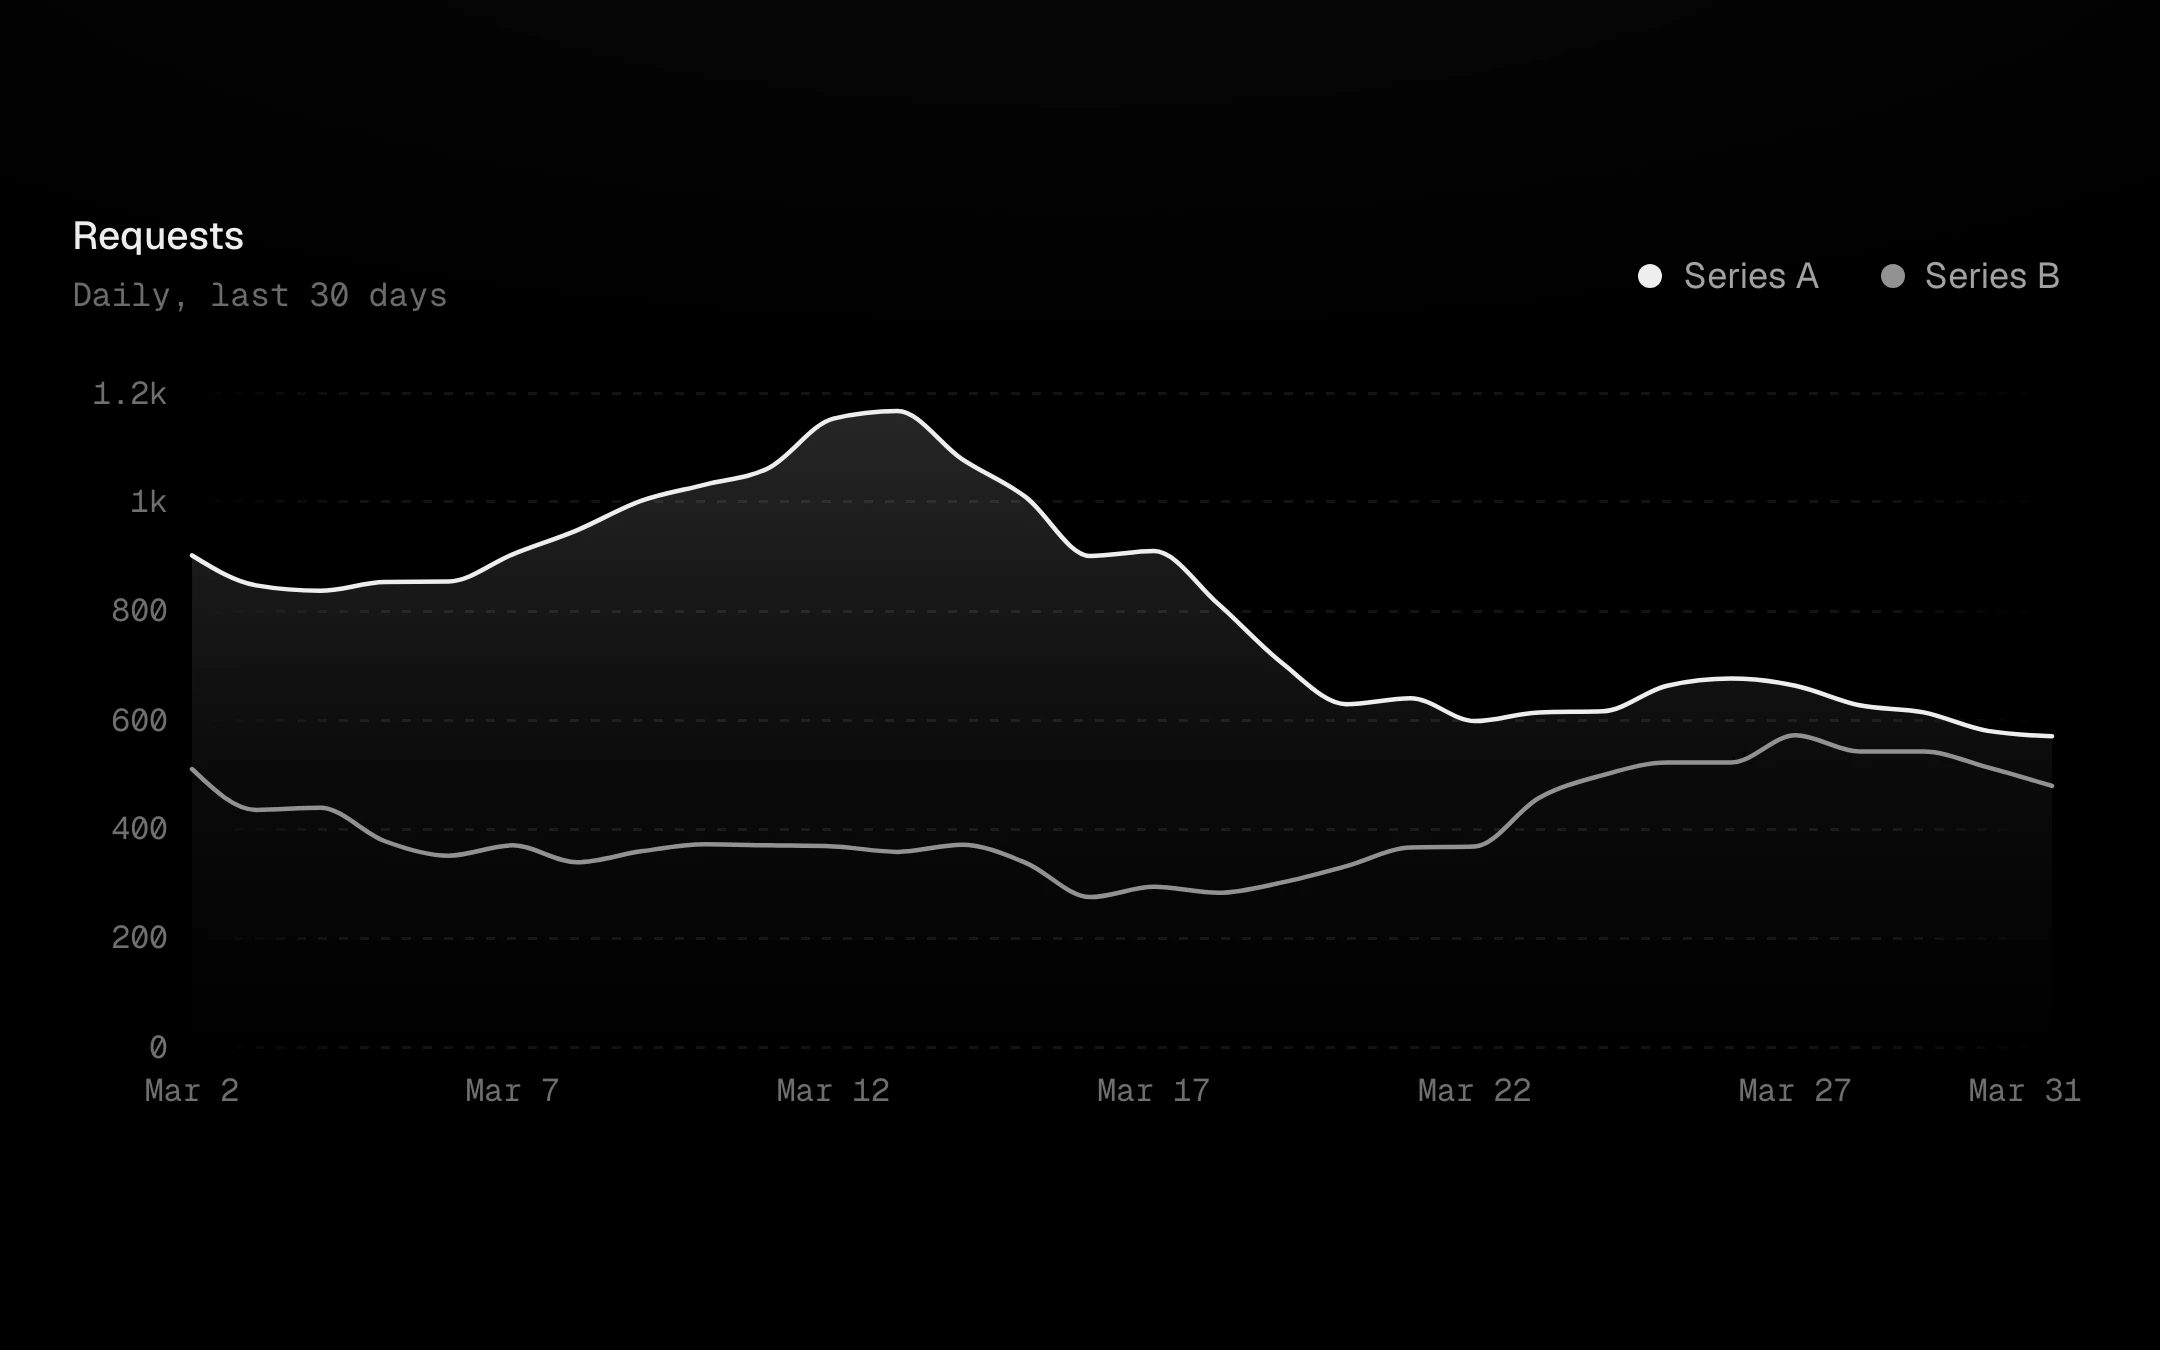
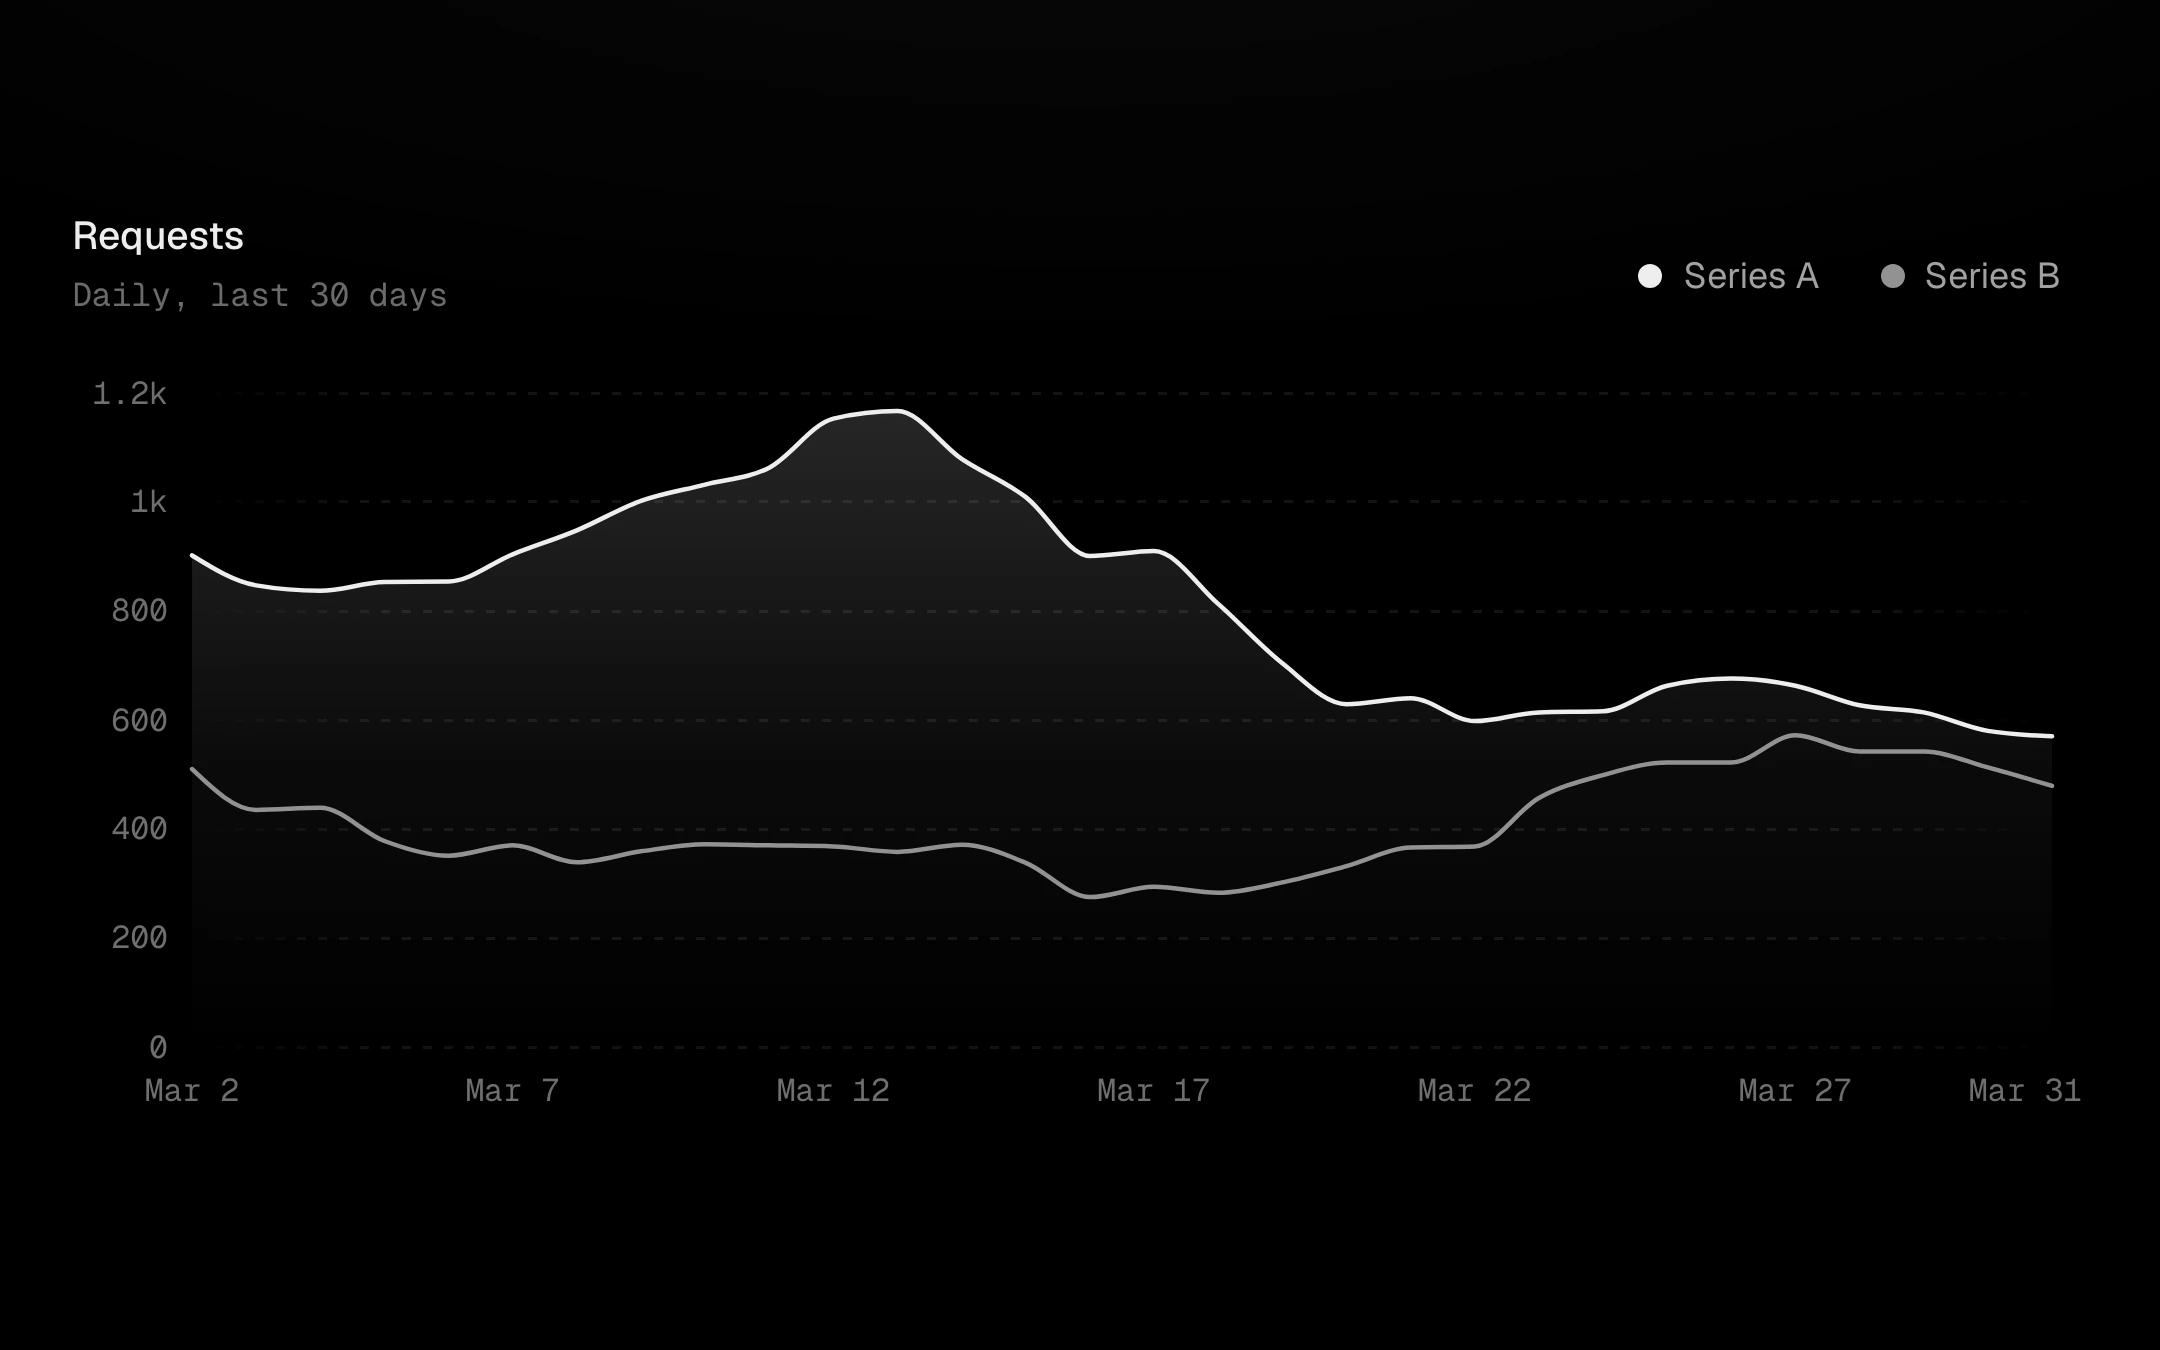
The tooltip and crosshair kit on real charts.
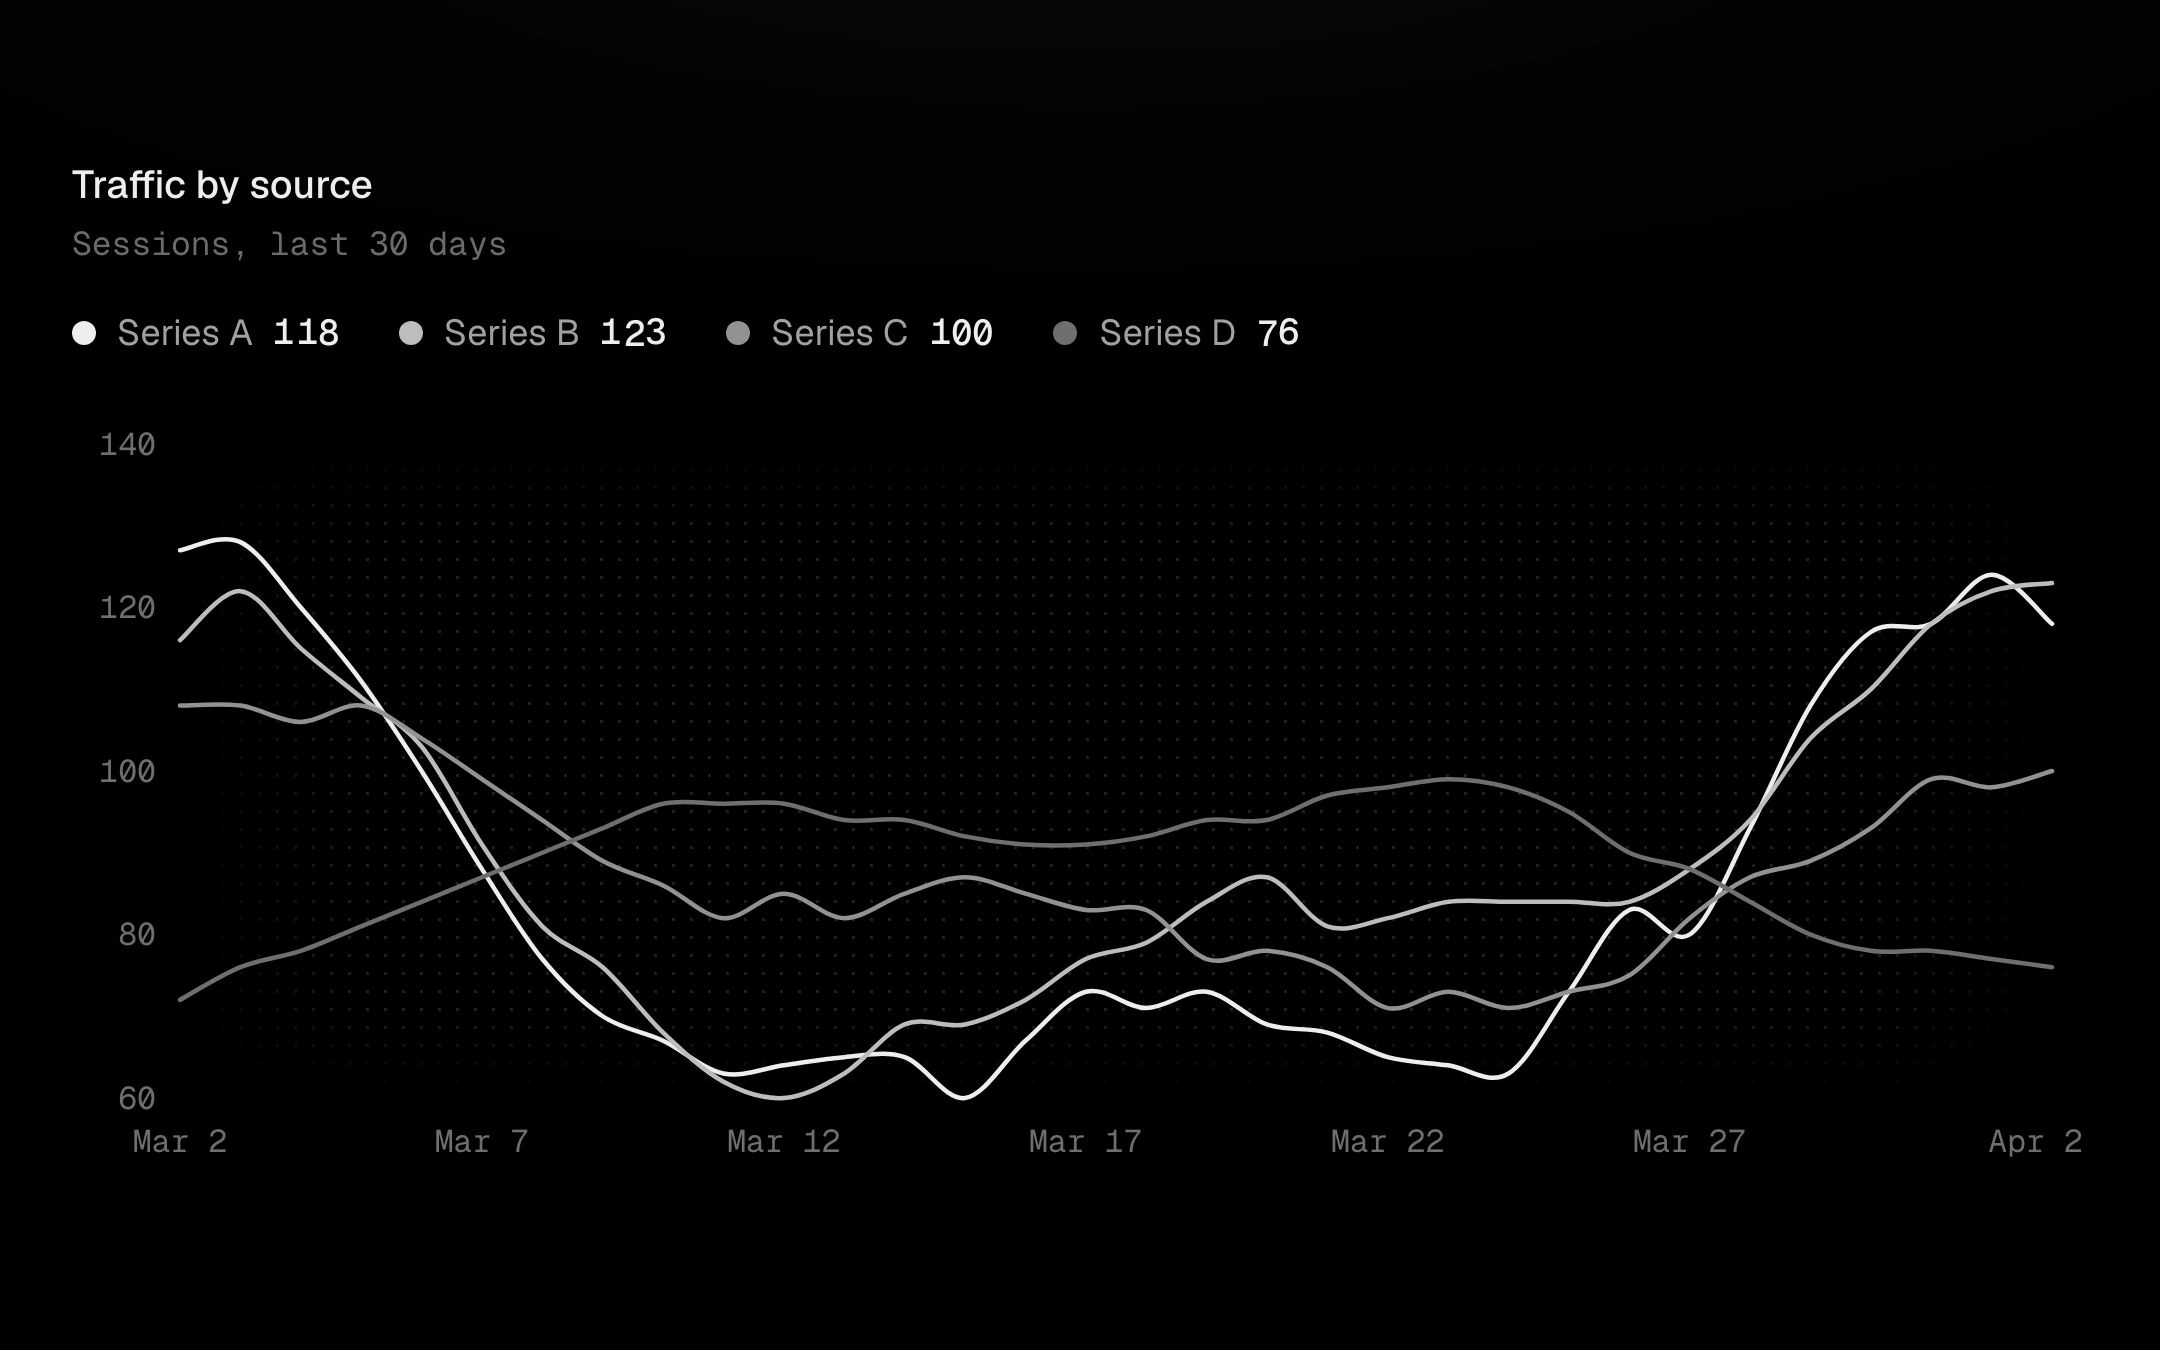
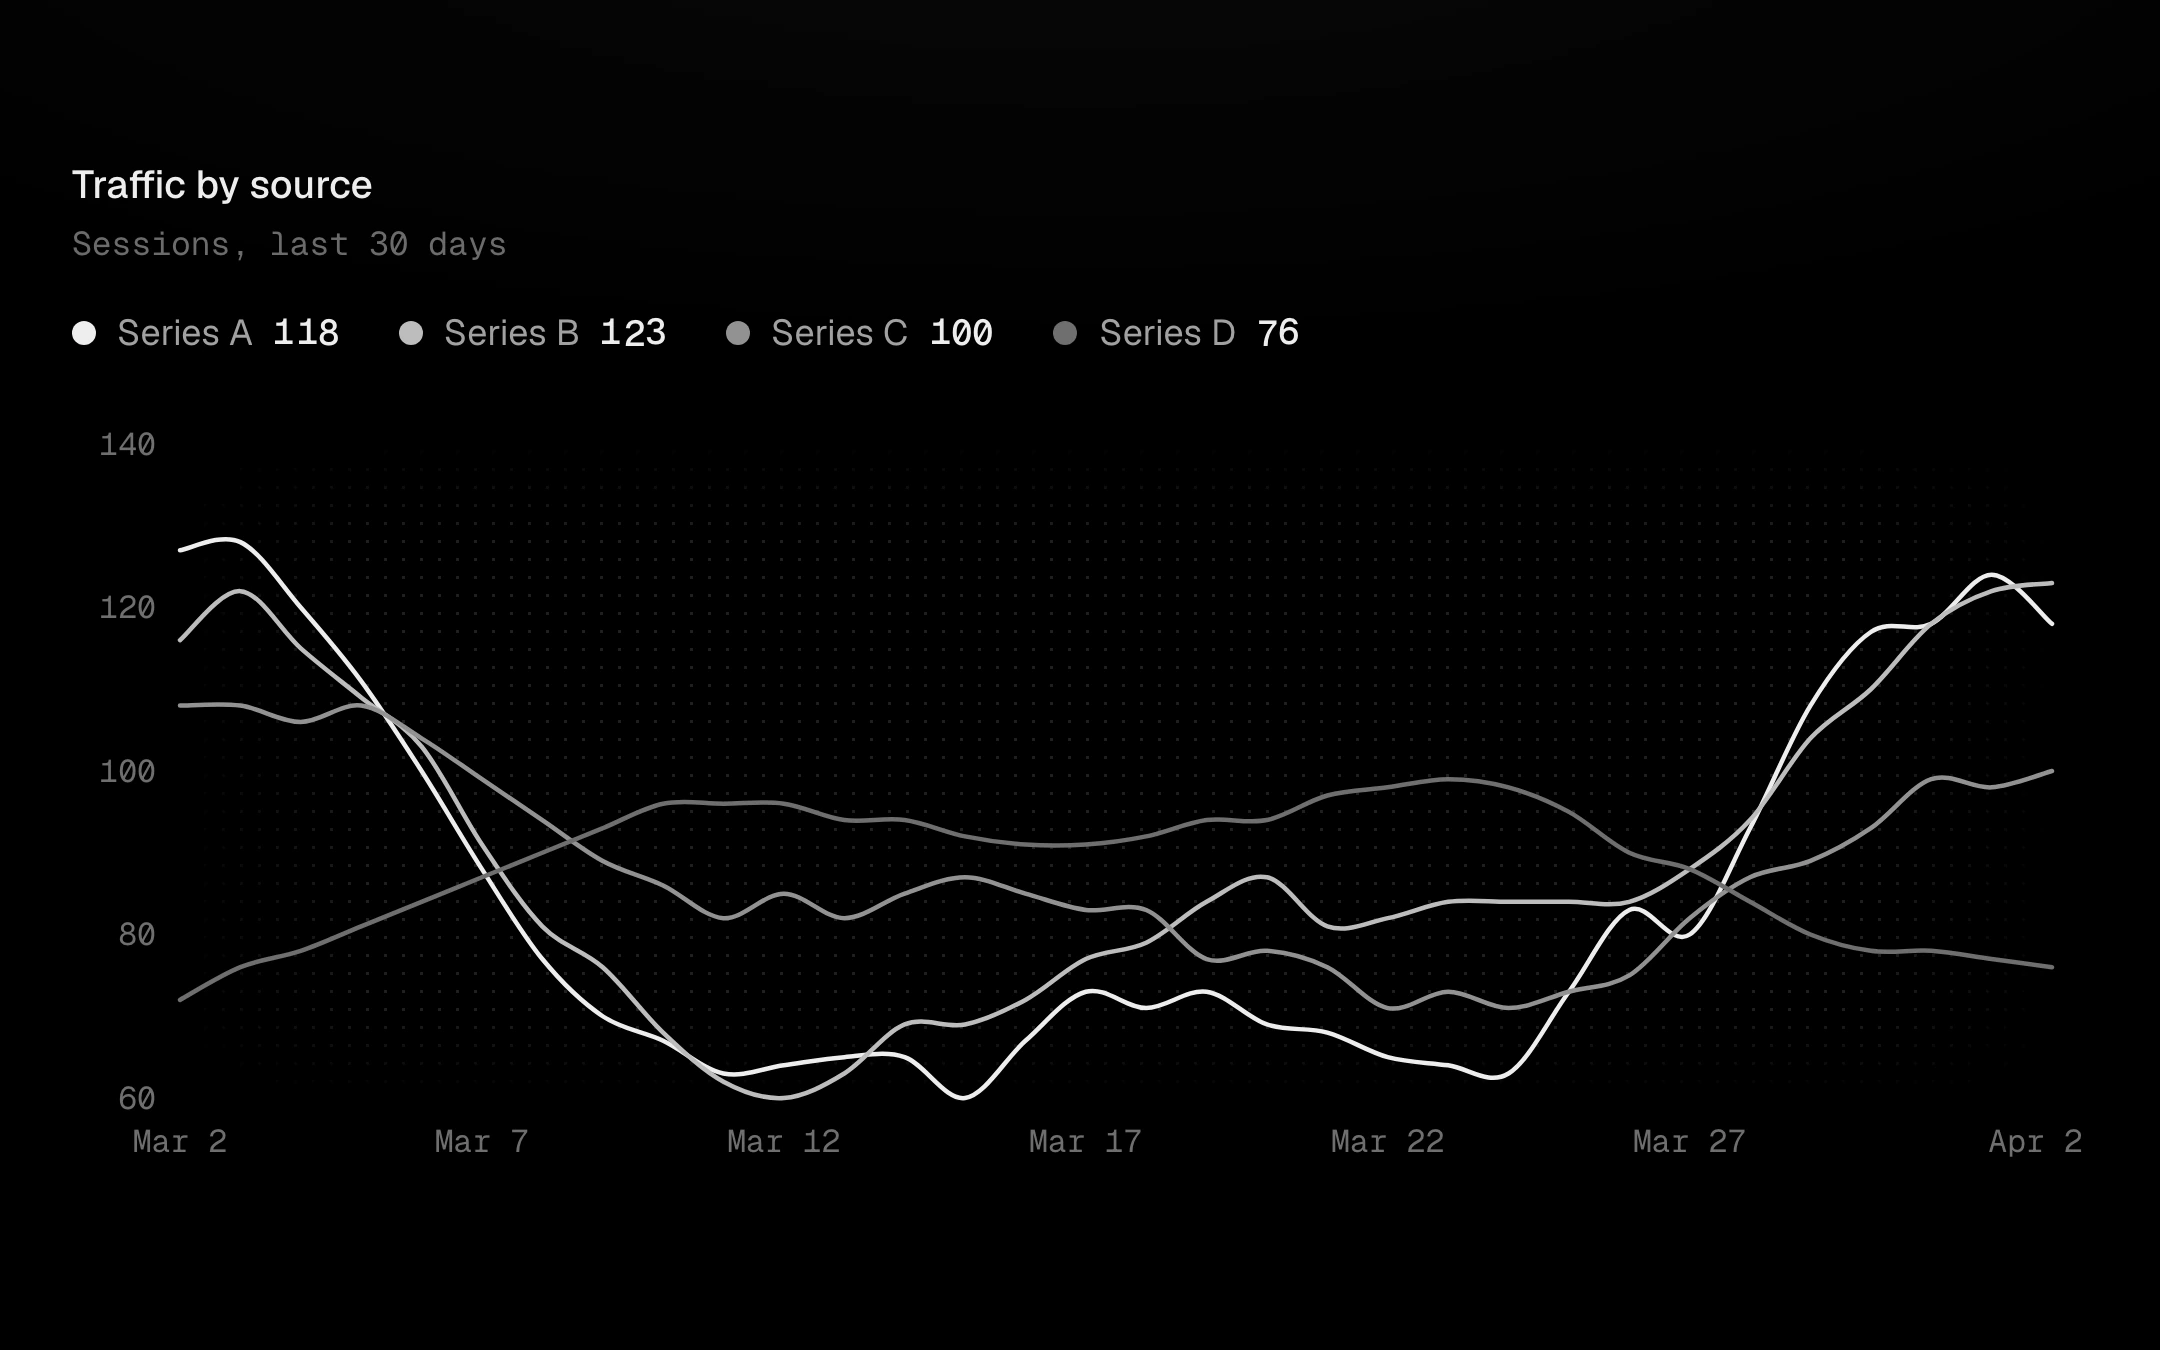
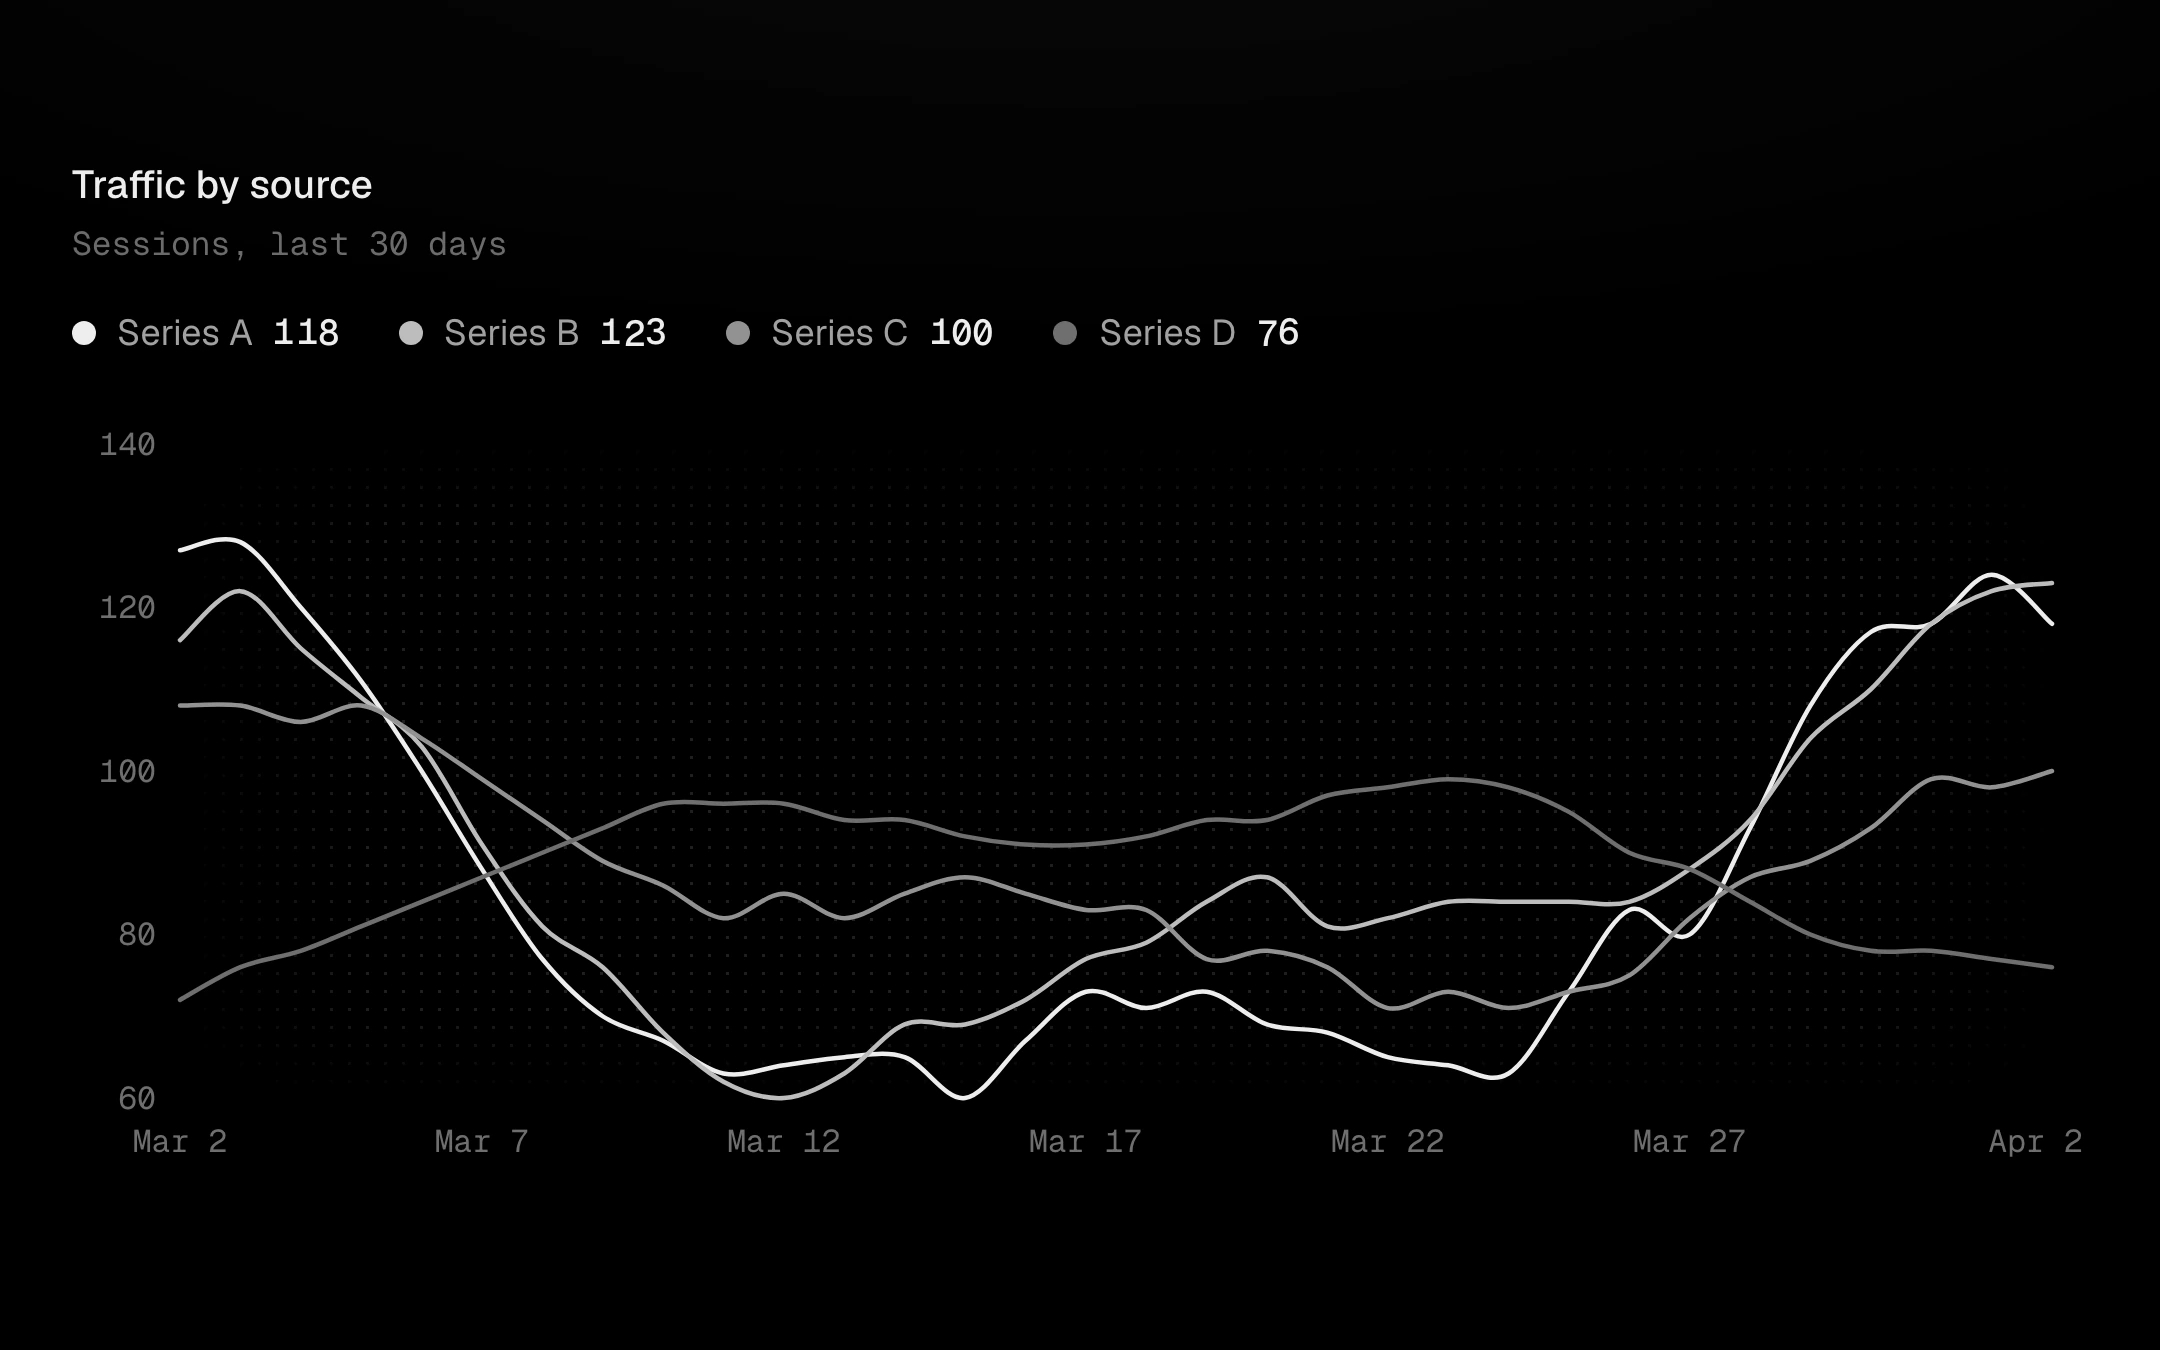
Every legend layout from the chart kit, wired to real charts through one focus store.
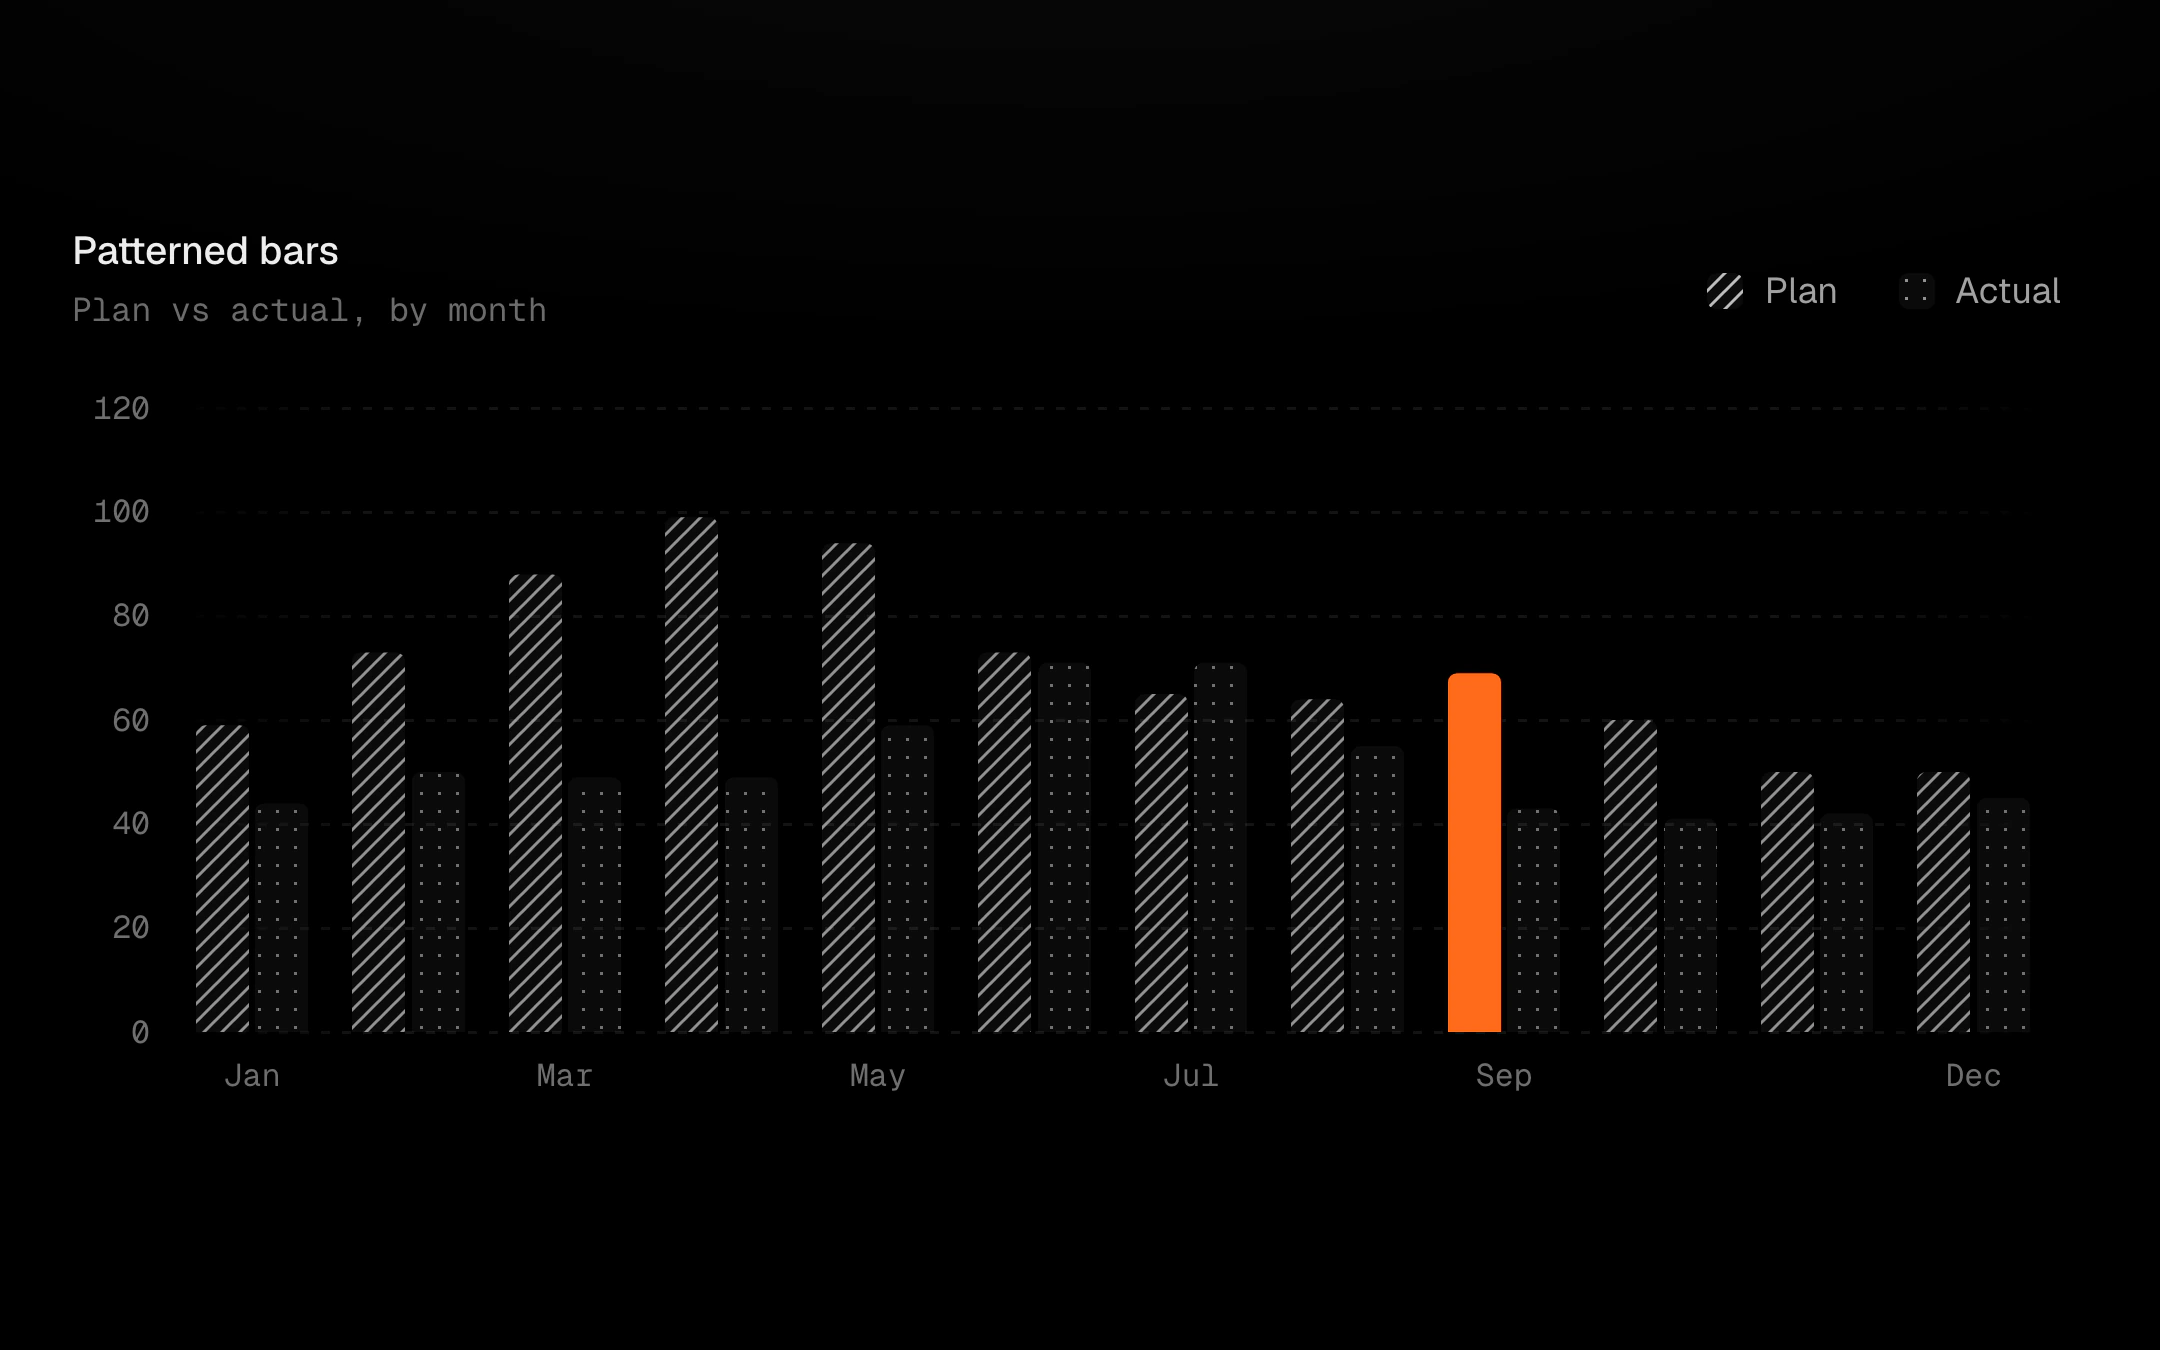
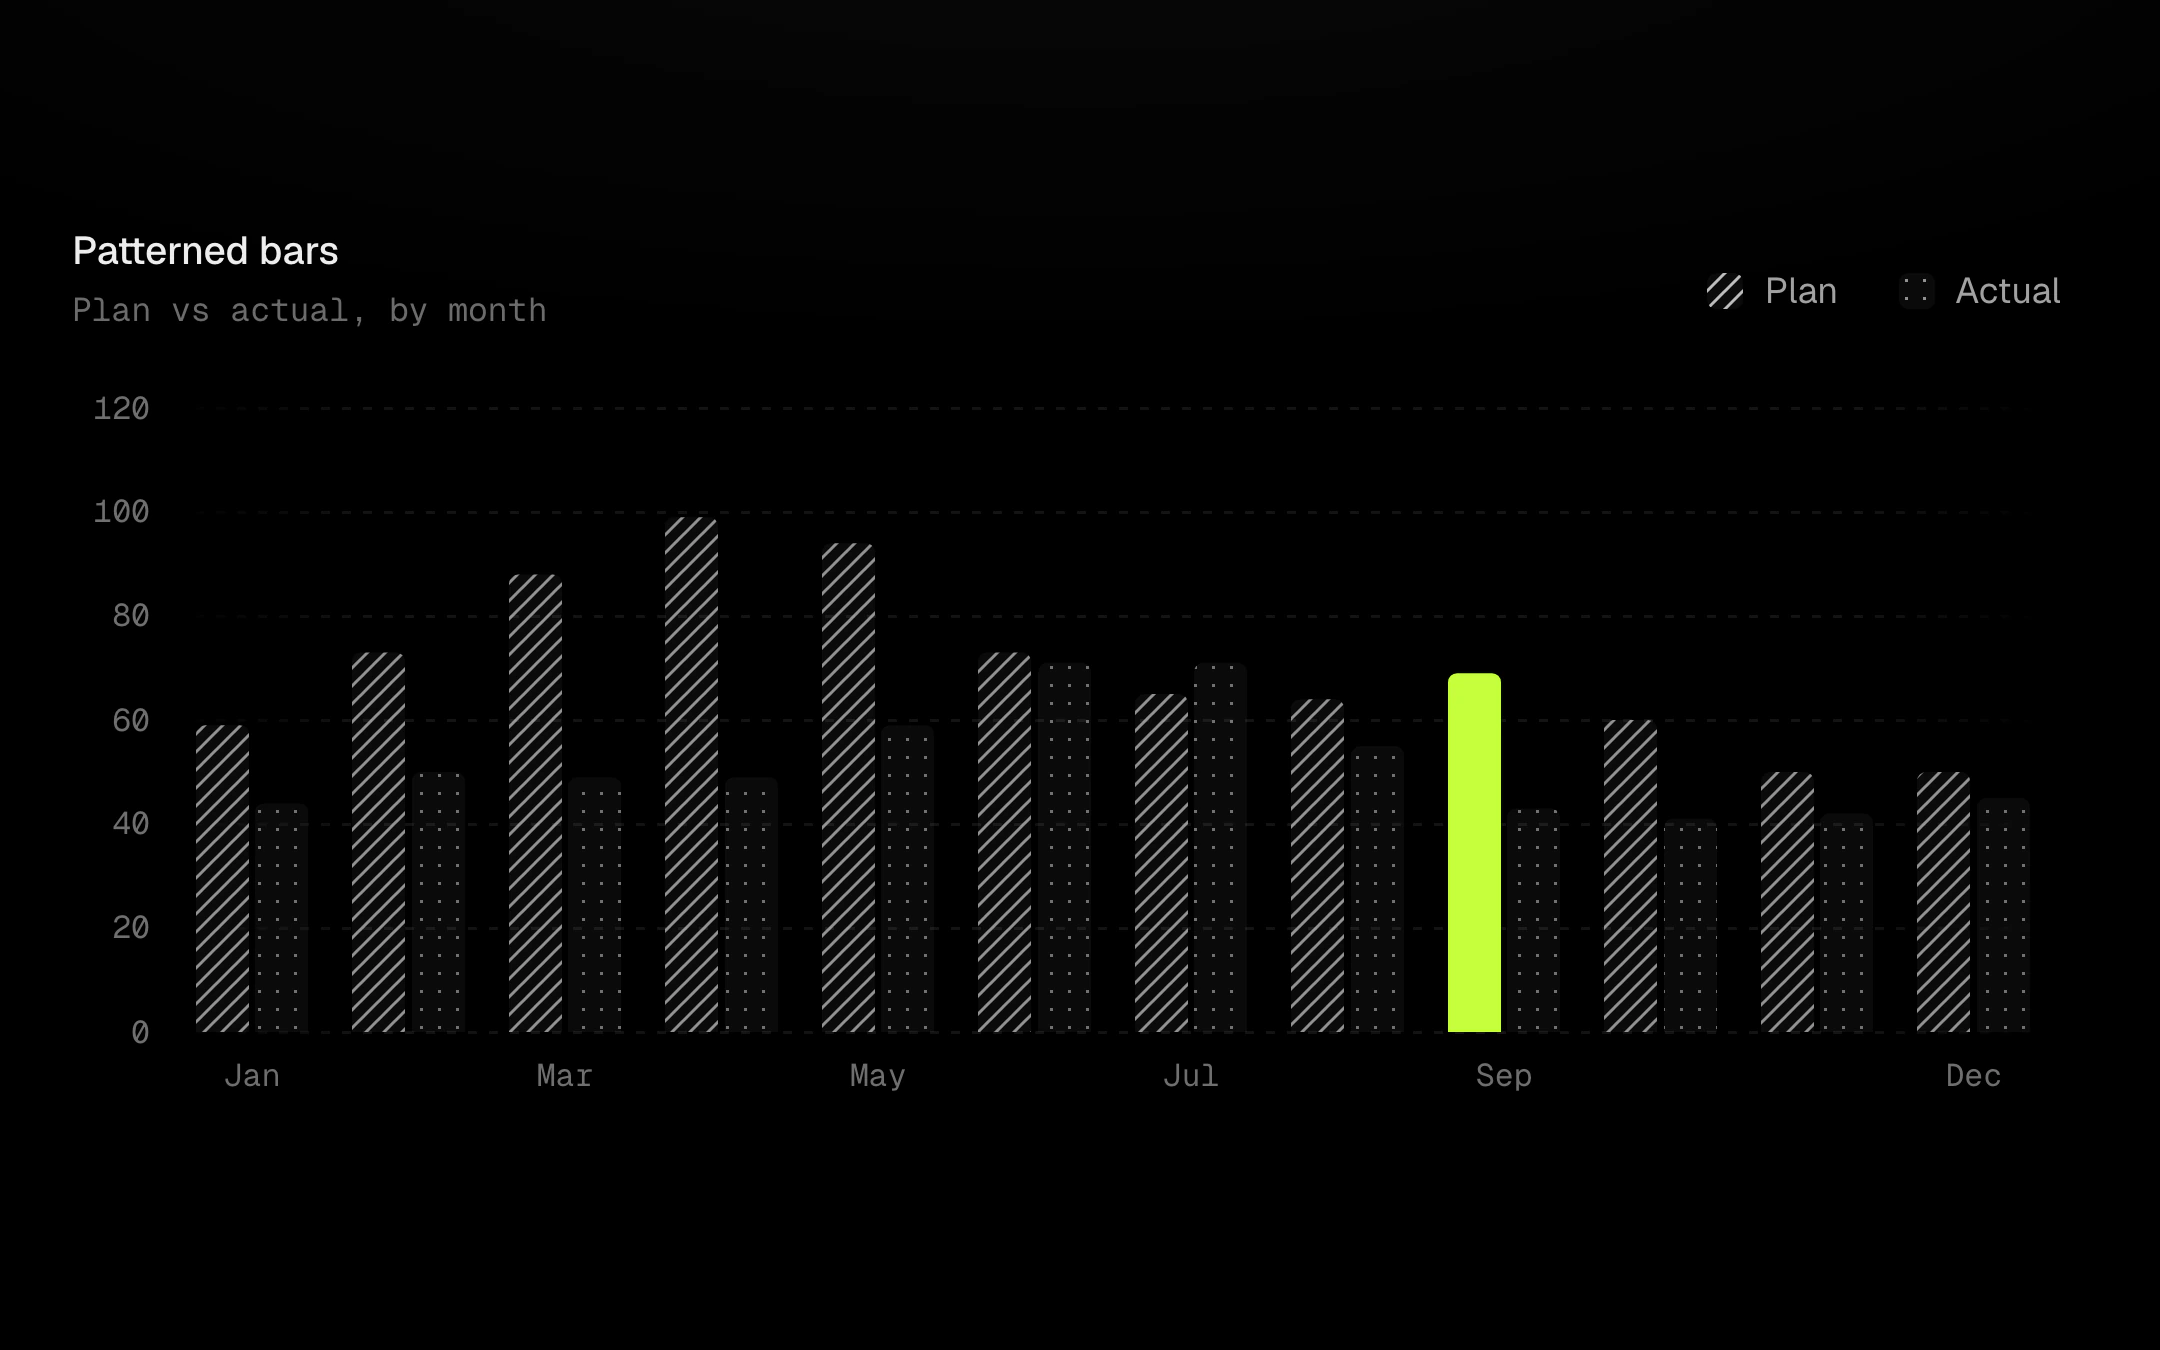
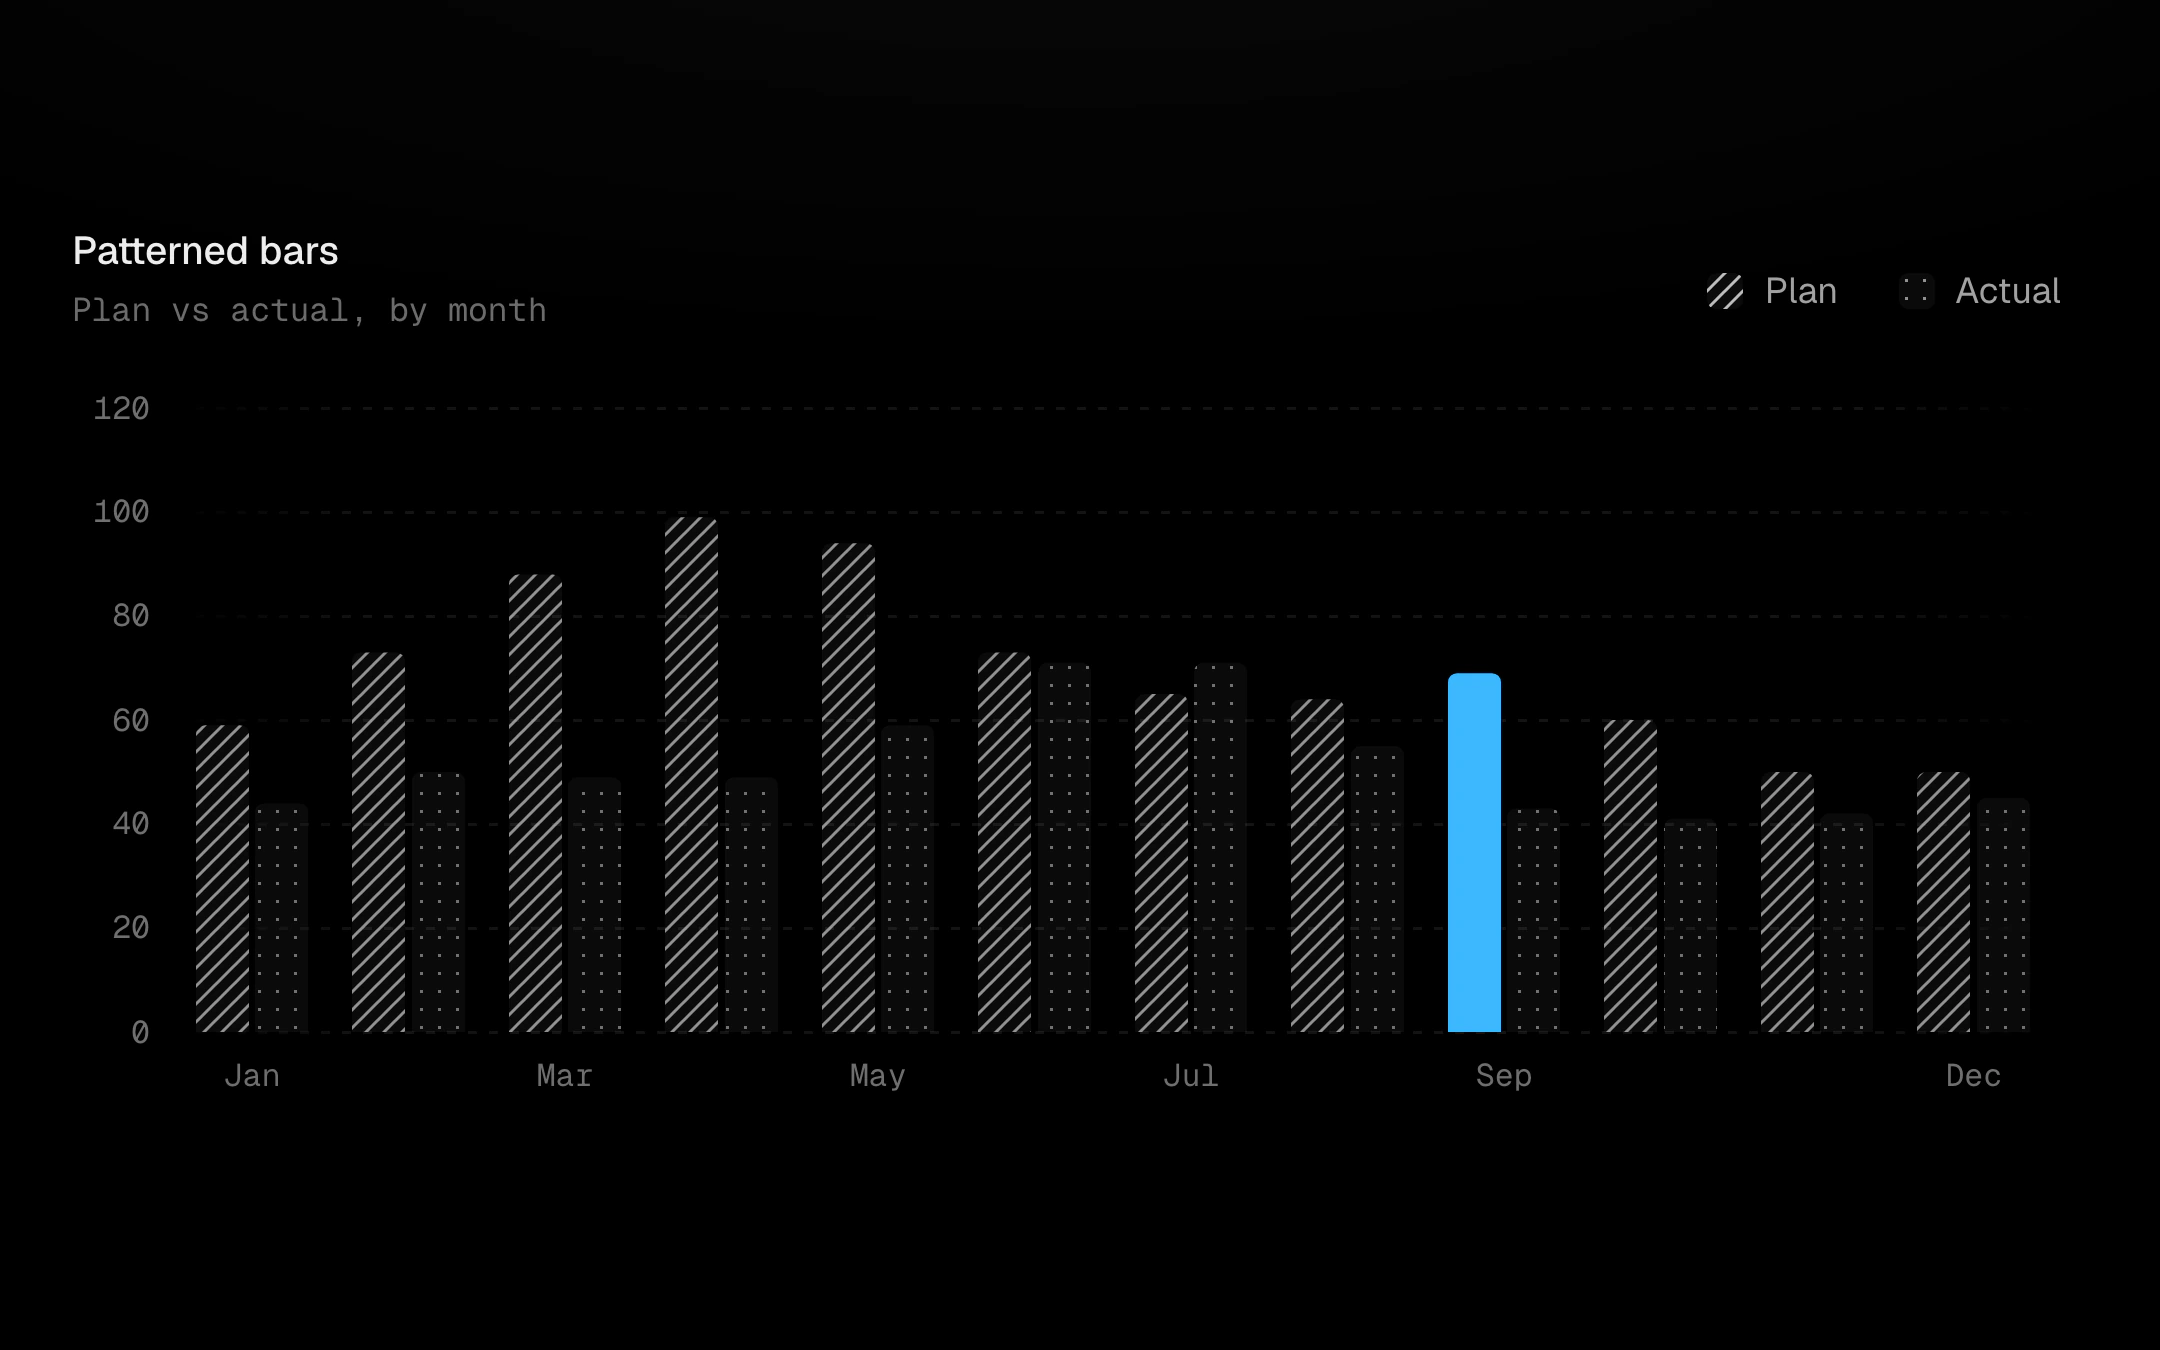
Single-colour textures for charts, on a 6px base tile so lines and dots land on whole pixels and stay crisp at any pixel density.
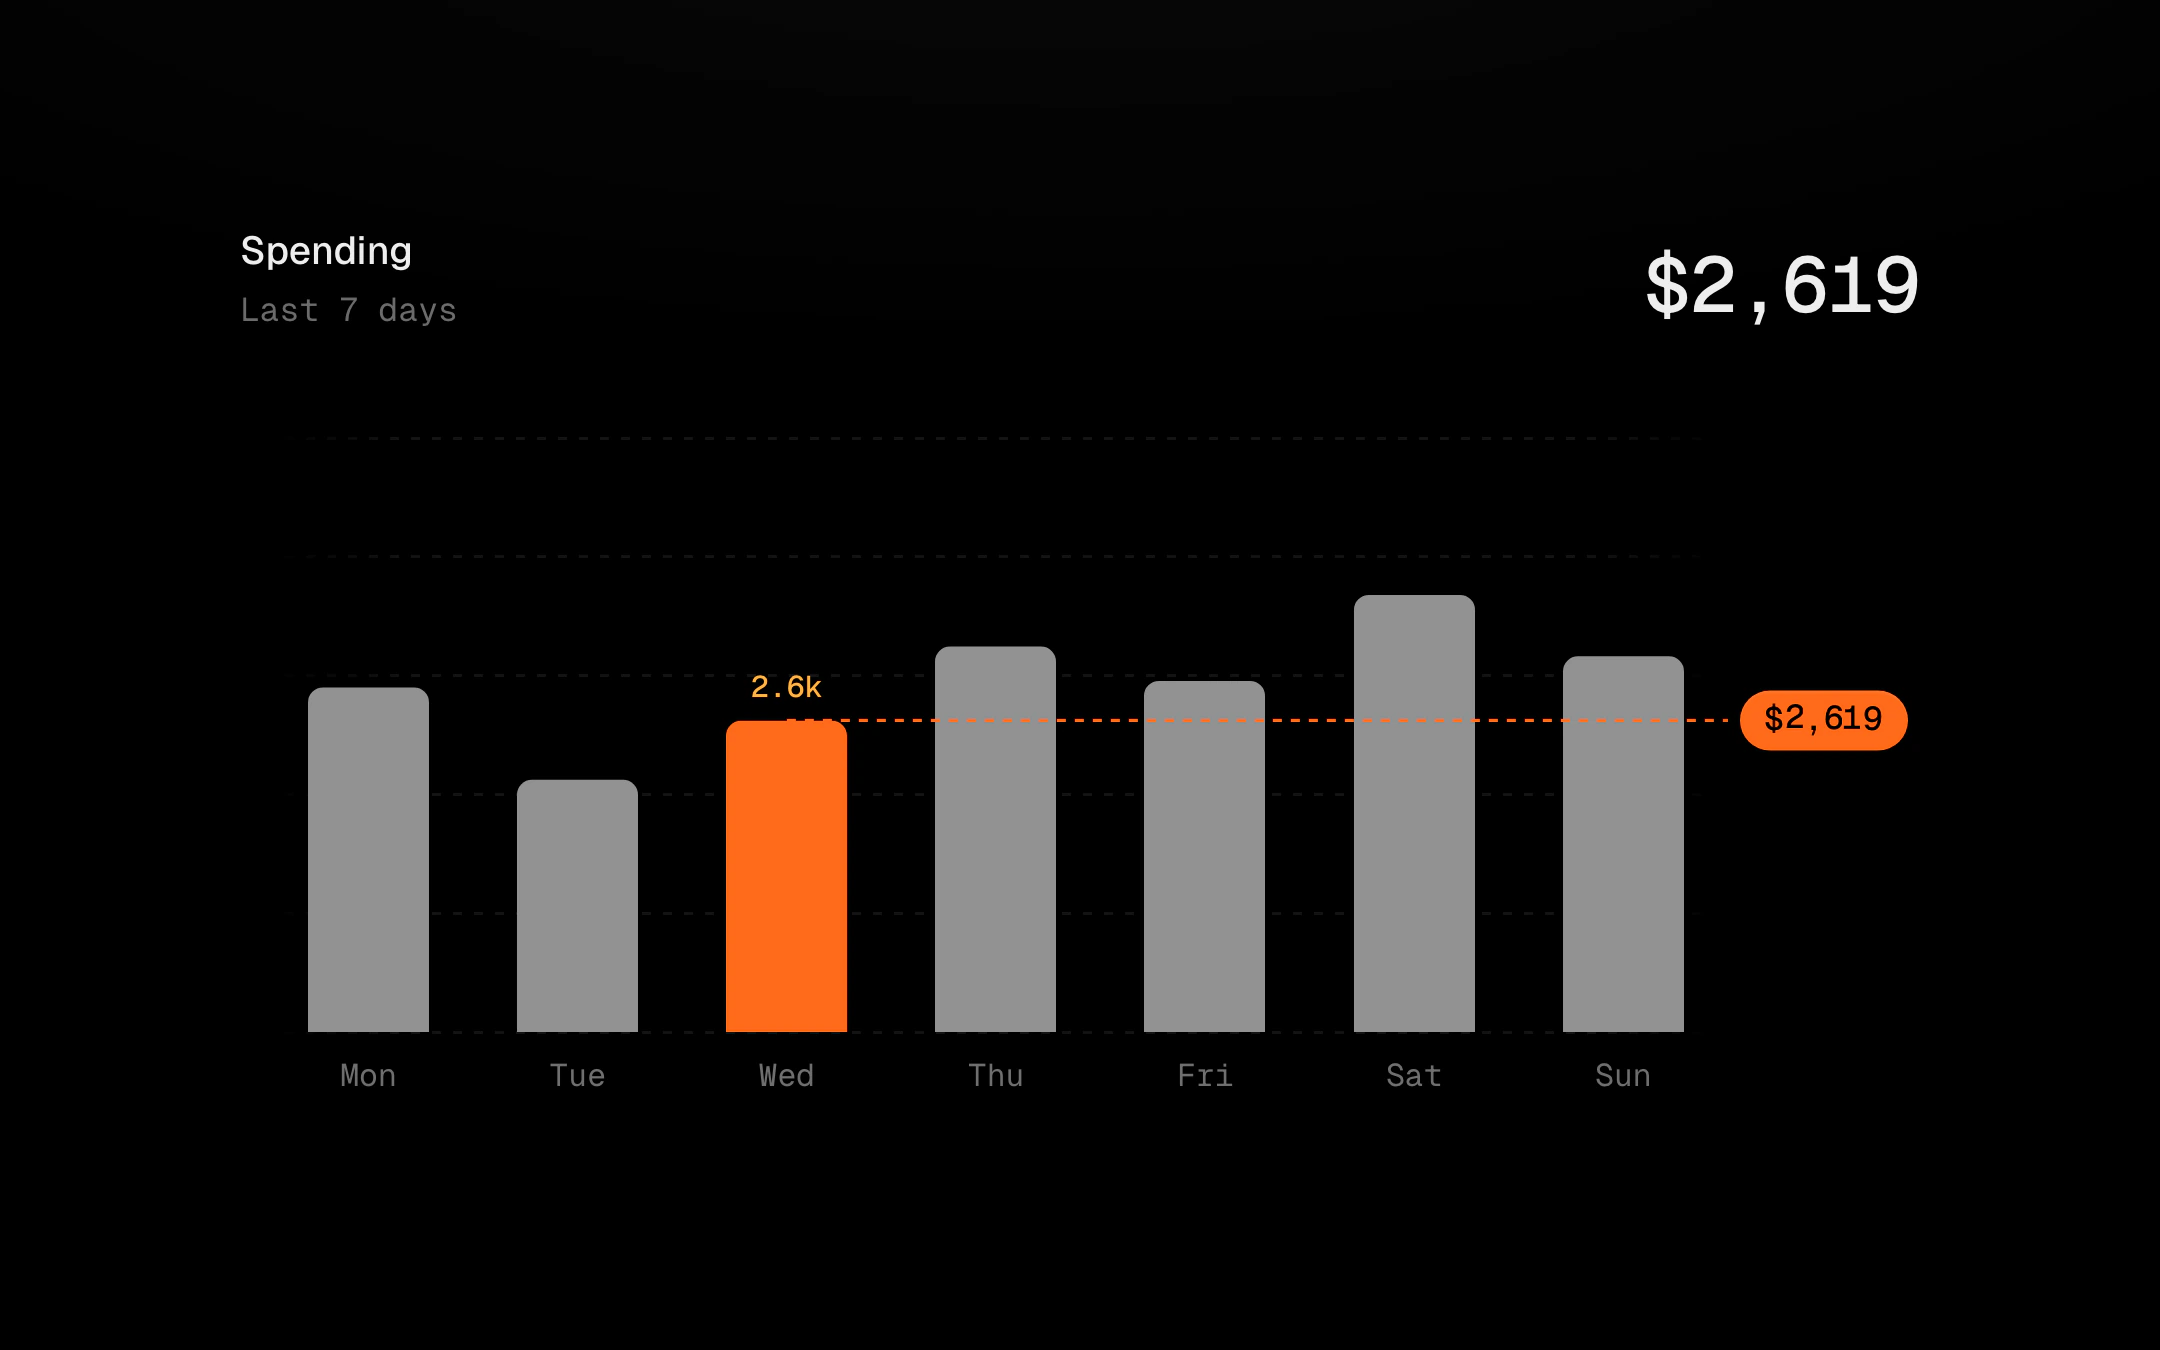
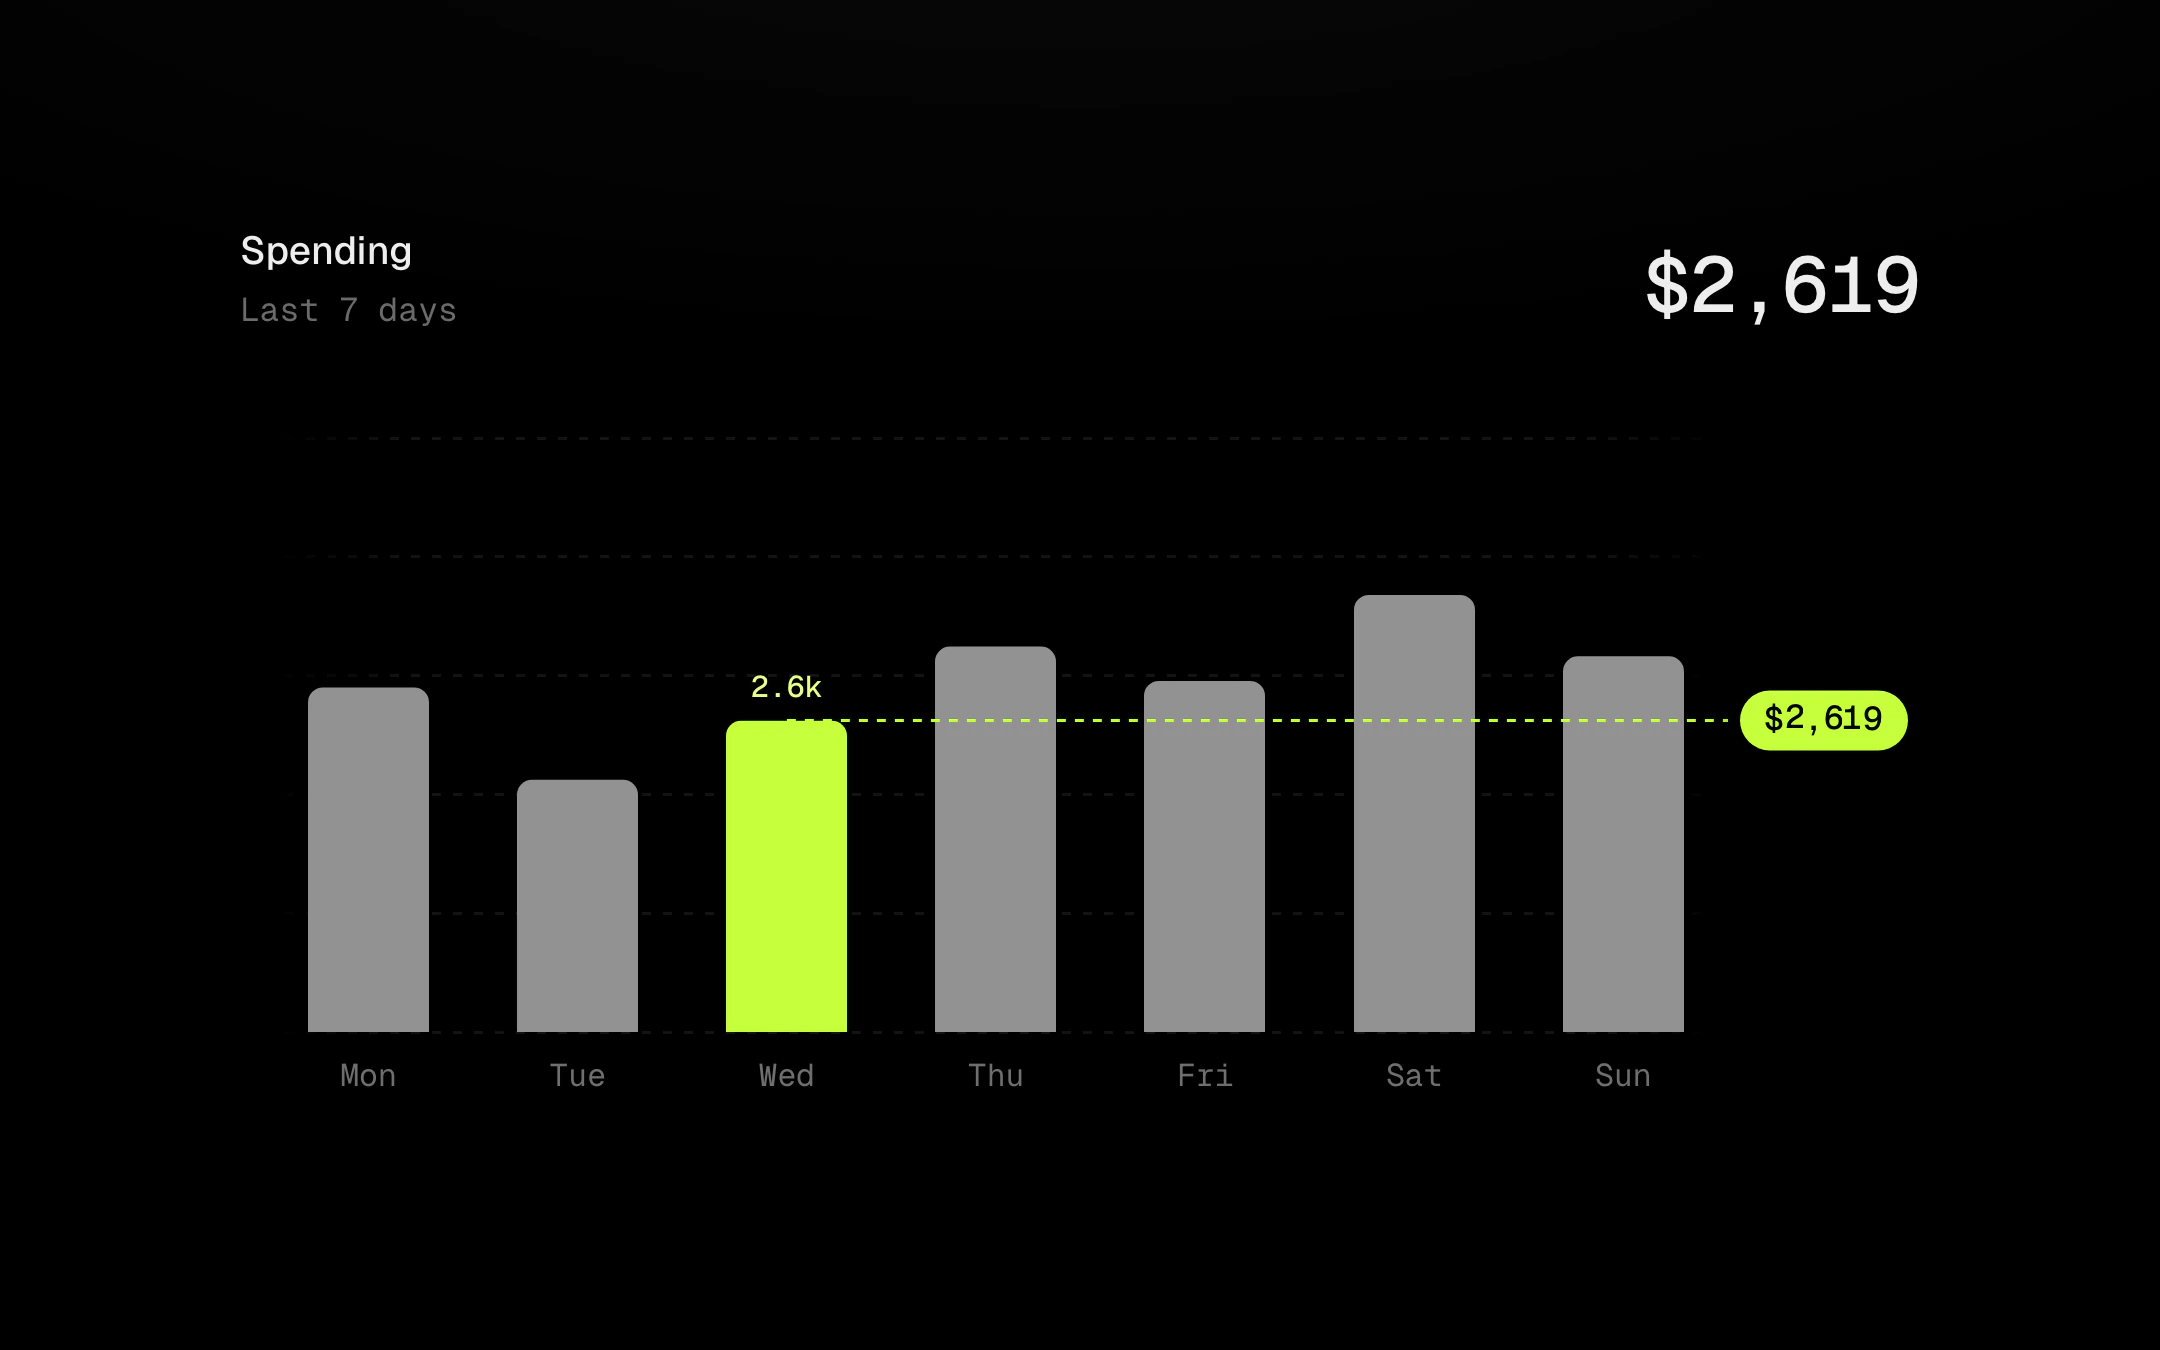
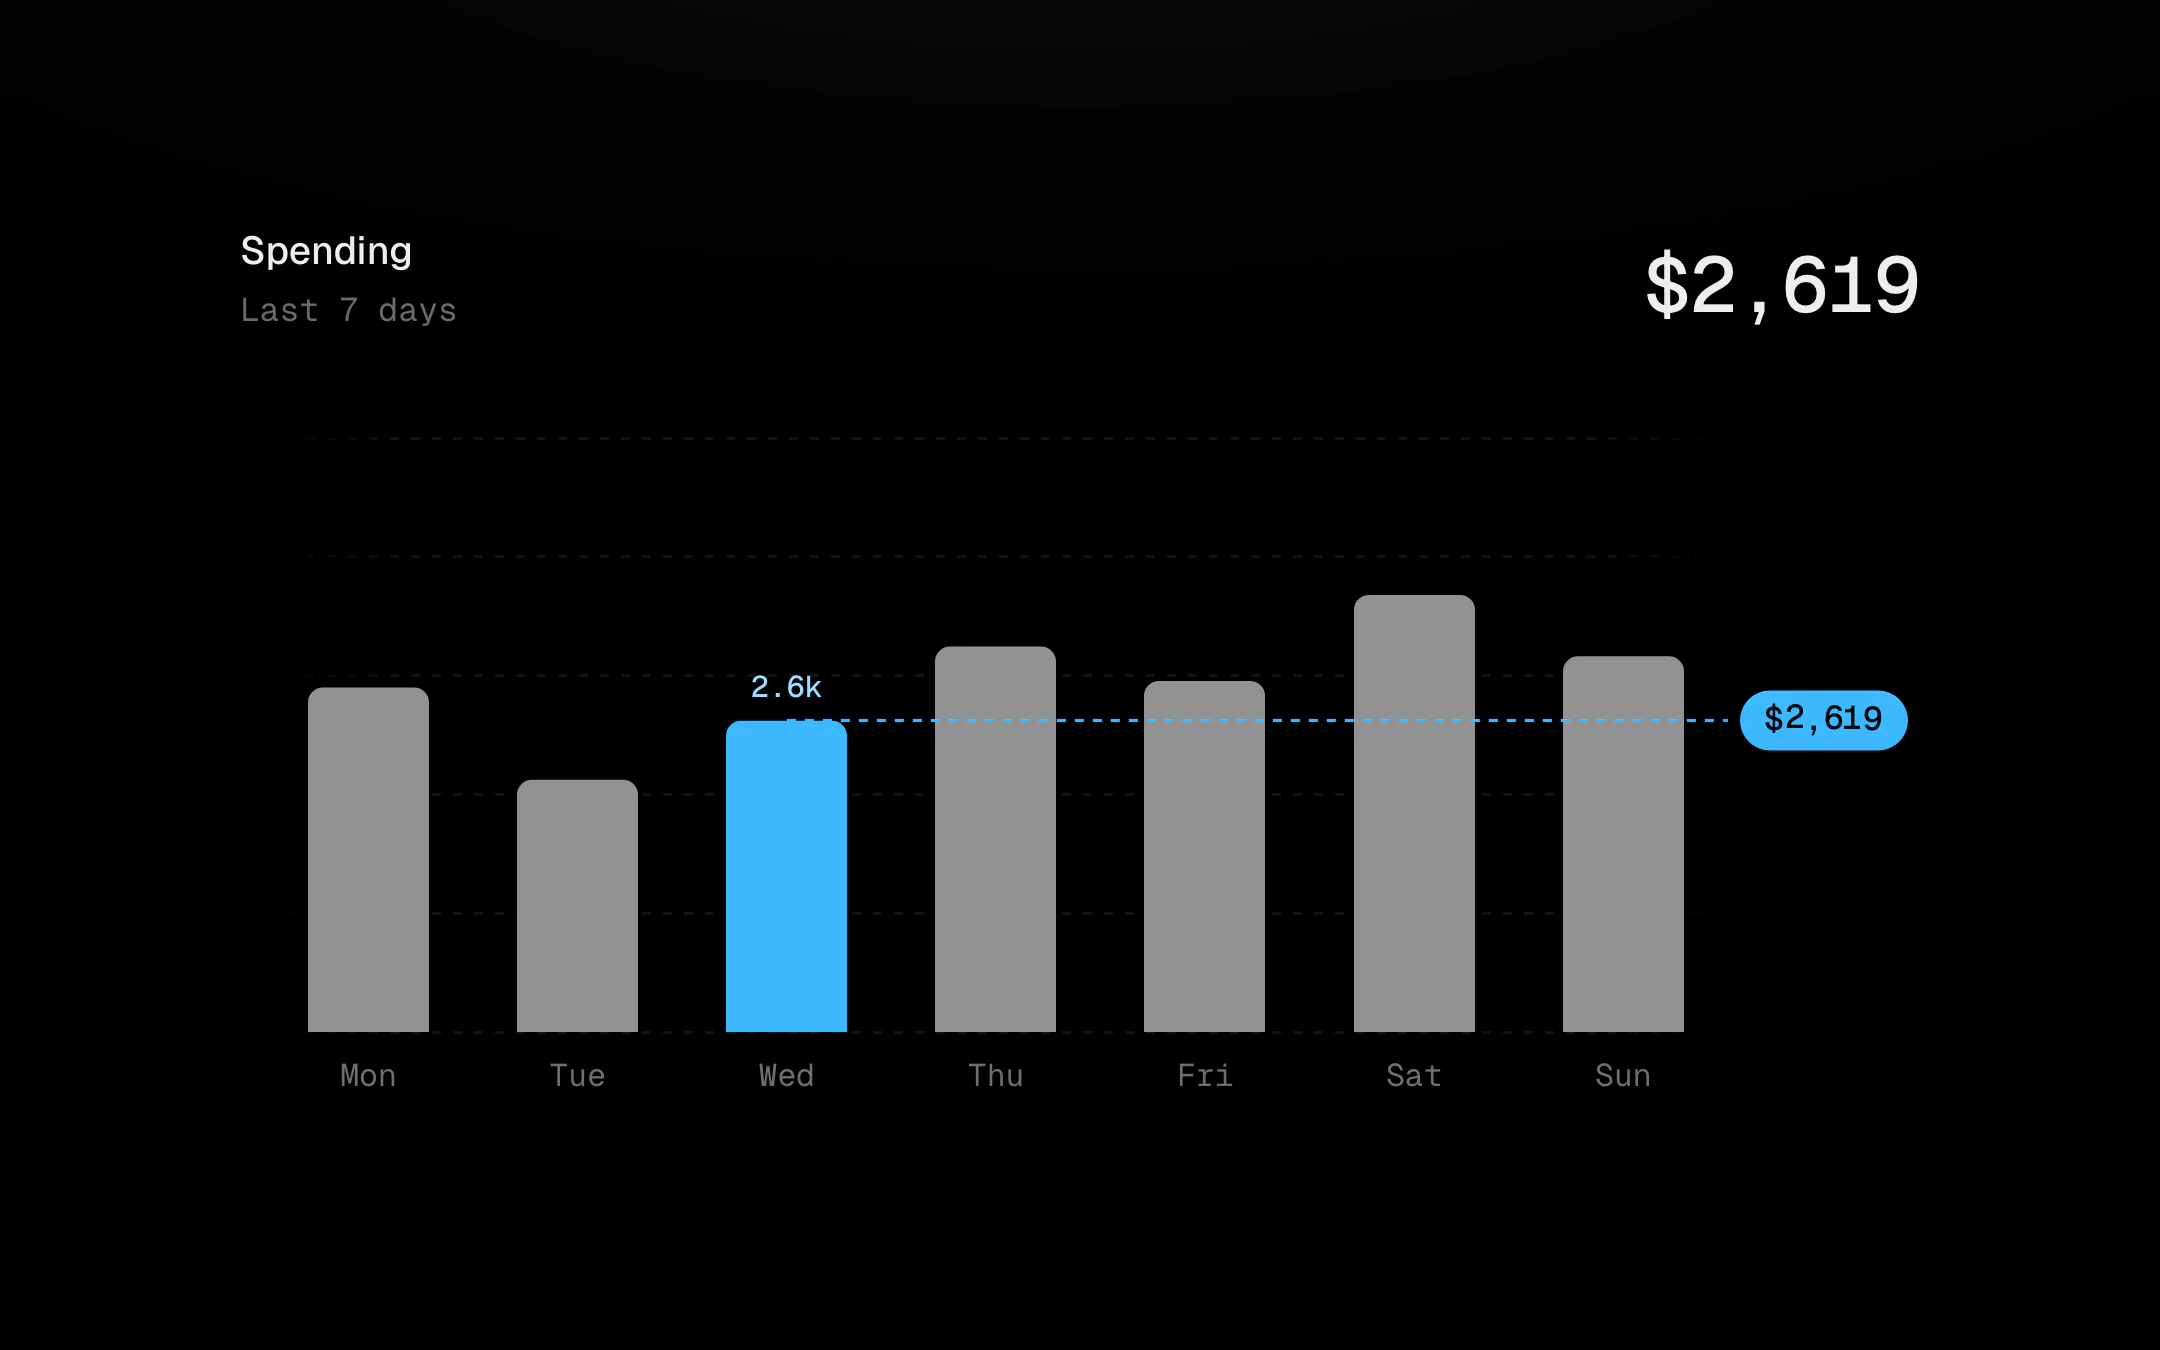
The chart kit layers that explain data, each on a real chart.
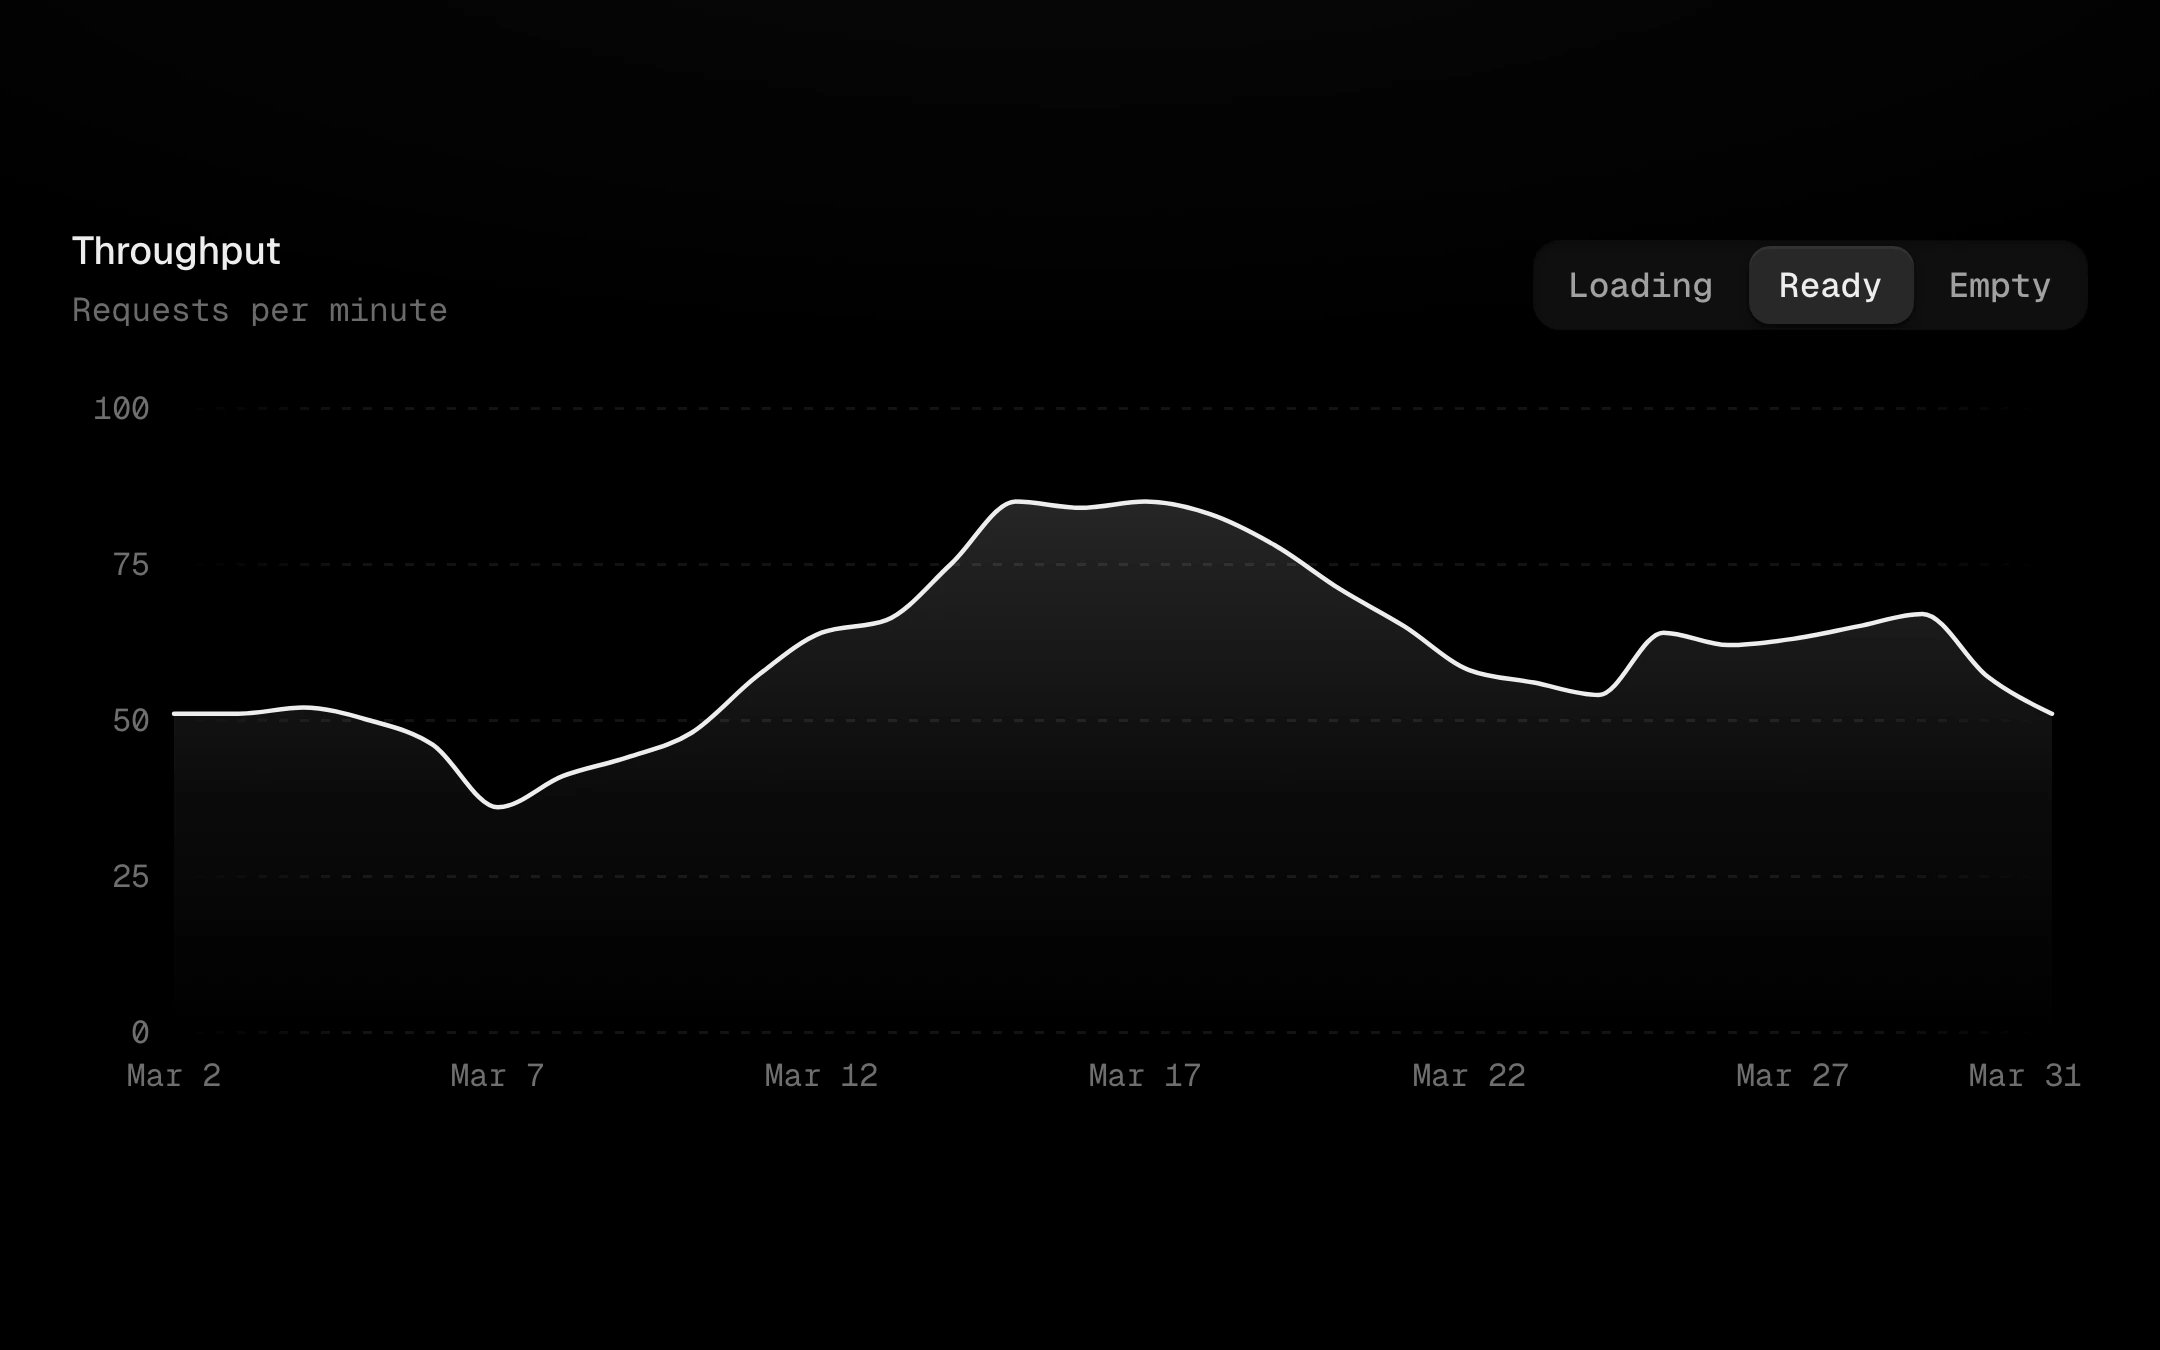
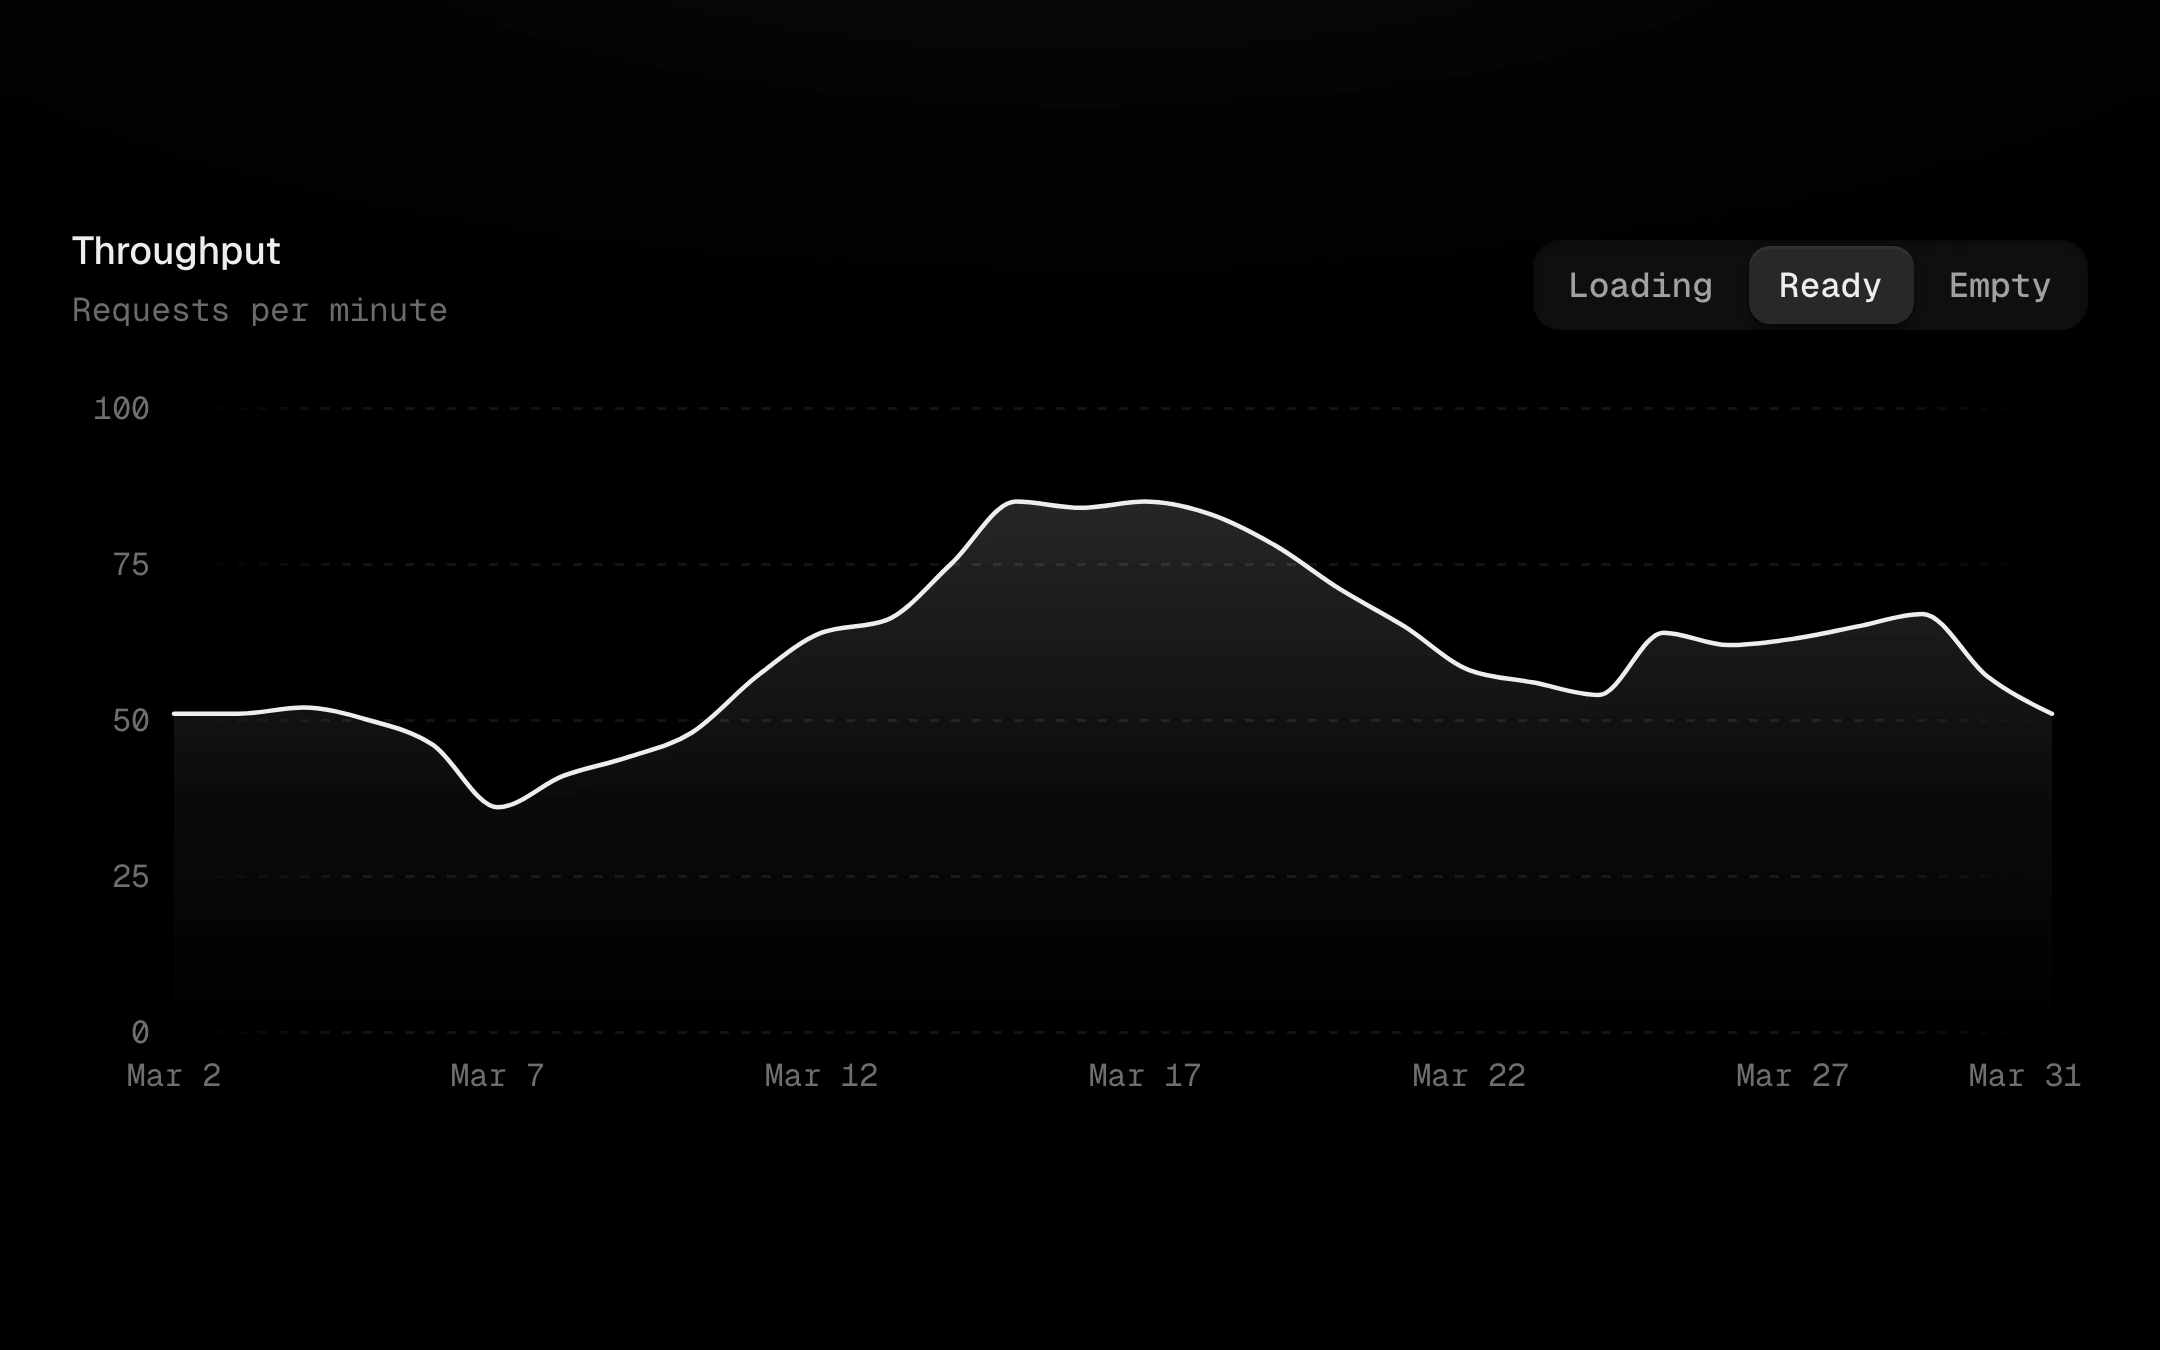
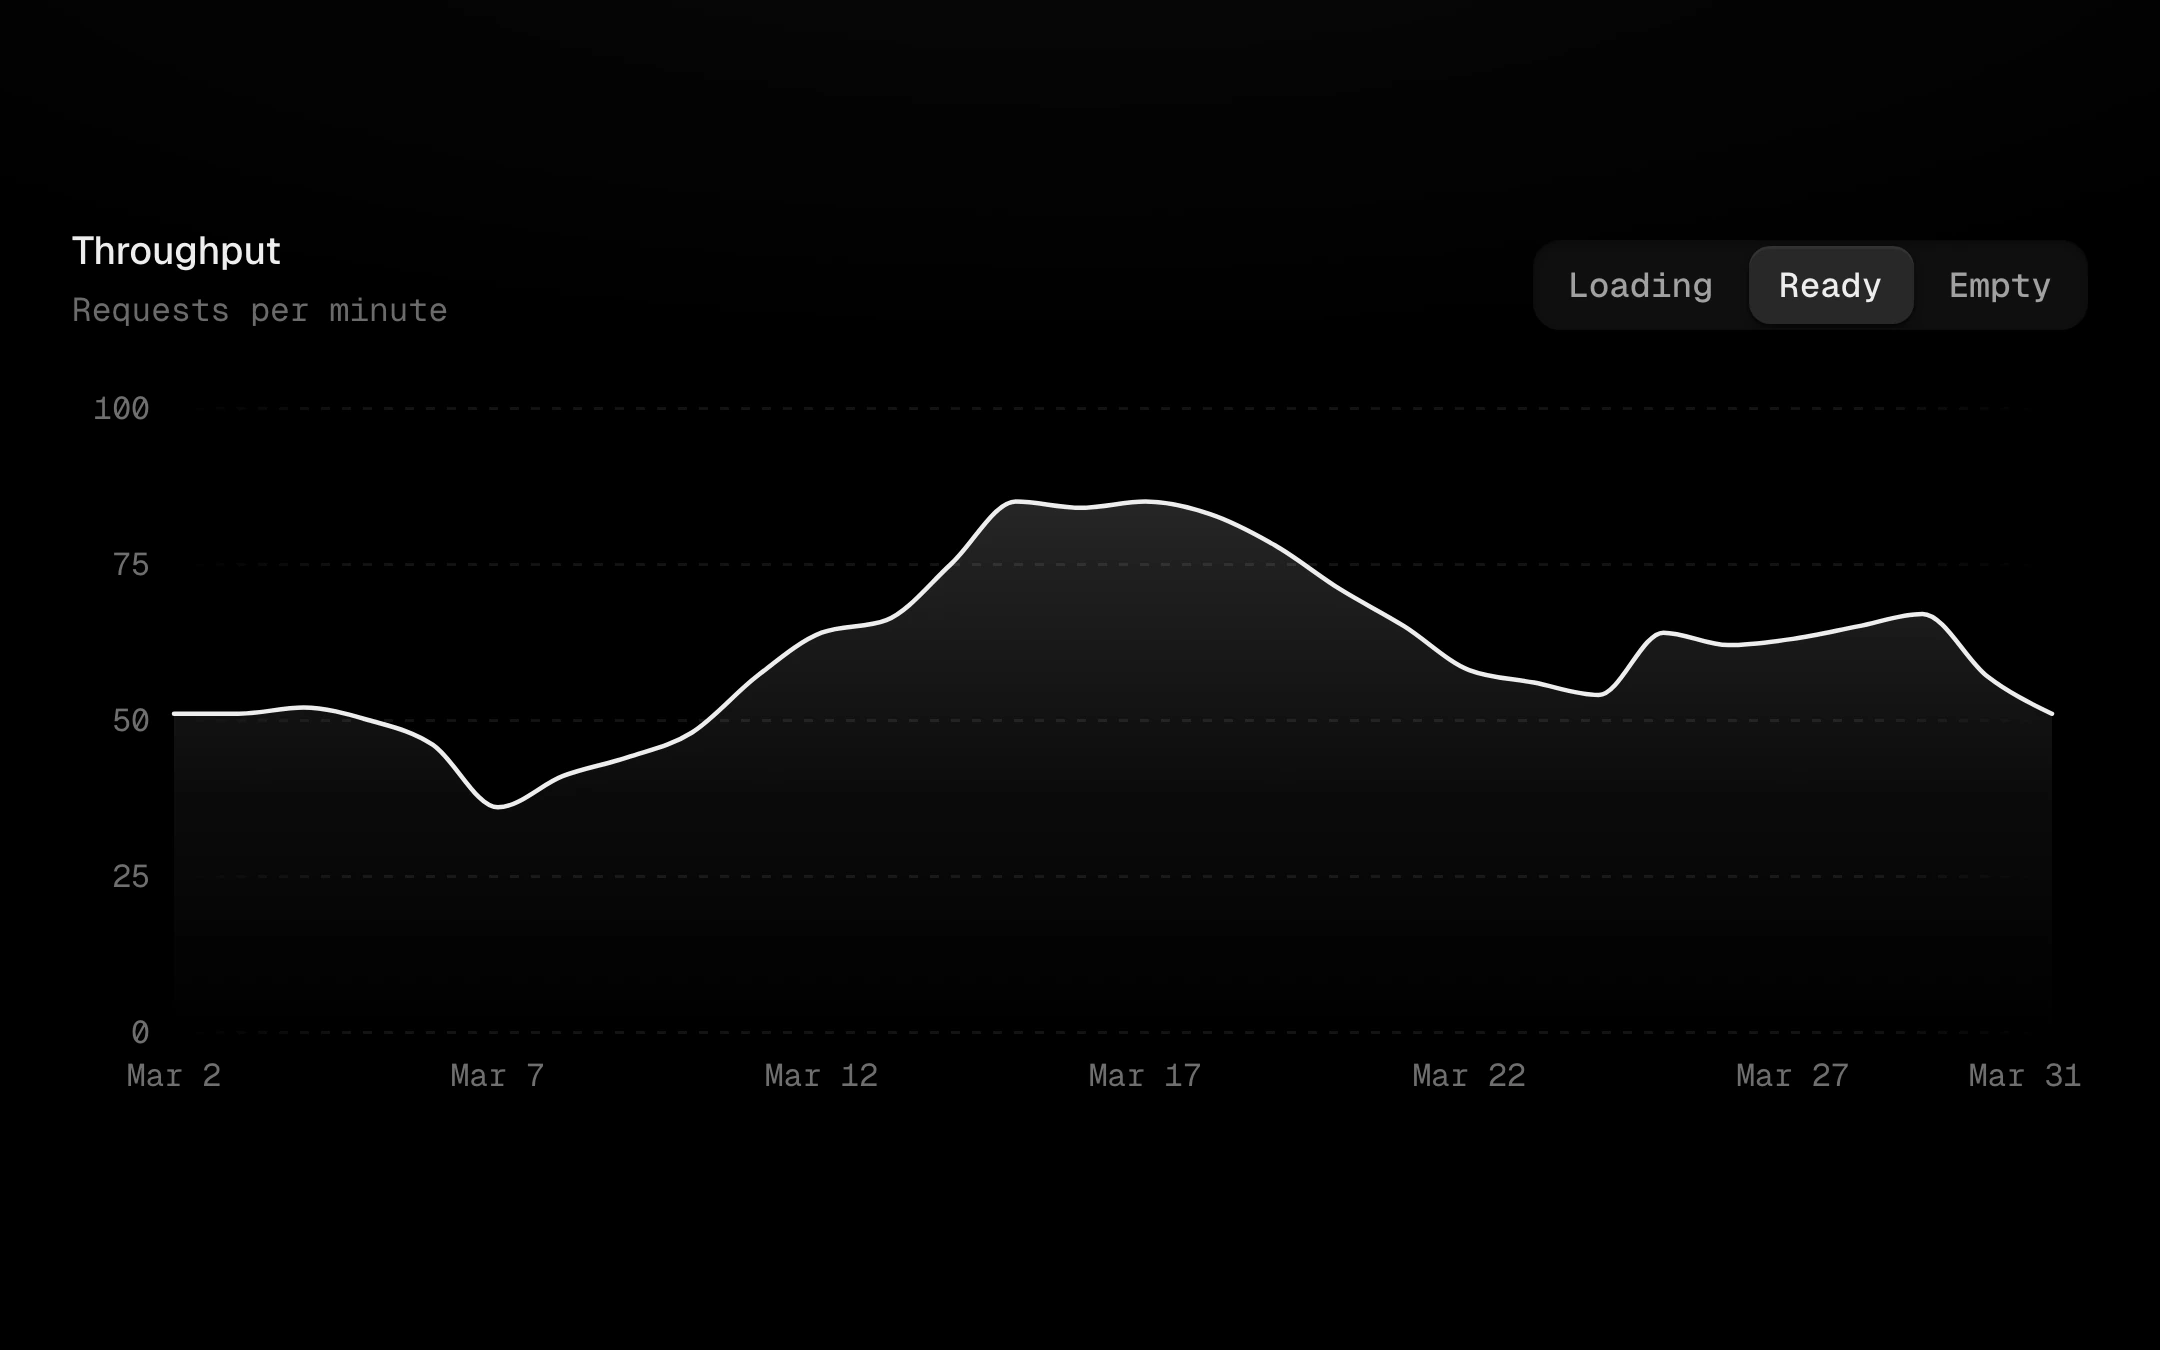
Loading, empty and ready on one chart instance, crossfading without a remount.