Bullet Chart
One measure against its target per row: three quiet bands for the qualitative ranges, a thin bone bar for the measure and a bone tick for the target; only the part past the target runs hot.
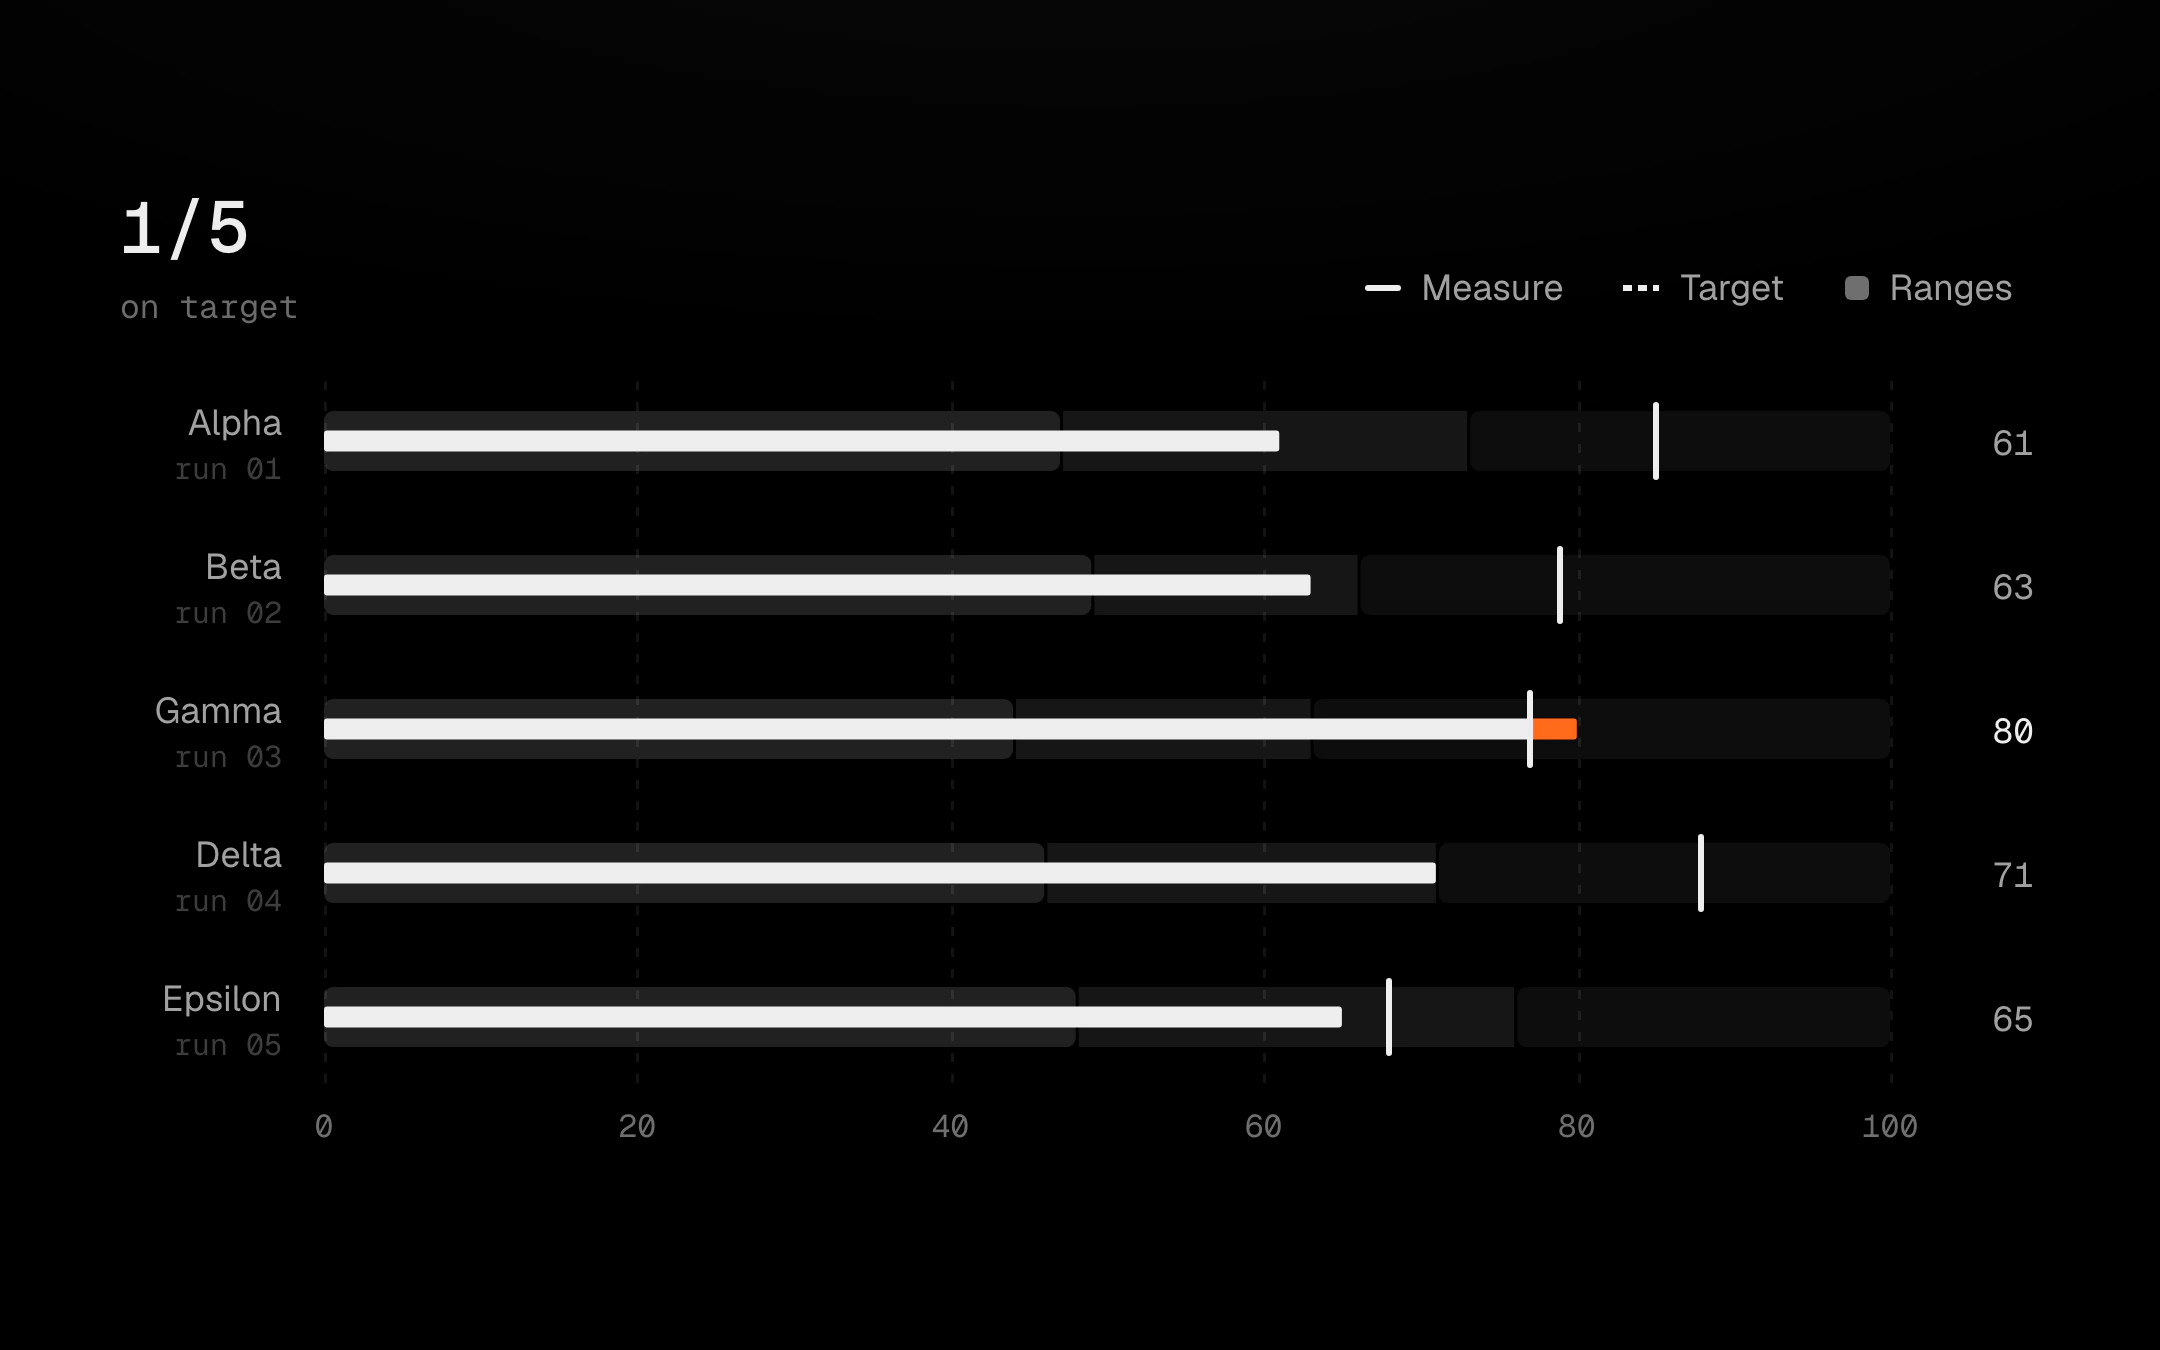
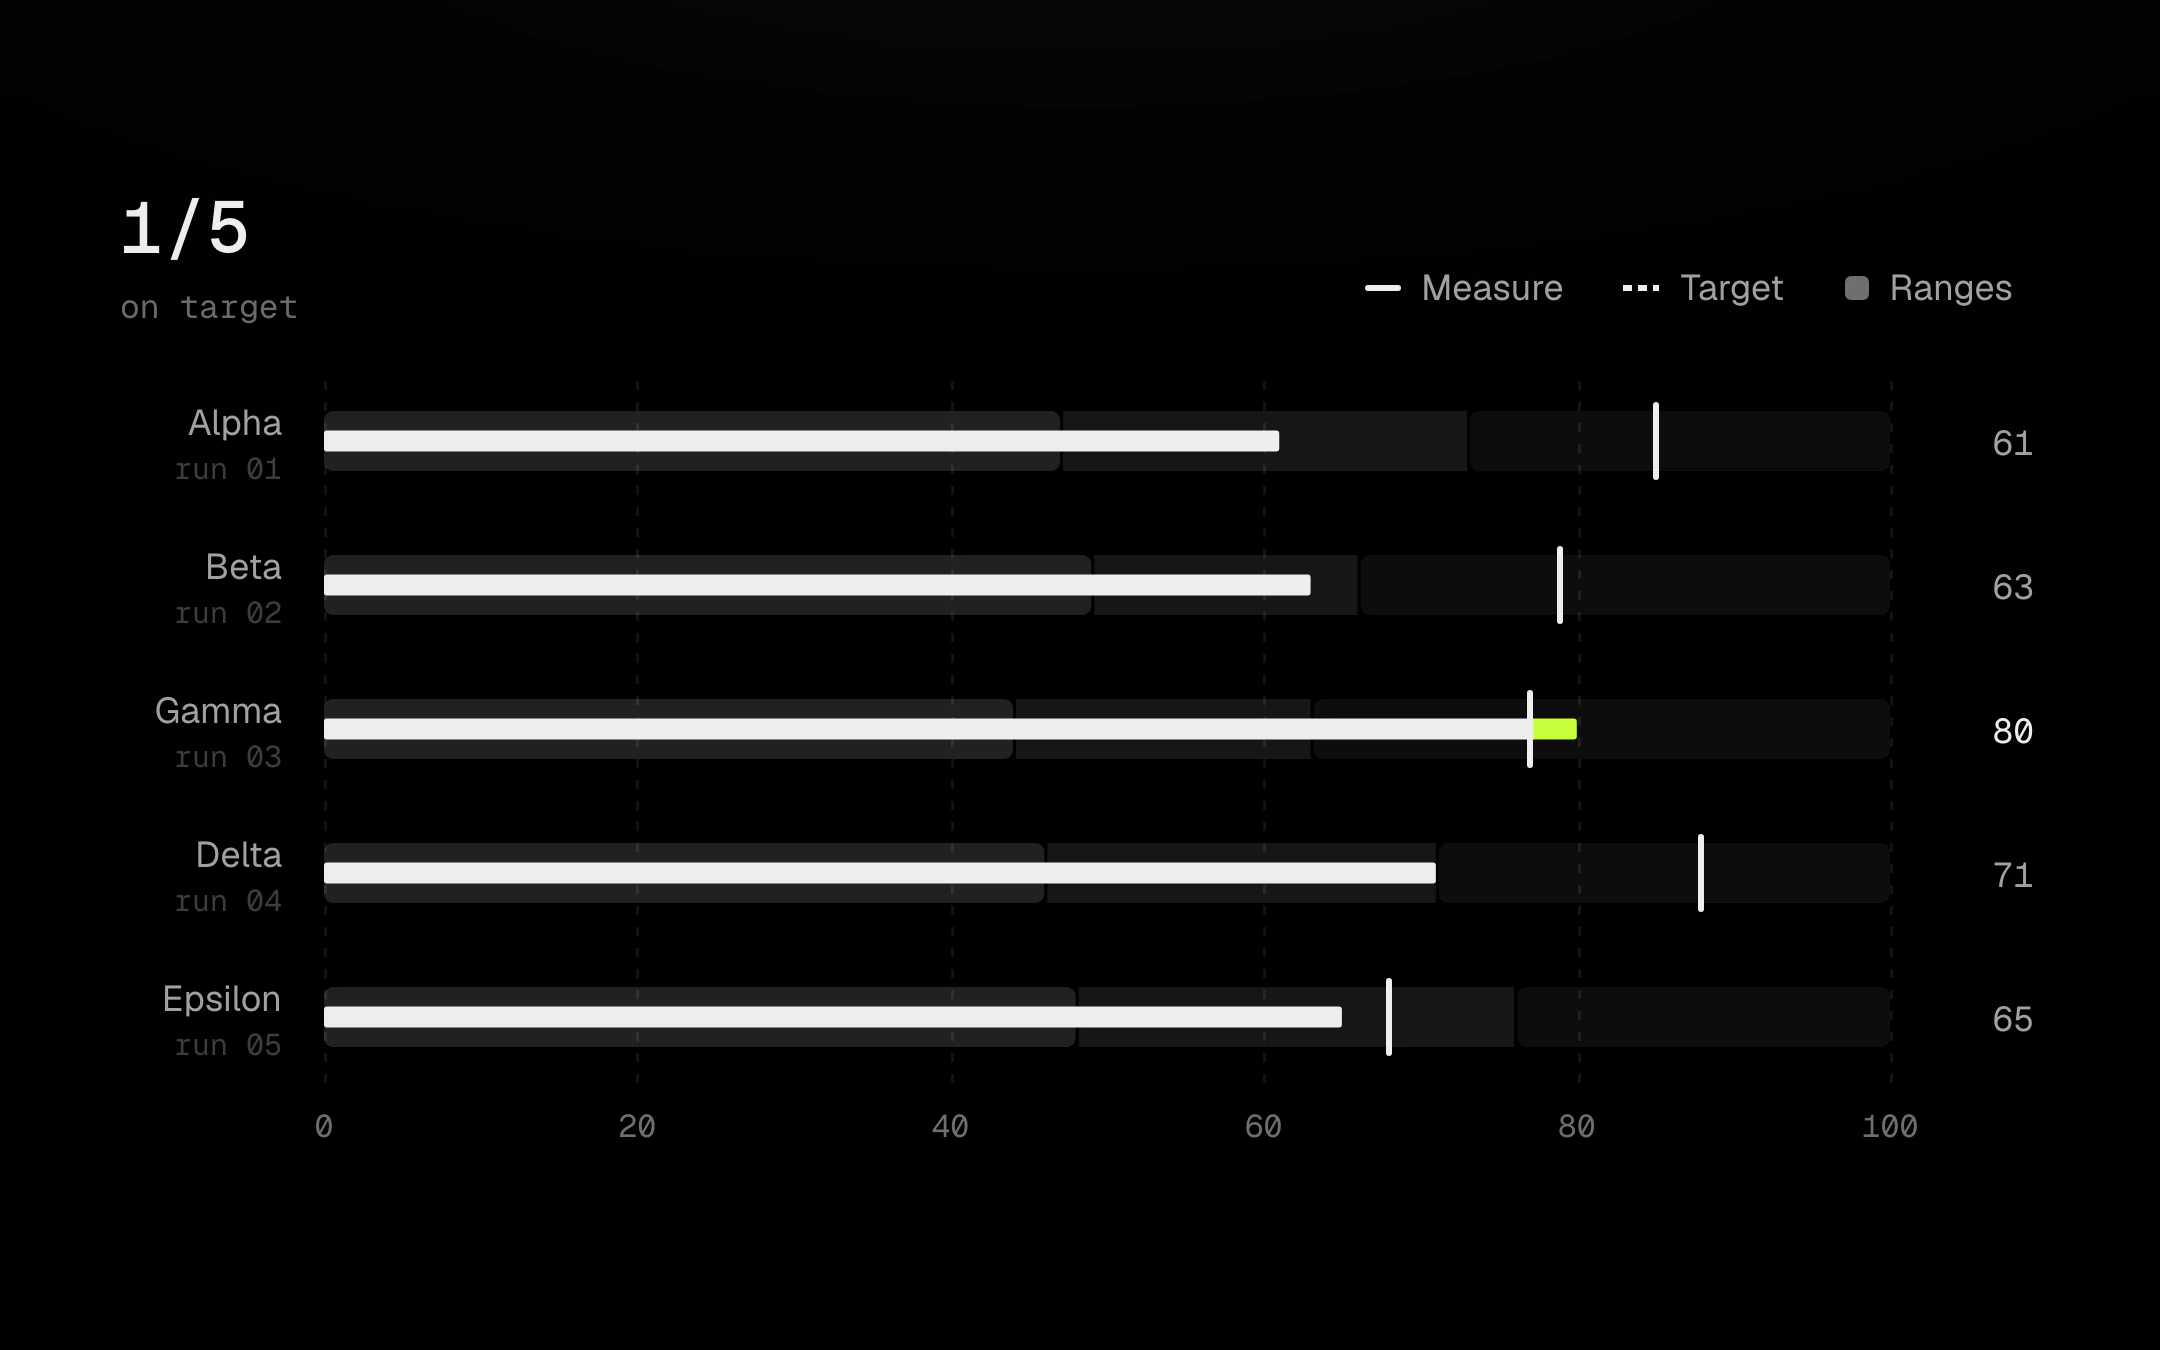
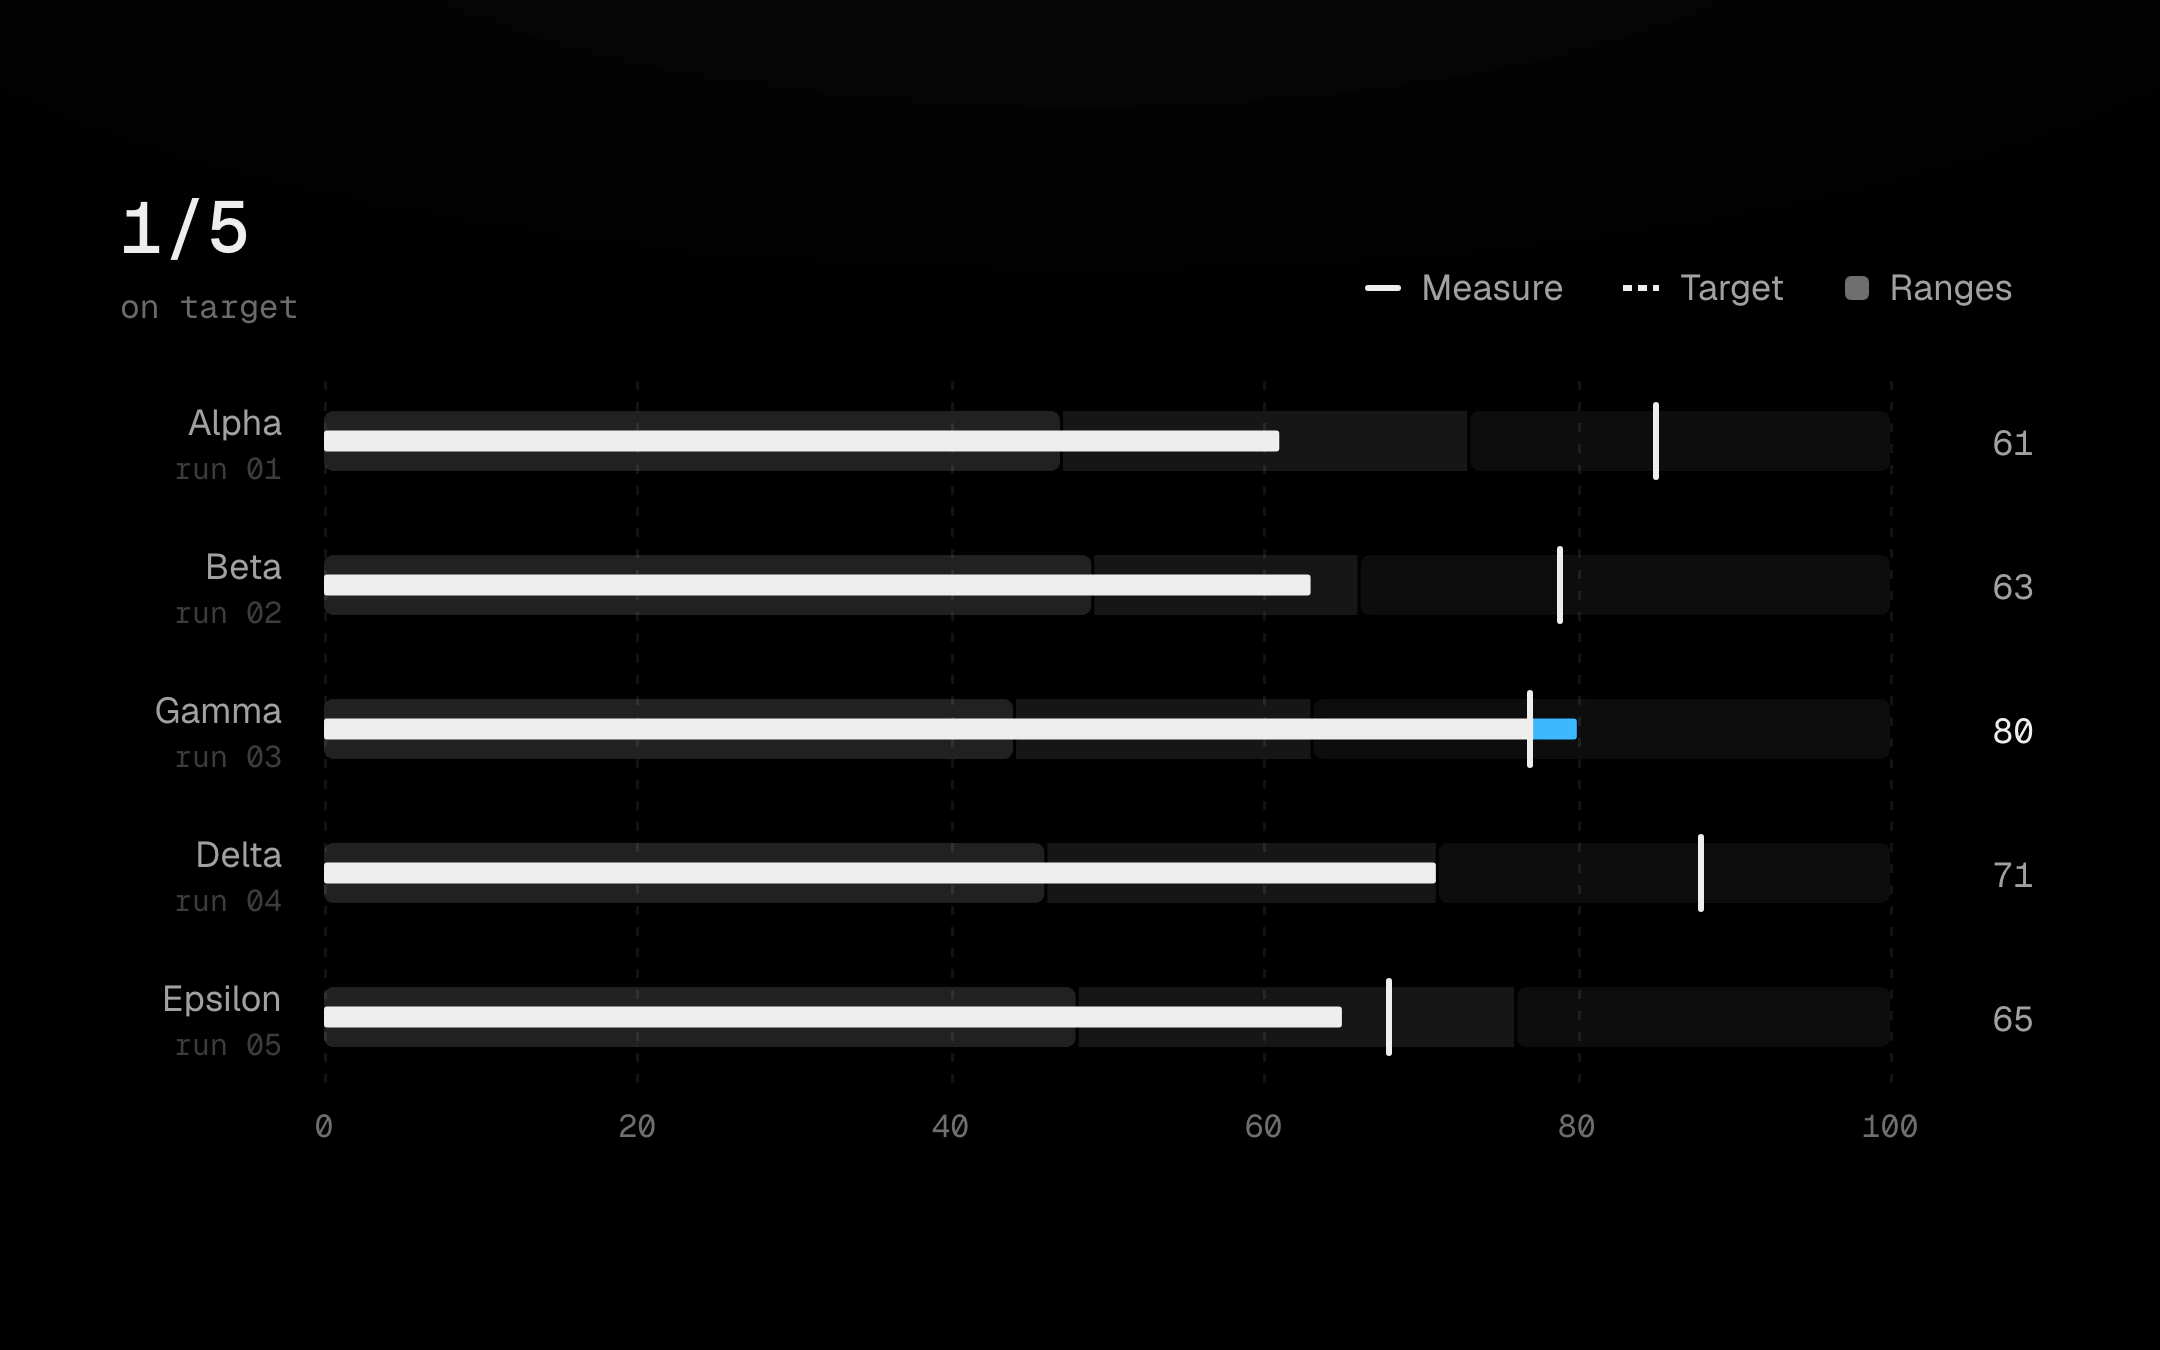
// Bullet Chart: one measure against its target per row. Three quiet bands mark the qualitative
// ranges, a thin bone bar is the measure and a bone tick is the target. Only what runs past the
// target turns hot, so the accent means one thing: over target. On mount the bars fill on
// springs, one row after another; point at a row (or use the arrow keys) and the readout rolls to
// its measure and its distance to target while the other rows step back.
//
// Built on viz-kit parts: focus store (legend ↔ layers), Legend, rolling Readout, TooltipView,
// patterns, springs and formatters. Signature: "hatch = remaining". The gap still to go between
// the measure and its target can be drawn as a hatch, so a short bar reads as unfinished work.

import { PlotCenter } from '../viz-kit/state-messages';
import { useEffect, useLayoutEffect, useMemo, useRef, type KeyboardEvent, type PointerEvent } from 'react';
import { resolveAccent, type Accent } from '../shared/accent';
import { Legend } from '../viz-kit/Legend';
import { Readout, TipMotion, TooltipView } from '../viz-kit/Tooltip';
import { nearWeight, type Obstacle } from '../viz-kit/chart';
import { bindEmphasis, useFocusEffect, useFocusStore } from '../viz-kit/focus';
import { Pattern, useSvgId, type PatternPreset } from '../viz-kit/patterns';
import { Spring, VIZ_SPRING, createLoop, prefersReducedMotion, entrySettled } from '../viz-kit/motion';
import { MINUS, fmtNumber, linearTicks, niceDomain, textWidth } from '../viz-kit/scale';
import { useChartSize } from '../viz-kit/size';
import { useTouchRead } from '../viz-kit/touch';
import '../viz-kit/viz-kit.css';
import './bullet-chart.css';

export interface BulletRow {
  name: string;
  /** A short mono note under the name ("units", "per day"). Hidden when compact. */
  sub?: string;
  value: number;
  target: number;
  /** Upper ends of the three qualitative bands. Defaults to 50%, 75% and 100% of the scale. */
  bands?: readonly [number, number, number];
}

export interface BulletChartProps {
  rows: readonly BulletRow[];
  /** Top of the shared scale; rounded up from the data when omitted. */
  max?: number;
  compact?: boolean;
  formatValue?: (v: number) => string;
  /** Accessible name of the chart. */
  label?: string;
  /* --- viz-kit options --- */
  /** Qualitative ranges: grey steps, hatched steps (dense → sparse), or none. */
  bands?: 'grey' | 'hatch' | 'none';
  /** The measure: a bar, or a dot on a hairline. */
  measure?: 'bar' | 'dot';
  /** Draw the distance still to go as a hatch from the measure to its target. */
  remaining?: boolean;
  /** The part of a measure past its target runs in the accent (default true). */
  overHot?: boolean;
  /** Old look: every target tick in the accent. */
  hotTargets?: boolean;
  /** Key with Measure / Target / Ranges; hover isolates a layer, click hides it. */
  legend?: 'row' | 'none';
  /** The rolling readout above the rows. */
  readout?: boolean;
  tooltip?: 'panel' | 'none';
  status?: 'ready' | 'loading' | 'empty';
  accent?: Accent;
  className?: string;
}

const BAND_PATTERNS: PatternPreset[] = ['diagonal-up', 'diagonal-up', 'diagonal-up-sparse'];

export function BulletChart({
  rows,
  max: maxProp,
  compact = false,
  formatValue,
  label = 'Bullet chart',
  bands: bandStyle = 'grey',
  measure = 'bar',
  remaining = false,
  overHot = true,
  hotTargets = false,
  legend = 'row',
  readout = true,
  tooltip = 'none',
  status = 'ready',
  accent: accentProp,
  className,
}: BulletChartProps) {
  const accent = resolveAccent(accentProp);
  const store = useFocusStore();
  const uid = useSvgId('bl');
  const wrapRef = useRef<HTMLDivElement>(null);
  const svgRef = useRef<SVGSVGElement>(null);
  const tipHost = useRef<HTMLDivElement>(null);
  const liveRef = useRef<HTMLDivElement>(null);
  const tip = useRef<TipMotion | null>(null);
  const { width } = useChartSize(wrapRef);

  const n = rows.length;
  const max = useMemo(() => maxProp ?? niceDomain(0, Math.max(1, ...rows.flatMap((r) => [r.value, r.target, ...(r.bands ?? [])])), { count: 4 }).domain[1], [maxProp, rows]);
  const decimals = rows.some((r) => !Number.isInteger(r.value) || !Number.isInteger(r.target)) ? 1 : 0;
  const fmt = formatValue ?? ((v: number) => fmtNumber(v, decimals));
  const signedGap = (r: BulletRow) => {
    const d = r.value - r.target;
    return `${d > 0 ? '+' : d < 0 ? MINUS : '±'}${fmt(Math.abs(d))}`;
  };

  const rowH = compact ? 30 : 48;
  const bandH = compact ? 12 : 20;
  const barH = Math.round(bandH / 3);
  const AXIS = 24;
  const labelW = Math.min(130, Math.max(48, ...rows.map((r) => textWidth(r.name, 12, false))) + 20);
  const valueW = Math.max(36, ...rows.map((r) => textWidth(fmt(r.value), 11.5))) + 14;
  const left = labelW;
  const right = Math.max(left + 40, width - valueW);
  const xOf = (v: number) => left + (Math.max(0, Math.min(max, v)) / max) * (right - left);
  const ticks = useMemo(() => linearTicks(0, max, width < 420 ? 3 : 5), [max, width]);
  const H = n * rowH + AXIS;

  const st = useRef<{ vals: Spring[]; loop: ReturnType<typeof createLoop> | null; started: boolean; t0: number }>({ vals: [], loop: null, started: false, t0: 0 });
  const els = useRef<{ bar: SVGRectElement[]; over: SVGRectElement[]; rest: SVGRectElement[]; dot: SVGCircleElement[]; stem: SVGLineElement[] }>({ bar: [], over: [], rest: [], dot: [], stem: [] });
  const geo = useRef({ xOf, rowH, bandH, barH });
  geo.current = { xOf, rowH, bandH, barH };

  const paint = () => {
    const s = st.current;
    const e = els.current;
    const { xOf: X, rowH: rh, bandH: bh, barH: brh } = geo.current;
    rows.forEach((r, i) => {
      const v = s.vals[i]?.value ?? r.value;
      const y0 = i * rh + (rh - bh) / 2;
      const cy = y0 + bh / 2;
      const x0 = X(0);
      const xv = X(v);
      const xt = X(r.target);
      const below = Math.min(xv, xt);
      const bar = e.bar[i];
      if (bar) {
        bar.setAttribute('x', String(x0));
        bar.setAttribute('y', String(cy - brh / 2));
        bar.setAttribute('width', String(Math.max(0, (overHot ? below : xv) - x0)));
        bar.setAttribute('height', String(brh));
      }
      const over = e.over[i];
      if (over) {
        over.setAttribute('x', String(xt));
        over.setAttribute('y', String(cy - brh / 2));
        over.setAttribute('width', String(Math.max(0, xv - xt)));
        over.setAttribute('height', String(brh));
      }
      const rest = e.rest[i];
      if (rest) {
        rest.setAttribute('x', String(xv + 1));
        rest.setAttribute('y', String(cy - brh / 2 - 1));
        rest.setAttribute('width', String(Math.max(0, xt - xv - 2)));
        rest.setAttribute('height', String(brh + 2));
      }
      const dot = e.dot[i];
      if (dot) {
        dot.setAttribute('cx', String(xv));
        dot.setAttribute('cy', String(cy));
      }
      const stem = e.stem[i];
      if (stem) {
        stem.setAttribute('x1', String(x0));
        stem.setAttribute('x2', String(xv));
        stem.setAttribute('y1', String(Math.round(cy) + 0.5));
        stem.setAttribute('y2', String(Math.round(cy) + 0.5));
      }
    });
  };
  const paintRef = useRef(paint);
  paintRef.current = paint;
  // The loop outlives this render: it retargets from the latest rows, never the first render's.
  const rowsRef = useRef(rows);
  rowsRef.current = rows;

  useLayoutEffect(() => {
    const s = st.current;
    // Settled entry (viz-kit motion.ts): before the entry has run, land straight on the values.
    const reduced = prefersReducedMotion() || (!s.started && entrySettled());
    if (s.vals.length !== n) s.vals = rows.map((r) => new Spring(reduced || s.started ? r.value : 0, VIZ_SPRING.land));
    if (s.started || reduced)
      s.vals.forEach((sp, i) => {
        sp.target = rows[i].value;
        if (reduced) sp.set(sp.target);
      });
    if (!s.loop)
      s.loop = createLoop((dt, now) => {
        let moving = false;
        const rs = rowsRef.current;
        s.vals.forEach((sp, i) => {
          if (s.started && sp.target !== rs[i]?.value && now - s.t0 >= i * 70) sp.target = rs[i]?.value ?? 0;
          if (s.started && sp.target !== (rs[i]?.value ?? 0)) moving = true;
          if (sp.step(dt)) moving = true;
        });
        paintRef.current();
        return moving;
      });
    s.loop.wake();
    paint();
    // eslint-disable-next-line react-hooks/exhaustive-deps
  }, [rows]);
  useLayoutEffect(() => paint());

  useEffect(() => {
    if (status !== 'ready' || !width) return;
    const s = st.current;
    if (s.started) return;
    const el = wrapRef.current;
    if (!el) return;
    const io = new IntersectionObserver((es) => {
      if (!es.some((x) => x.isIntersecting)) return;
      io.disconnect();
      s.started = true;
      s.t0 = performance.now();
      s.loop?.wake();
    });
    io.observe(el);
    return () => io.disconnect();
  }, [status, width]);
  useEffect(
    () => () => {
      st.current.loop?.stop();
      st.current.loop = null;
    },
    [],
  );

  useLayoutEffect(() => (svgRef.current ? bindEmphasis(svgRef.current, store) : undefined), [store, n, width > 0]);

  useLayoutEffect(() => {
    if (tooltip !== 'panel' || !tipHost.current) return;
    tip.current = new TipMotion(new TooltipView(tipHost.current, { roll: true }), { tight: true });
    return () => {
      tip.current?.destroy();
      tip.current = null;
    };
  }, [tooltip]);

  useFocusEffect(
    store,
    (s, p) => {
      if (s !== p && s.index === p.index) return;
      const svg = svgRef.current;
      if (!svg) return;
      const i = s.index;
      svg.toggleAttribute('data-active', i !== null);
      svg.querySelectorAll<SVGGElement>('[data-row]').forEach((g) => g.toggleAttribute('data-on', Number(g.getAttribute('data-row')) === i));
      const t = tip.current;
      if (t) {
        if (i === null || !rows[i]) t.clear();
        else {
          const r = rows[i];
          const d = r.value - r.target;
          t.update({
            title: r.name,
            rows: [
              { label: 'Measure', value: fmt(r.value), marker: 'line', color: 'var(--viz-1)', hot: d > 0 },
              { label: 'Target', value: fmt(r.target), marker: 'dash', color: 'var(--viz-2)' },
            ],
            delta: { text: `${d > 0 ? '▲' : d < 0 ? '▼' : '·'} ${signedGap(r)} to target`, dir: d > 0 ? 'up' : d < 0 ? 'down' : 'flat' },
          });
          // Beside the row's bar and target, clear of the rows above and below (their bar ends,
          // targets and values) and of this row's value.
          const { xOf: X, rowH: rh, bandH: bh } = geo.current;
          const W = svg.clientWidth || 0;
          const band = (j: number) => ({ y0: j * rh + rh / 2 - bh / 2 - 2, y1: j * rh + rh / 2 + bh / 2 + 2 });
          const obs: Obstacle[] = [];
          rows.forEach((o, j) => {
            if (j === i) return;
            const w = nearWeight(Math.abs(j - i));
            obs.push({ x0: X(Math.min(o.value, o.target)) - 6, x1: X(Math.max(o.value, o.target)) + 6, ...band(j), w });
            obs.push({ x0: X(0), x1: X(Math.max(o.value, o.target)), ...band(j), w: 0.15 });
            obs.push({ x0: X(max) + 4, x1: W, ...band(j), w: w * 0.8 });
          });
          obs.push({ x0: X(max) + 4, x1: W, ...band(i), w: Infinity });
          t.show(
            {
              bounds: { x0: 0, y0: 0, x1: W, y1: svg.clientHeight || n * rh },
              plot: { x0: X(0), y0: 0, x1: X(max), y1: n * rh },
              anchor: { x0: X(0), x1: X(Math.max(r.value, r.target)) + 3, ...band(i) },
              obstacles: obs,
              home: 'r-mid',
            },
            { on: 1 },
          );
        }
      }
      if (i !== null && rows[i] && s.source === 'keyboard' && liveRef.current) {
        const r = rows[i];
        liveRef.current.textContent = `${r.name}: ${fmt(r.value)} against a target of ${fmt(r.target)}, ${r.value >= r.target ? 'over by' : 'short by'} ${fmt(Math.abs(r.value - r.target))}`;
      }
    },
    [rows, tooltip],
  );

  const rowAt = (clientY: number) => {
    const rect = svgRef.current!.getBoundingClientRect();
    const i = Math.floor((clientY - rect.top) / rowH);
    return i >= 0 && i < n ? i : null;
  };
  const onMove = (e: PointerEvent<SVGSVGElement>) => status === 'ready' && store.set({ index: rowAt(e.clientY), source: 'chart' });
  const touchRead = useTouchRead(() => store.set({ index: null, source: 'chart' }));
  const onKey = (e: KeyboardEvent<SVGSVGElement>) => {
    if (!n || status !== 'ready') return;
    const cur = store.get().index;
    let next: number;
    if (e.key === 'ArrowDown' || e.key === 'ArrowRight') next = cur === null ? 0 : Math.min(n - 1, cur + 1);
    else if (e.key === 'ArrowUp' || e.key === 'ArrowLeft') next = cur === null ? n - 1 : Math.max(0, cur - 1);
    else if (e.key === 'Home') next = 0;
    else if (e.key === 'End') next = n - 1;
    else if (e.key === 'Escape') {
      store.set({ index: null, source: 'keyboard' });
      return;
    } else return;
    e.preventDefault();
    store.set({ index: next, source: 'keyboard' });
  };

  const onTarget = rows.filter((r) => r.value >= r.target).length;
  const showLegend = legend !== 'none';

  return (
    <div className={`bl${compact ? ' bl--compact' : ''}${className ? ' ' + className : ''}`} data-accent={accent} data-status={status} data-measure={measure} data-hot-targets={hotTargets ? '' : undefined}>
      {(readout || showLegend) && (
        <div className="bl-head">
          {readout ? (
            <div className="bl-readout">
              <Readout store={store} value={(i) => (rows[i] ? fmt(rows[i].value) : '')} rest={() => (status === 'ready' ? `${onTarget}/${n}` : '—')} className="bl-big" />
              <Readout store={store} value={(i) => (rows[i] ? `${rows[i].name} · ${signedGap(rows[i])} to target` : '')} rest={() => 'on target'} className="bl-small" />
            </div>
          ) : (
            <span />
          )}
          {showLegend && (
            <Legend
              store={store}
              items={[
                { id: 'measure', label: 'Measure', marker: 'line', color: 'var(--viz-1)' },
                { id: 'target', label: 'Target', marker: 'dash', color: hotTargets ? 'var(--viz-hot)' : 'var(--viz-1)' },
                { id: 'bands', label: 'Ranges', marker: bandStyle === 'hatch' ? 'pattern' : 'square', pattern: bandStyle === 'hatch' ? 'diagonal-up' : undefined, color: 'var(--viz-4)' },
              ]}
              label={`${label} key`}
            />
          )}
        </div>
      )}
      <div ref={wrapRef} className="bl-plot" data-u2-plot="" style={{ height: H }}>
        {width > 0 && (
          <svg
            ref={svgRef}
            className="bl-svg"
            width={width}
            height={H}
            tabIndex={status === 'ready' ? 0 : -1}
            role="img"
            aria-label={`${label}: ${onTarget} of ${n} on target. Arrow keys read rows.`}
            onPointerMove={onMove}
            onPointerDown={onMove}
            {...touchRead}
            onKeyDown={onKey}
            onBlur={() => store.set({ index: null, source: 'keyboard' })}
          >
            <defs>
              {bandStyle === 'hatch' && BAND_PATTERNS.map((p, k) => <Pattern key={k} id={`${uid}-b${k}`} preset={p} color="var(--viz-3)" opacity={[0.55, 0.32, 0.3][k]} />)}
              {remaining && <Pattern id={`${uid}-rest`} preset="diagonal-up" color="var(--viz-1)" opacity={0.7} />}
            </defs>
            {ticks.map((t) => (
              <g key={t} className="bl-tick">
                <line x1={Math.round(xOf(t)) + 0.5} x2={Math.round(xOf(t)) + 0.5} y1={4} y2={n * rowH} />
                <text x={xOf(t)} y={n * rowH + 16} textAnchor="middle">
                  {fmt(t)}
                </text>
              </g>
            ))}
            {rows.map((r, i) => {
              const ends = r.bands ?? ([max * 0.5, max * 0.75, max] as const);
              const y0 = i * rowH + (rowH - bandH) / 2;
              const over = r.value > r.target;
              return (
                <g key={i} data-row={i} data-over={over ? '' : undefined} className="bl-row">
                  <rect className="bl-hl" x={2} y={i * rowH + 2} width={Math.max(0, width - 4)} height={rowH - 4} rx={8} />
                  <text className="bl-name" x={left - 14} y={compact || !r.sub ? i * rowH + rowH / 2 : i * rowH + rowH / 2 - 6} textAnchor="end" dominantBaseline="central">
                    {r.name}
                  </text>
                  {!compact && r.sub && (
                    <text className="bl-sub" x={left - 14} y={i * rowH + rowH / 2 + 9} textAnchor="end" dominantBaseline="central">
                      {r.sub}
                    </text>
                  )}
                  {bandStyle !== 'none' && (
                    <g data-viz-series="bands" className="bl-bands">
                      {ends.map((end, k) => {
                        const from = k === 0 ? 0 : ends[k - 1];
                        const x0 = xOf(from);
                        return (
                          <rect
                            key={k}
                            x={x0 + (k ? 1 : 0)}
                            y={y0}
                            width={Math.max(0, xOf(end) - x0 - (k ? 1 : 0))}
                            height={bandH}
                            rx={k === 0 ? 3 : k === 2 ? 3 : 0}
                            data-k={k}
                            style={{ fill: bandStyle === 'hatch' ? `url(#${uid}-b${k})` : undefined }}
                          />
                        );
                      })}
                    </g>
                  )}
                  <g data-viz-series="measure" className="bl-measure">
                    {remaining && r.value < r.target && (
                      <rect
                        className="bl-rest"
                        style={{ fill: `url(#${uid}-rest)` }}
                        ref={(el) => {
                          els.current.rest[i] = el!;
                        }}
                      />
                    )}
                    {measure === 'bar' ? (
                      <>
                        <rect
                          className="bl-bar"
                          rx={1}
                          ref={(el) => {
                            els.current.bar[i] = el!;
                          }}
                        />
                        {overHot && (
                          <rect
                            className="bl-over"
                            rx={1}
                            ref={(el) => {
                              els.current.over[i] = el!;
                            }}
                          />
                        )}
                      </>
                    ) : (
                      <>
                        <line
                          className="bl-stem"
                          ref={(el) => {
                            els.current.stem[i] = el!;
                          }}
                        />
                        <circle
                          className="bl-dot"
                          r={compact ? 3.5 : 4.5}
                          ref={(el) => {
                            els.current.dot[i] = el!;
                          }}
                        />
                      </>
                    )}
                  </g>
                  <rect data-viz-series="target" className="bl-target" x={Math.round(xOf(r.target)) - 1} y={y0 - 3} width={2} height={bandH + 6} rx={1} />
                  <text className="bl-val" x={width - 2} y={i * rowH + rowH / 2} textAnchor="end" dominantBaseline="central">
                    {fmt(r.value)}
                  </text>
                </g>
              );
            })}
          </svg>
        )}
        {status !== 'ready' && (
          <div className="bl-state">
            {status === 'loading' ? (
              <>
                {Array.from({ length: Math.max(2, n) }, (_, k) => (
                  <span key={k} className="bl-ph" style={{ top: k * rowH + (rowH - bandH) / 2, left, right: valueW, height: bandH, animationDelay: `${k * 80}ms` }} />
                ))}
                <PlotCenter plot={{ x: left, y: 0, width: right - left, height: Math.max(2, n) * rowH }}>
                  <span className="bl-state-chip">Loading</span>
                </PlotCenter>
              </>
            ) : (
              <PlotCenter plot={{ x: left, y: 0, width: right - left, height: Math.max(1, n) * rowH }}>
                <span className="bl-state-empty">No measures yet</span>
              </PlotCenter>
            )}
          </div>
        )}
        <div ref={tipHost} className="bl-tip-host" />
      </div>
      <div ref={liveRef} className="em-sr" aria-live="polite" />
    </div>
  );
}

export default BulletChart;
Customize
012345678905
grey
hatch
none
bar
dot
row
none
none
panel
ready
loading
empty
012345678909
On mount the bars fill on springs, one row after another; point at a row or use the arrow keys and the readout rolls to its measure and distance to target while the other rows step back. Options: hatched remaining (the distance still to go), hatched ranges, a dot measure, a key that isolates and hides measure, target or ranges, a tooltip panel, hot target ticks, and loading and empty states.
Install
npx shadcn@latest add https://obsydeui.com/r/bullet-chart.jsonUsage
Import it from where the CLI puts it, or copy the files below by hand.
import { BulletChart } from '@/components/obsyde/ember/bullet-chart/BulletChart';

export function Example() {
  return (
    <BulletChart rows={5} />
  );
}
Files
Plain React, TypeScript and CSS. No dependencies. The download keeps these paths.
ember/bullet-chart/BulletChart.tsxcomponentember/bullet-chart/bullet-chart.cssstylesember/bullet-chart/BulletChartDemo.tsxdemoember/viz-kit/viz-kit.csssharedember/viz-kit/state-messages.tsxsharedember/viz-kit/Tooltip.tsxsharedember/viz-kit/focus.tssharedember/viz-kit/patterns.tsxsharedember/viz-kit/roll.tssharedember/shared/rolling-number.csssharedember/shared/spring.tssharedember/shared/accent.tssharedember/viz-kit/scale.tssharedember/viz-kit/motion.tssharedember/viz-kit/chart.tsxsharedember/shared/ember.csssharedember/viz-kit/touch.tssharedember/viz-kit/keyboard.tssharedember/viz-kit/size.tssharedember/viz-kit/Legend.tsxsharedember/viz-kit/demo.tsxsharedember/viz-kit/demo.cssshared
API
| Prop | Type | Default |
|---|---|---|
accentAccent | 'ember' | 'volt' | 'arc' | 'ember' |
rowsRows | number | 5 |
compactCompact | boolean | false |
bandsRanges | 'grey' | 'hatch' | 'none' | 'grey' |
measureMeasure | 'bar' | 'dot' | 'bar' |
remainingRemaining hatch | boolean | false |
overHotOver target hot | boolean | true |
hotTargetsHot targets | boolean | false |
readoutReadout | boolean | true |
legendLegend | 'row' | 'none' | 'row' |
tooltipTooltip | 'none' | 'panel' | 'none' |
statusStatus | 'ready' | 'loading' | 'empty' | 'ready' |
seedSeed | number | 9 |