Chart Annotations
The chart kit layers that explain data, each on a real chart.
$149 once · every Pro piece
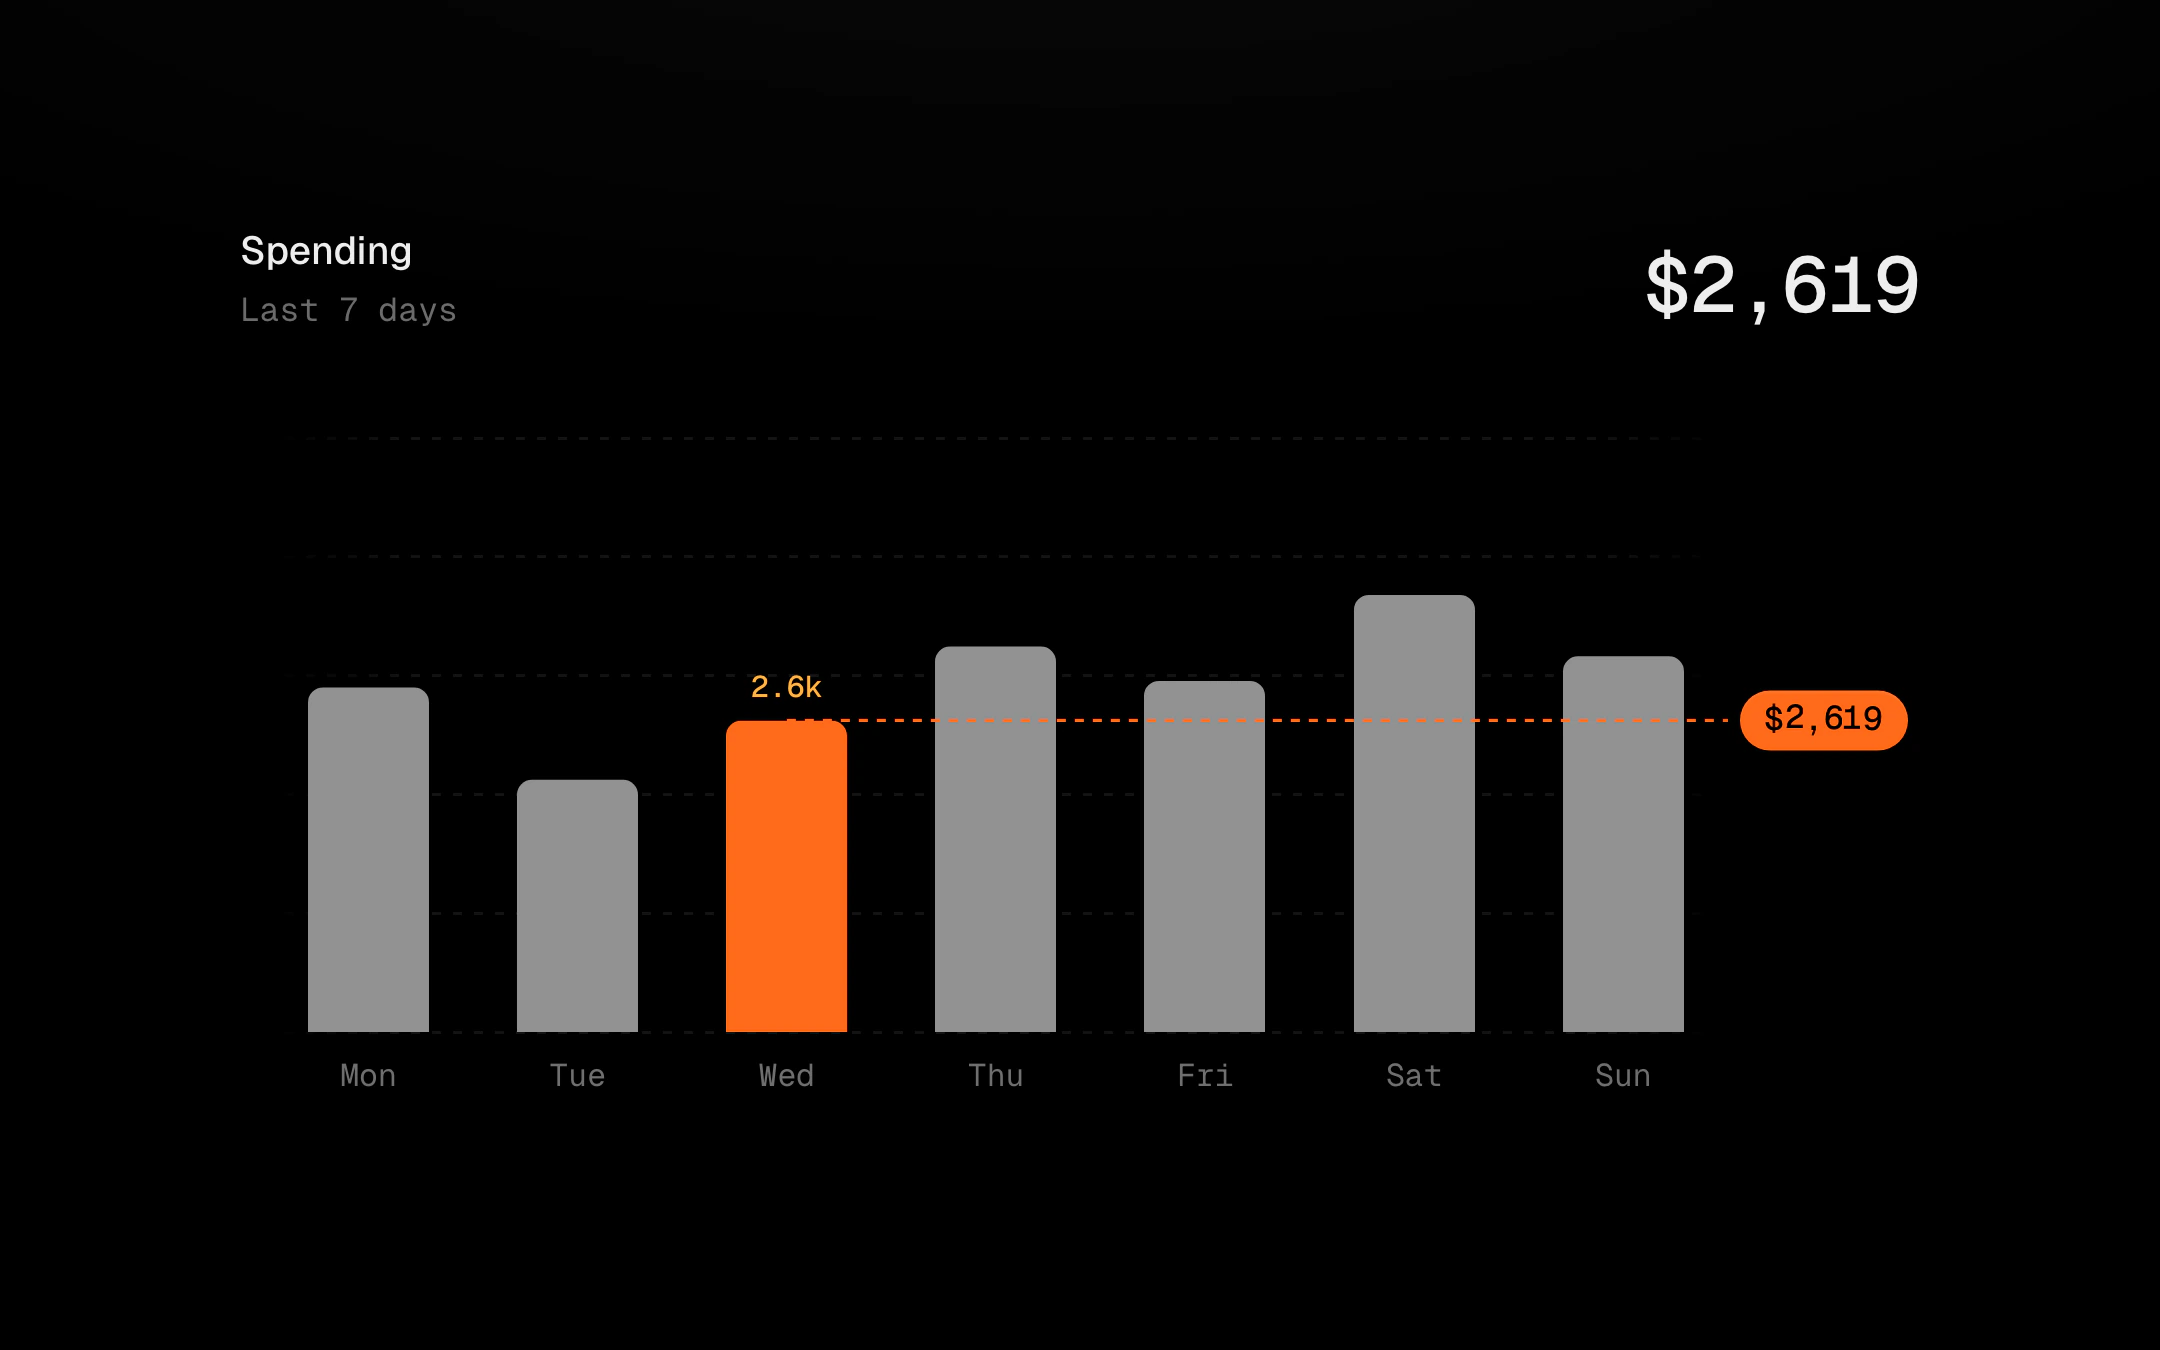
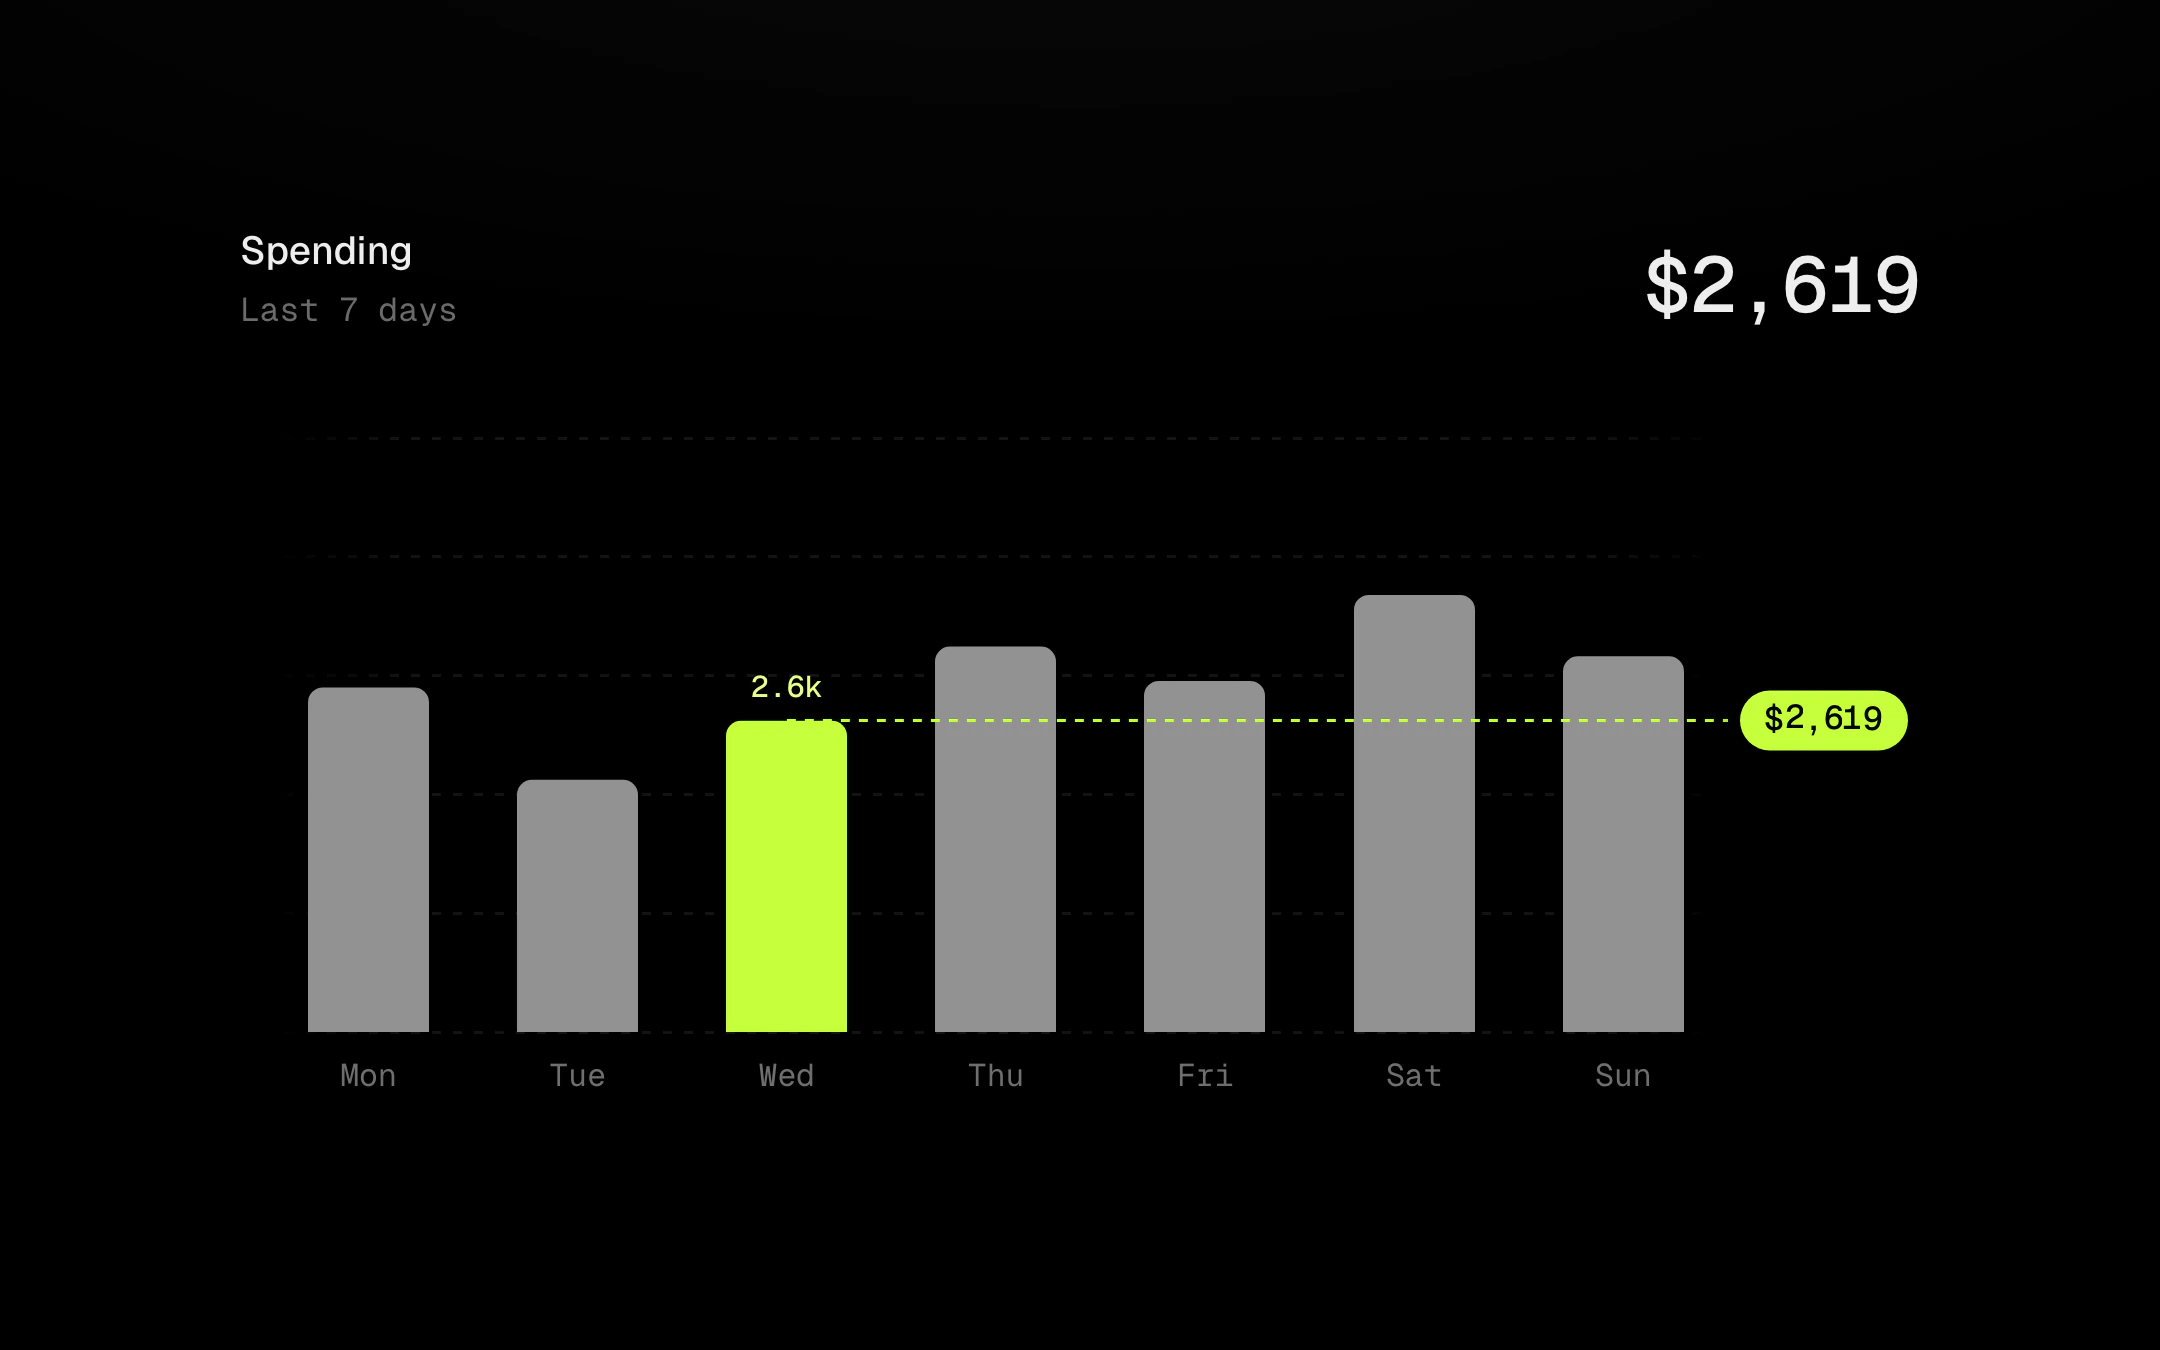
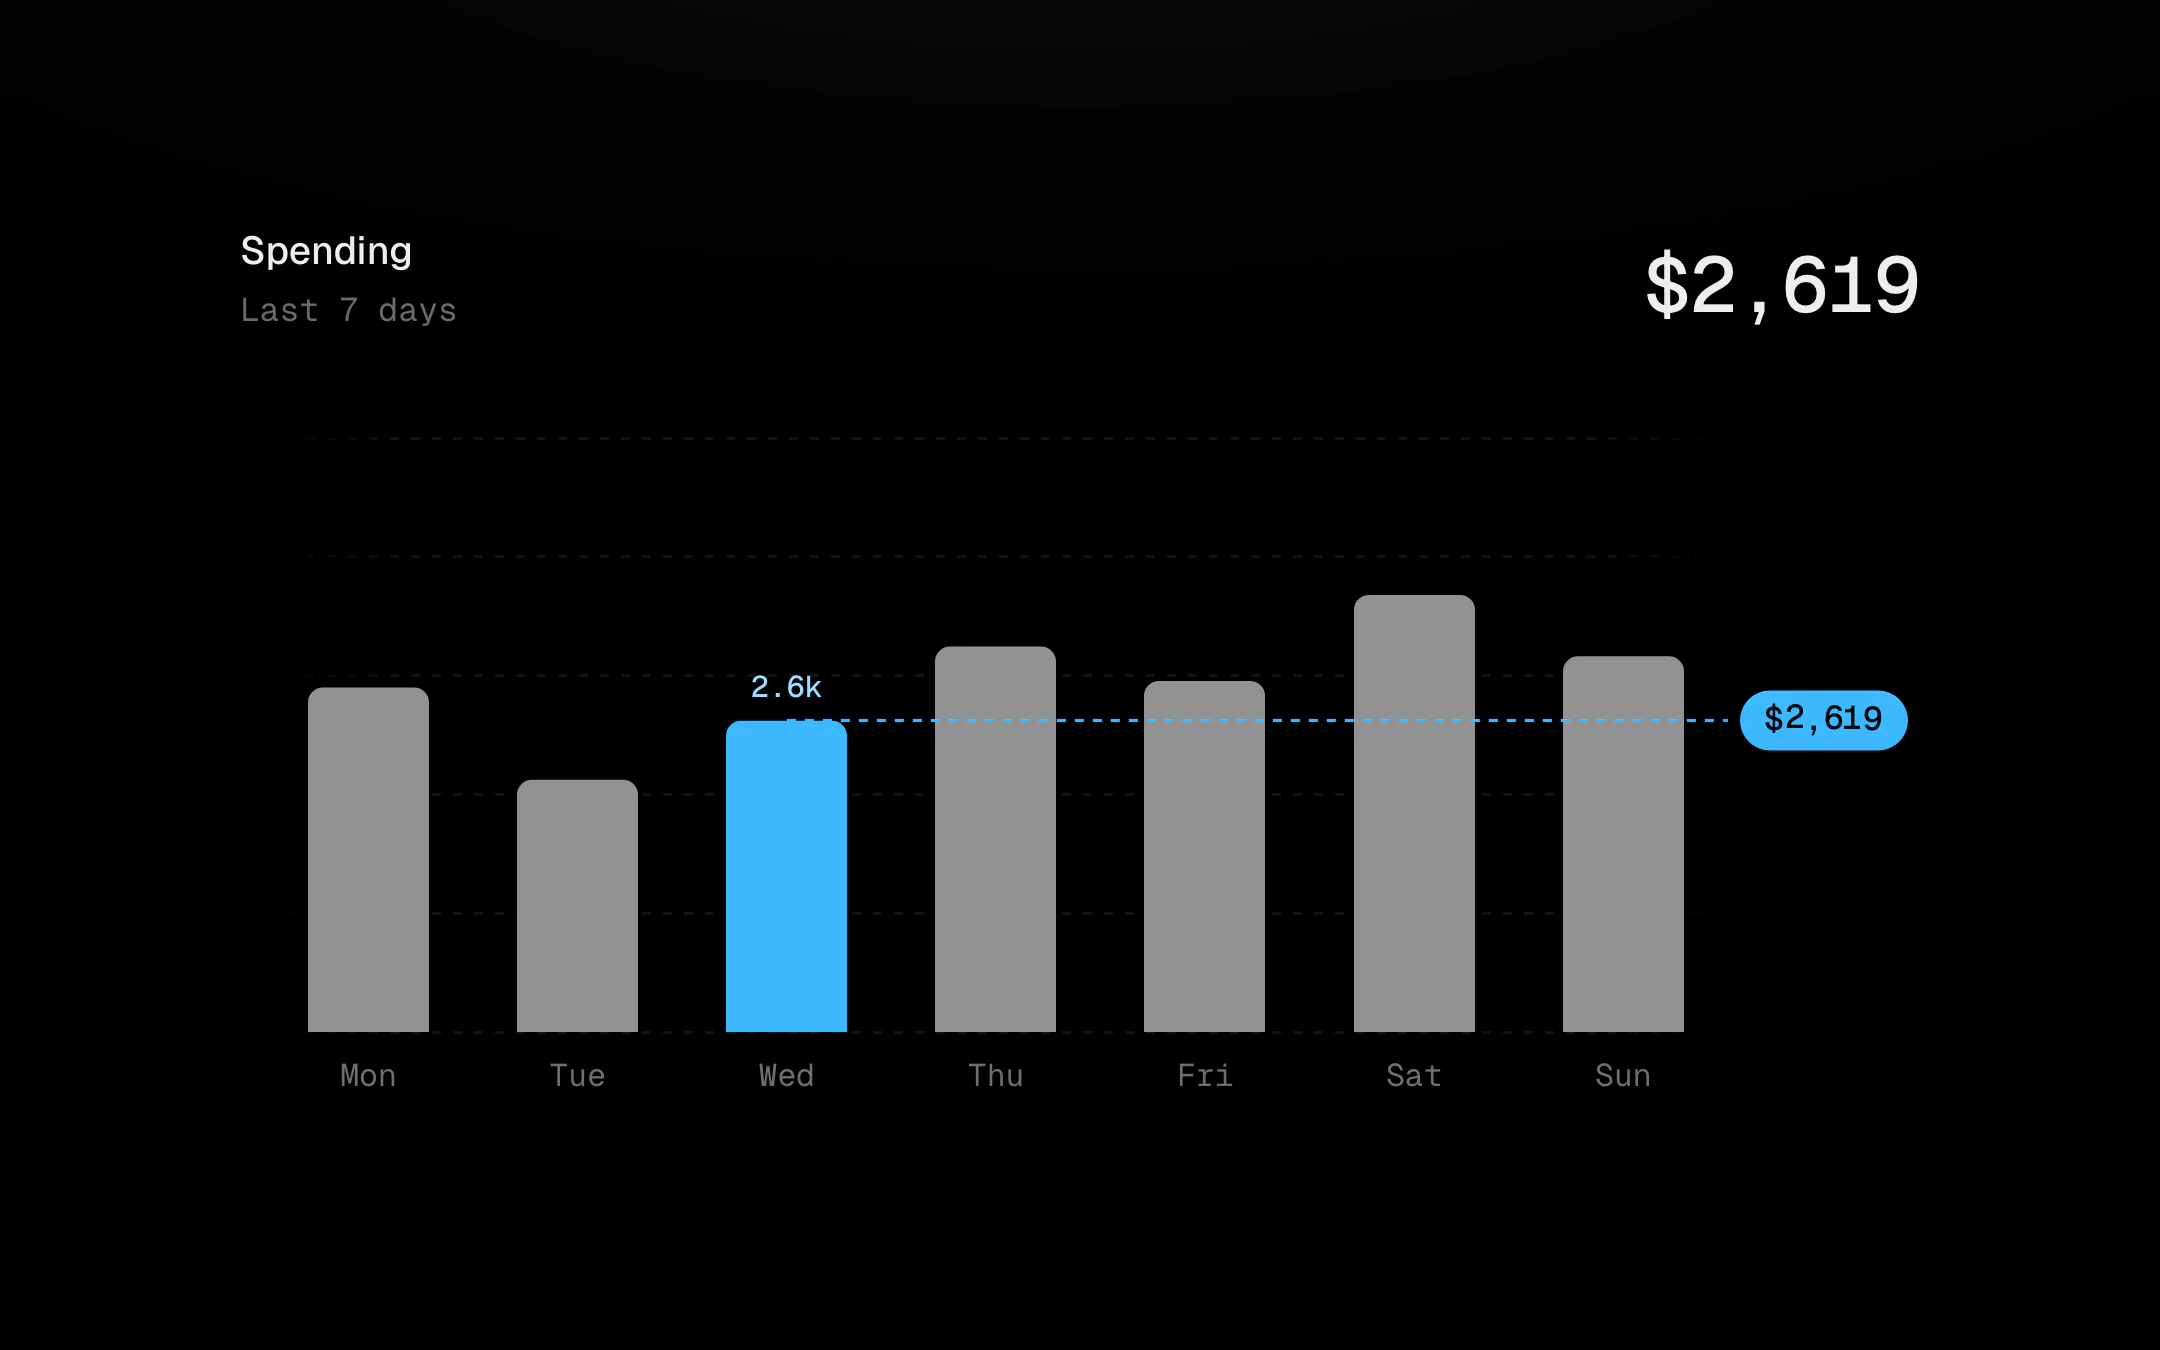
The selected value as a dashed leader with a hot value pill, the one accent on a grey chart. A band of normal with inward brackets and tinted axis ticks under a Bollinger envelope; only stretches past the limit run hot. A least-squares trend that tweens to its new fit. A projection with a widening cone and a horizon dot. A code freeze over weekend stripes, with a brush whose outside is dimmed and blurred. A dashed tail for the day still counting. Event badges above the plot whose stacks fan out in an arc on hover. Events as sparks on the line that ping as the crosshair passes while the scrubbed path glows and cools. And a pilot light on the last point that breathes while data is fresh and goes ash when it stops.
Install
npx shadcn@latest add @obsyde/chart-annotationsNeeds your licence key · Get Pro
Usage
Import it from where the CLI puts it, or copy the files below by hand.
import { ChartAnnotationsDemo } from '@/components/obsyde/ember/chart-annotations/ChartAnnotationsDemo';

export function Example() {
  return (
    <ChartAnnotationsDemo view="reference" />
  );
}
Files
What you get with Pro: plain React, TypeScript and CSS, with no dependencies.
ember/chart-annotations/ChartAnnotationsDemo.tsxcomponentember/chart-annotations/chart-annotations.cssstylesember/viz-kit/viz-kit.csssharedember/viz-kit/Tooltip.tsxsharedember/viz-kit/focus.tssharedember/viz-kit/patterns.tsxsharedember/viz-kit/roll.tssharedember/shared/rolling-number.csssharedember/shared/spring.tssharedember/shared/accent.tssharedember/viz-kit/scale.tssharedember/viz-kit/motion.tssharedember/viz-kit/chart.tsxsharedember/shared/ember.csssharedember/viz-kit/touch.tssharedember/viz-kit/keyboard.tssharedember/viz-kit/size.tssharedember/viz-kit/shape.tssharedember/viz-kit/series.tsxsharedember/viz-kit/Grid.tsxsharedember/viz-kit/demo.tsxsharedember/viz-kit/demo.csssharedember/viz-kit/Brush.tsxsharedember/viz-kit/Axis.tsxsharedember/viz-kit/annotations.tsxshared
API
| Prop | Type | Default |
|---|---|---|
accentAccent | 'ember' | 'volt' | 'arc' | 'ember' |
viewView | 'reference' | 'band' | 'trend' | 'projection' | 'deadline' | 'tail' | 'markers' | 'sparks' | 'pilot' | 'select' | 'reference' |
fillFill | 'pattern' | 'gradient' | 'solid' | 'pattern' |
trendTrend | 'gradient' | 'dashed' | 'solid' | 'gradient' |
projectionProjection | 'regression' | 'last-segment' | 'target' | 'regression' |
liveLive | boolean | true |
valueLabelsValue labels | boolean | true |
curveCurve | 'monotone' | 'linear' | 'catmull' | 'step' | 'monotone' |
seedSeed | number | 8 |